
 ?Mathematical formulae have been encoded as MathML and are displayed in this HTML version using MathJax in order to improve their display. Uncheck the box to turn MathJax off. This feature requires Javascript. Click on a formula to zoom.
ABSTRACT
Previous research on the binding of SA (SA) and calcium ions mainly concentrated on the high concentration solutions and formation of gels. While it was hard to provide details of the behaviors of SA polymer during the binding process. In order to study individual polymer, all the experiments were carried out on diluted solutions in this research. The morphological change of SA self-assembly under the effects of calcium ions was observed using atomic force microscopy, and the change of molecular dimension with the addition of calcium ions was characterized through viscosity data. The SA showed a tendency to form network on the initial addition of calcium ions and the chains broke into rods or particles along with continuous addition of calcium ions. Roughness of images, diameter of the network holes, and the width of chains or rods were measured to support the shape features that combined with the data of viscosity, we proposed a modified three-step hypothesis to interpret the SA binding behaviors in “egg-box” model.
Introduction
Sodium alginate (SA), a copolymer of β-d-mannuronic acid(M) and α-l-guluronic acid(G) in varying proportions[Citation1], is isolated from brown algae and bacteria.[Citation2,Citation3] Now it is widely used in the field of food and pharmaceutical research and industries.[Citation4–Citation6] The ability to accumulate divalent metal cations and form gels is the key property for SA to be applied in biological preservative films.[Citation7] To understand the mechanism of binding divalent cations in dilute solution and observe the self-assembly surface have valuable theoretical importance for fresh-keeping films in food storage and preservation.
As the most important metal cations in the chelating reaction with SA, calcium ions were chosen to add into the self-assembly solution of SA. Meanwhile, the “egg-box” model was used to describe the formation process of alginate gels in the presence of calcium ions as the most acceptable theory. It indicates that the G blocks along alginate chain adopt a 2/1 helical conformation, so forming buckled regions. Calcium ions were coordinated within the cavities created by a pair of the buckled G sequences, forming an egg-box dimers.[Citation8] Since it was first proposed by Grant in 1973[Citation9,Citation10], a lot of subsequent studies had been carried out to revise this model. Donati and his colleagues[Citation11] developed a thermodynamic model accounting for ion-induced chain pairing of a negatively charged polyelectrolyte, with particular attention given to the case of calcium-induced chain dimerization in polygalacturonate. The structure of the Ca-alginate junction zones was investigated with X-ray scattering on gels and Ca-alginate gel beads prepared in different methods.[Citation12] They proposed that a slow gelation process such as the diffusion-controlled process fits better to a 3/1 helical conformation rather than the egg-box model, while a fast gelation like spinning thin fibers in CaCl2 solution seems close to the 2/1 helical conformation. However, Sikorski and his group[Citation13] regarded pervious results inconsistent with the egg-box model as instrumental error. They indicated that in the Ca2+ form the junction zone involves dimerization of polymer chains through Ca2+ coordination according to the egg-box model. Further lateral interaction between dimers is mediated by disordered Na+ and Ca2+ cations, water molecules, and hydrogen bonding. According to Bracciniet et al.,[Citation14] in the two-stage process in the mechanism of gelation the formation of strongly linked dimer associations is followed by the formation of weak inter-dimer associations mainly governed by electrostatic interactions. Through analyzing the dilute solution using isothermal titration calorimetry, Ca2+-selective potentiometry, and viscometry techniques, Fang and his colleagues[Citation8] revealed three distinct and successive steps in the binding of calcium ions to alginate with the increased concentration of calcium chloride.
The process of “egg-box” model still has details needed to be discussed, and the atomic force microscopy (AFM) is a new and efficient tool to observe the self-assembly of alginate in the presence of calcium ions directly and provide evidence for the binding behaviors in the model.[Citation15] The results will help clarify the effects of alginate concentration and CaCl2 on self-assembly exactly by analyzing the change of width and roughness, and will be beneficial in directing the application of SA in food and industry.
Materials and methods
Self-assembly of SA in different concentrations
The stock solution of SA in 0.20 mg/ml was prepared by dissolving SA powder (Sinopharm Chemical Reagent Co., Shanghai, China) in distilled water. And the original solution was diluted to experimental solutions in six different concentrations varying from 0.001, 0.005, 0.02, 0.05, and 0.08–0.10 mg/ml. Then, 10 μl of each of the six kinds diluted SA solutions were deposited onto the fresh cleaved mica sheets (TOSAI Co., Japan) successively. The prepared mica sheets were put into the dustproof multi-well plates and dried in the air at ambient temperature till further study for AFM imaging and analysis.
Self-assembly of SA in different CaCl2 concentrations
Distilled water was used to formulate CaCl2 solutions at concentration from 0.2 to 20 mmol/l. Stock SA solution were diluted with equal volume CaCl2 solutions in different concentrations. The SA solution was mixed with distilled water in the control group. In mixed solutions, the final concentrations of SA solution were 0.02, 0.05, and 0.10 mg/ml separately, and the CaCl2 concentrations were adjusted from 0.1 to 10 mmol/l which is shown in in detail. Then the AFM samples were prepared and observe in the same way as described earlier.
Figure 1. Typical AFM height images of SA self-assembly in six different concentrations at 512 × 512 pixels. Scale bar: 500 nm. Concentration of SA solutions: (a) 0.001 mg/ml; (b) 0.005 mg/ml; (c) 0.02 mg/ml; (d) 0.05 mg/ml; (e) 0.08 mg/ml; (f) 0.10 mg/ml.
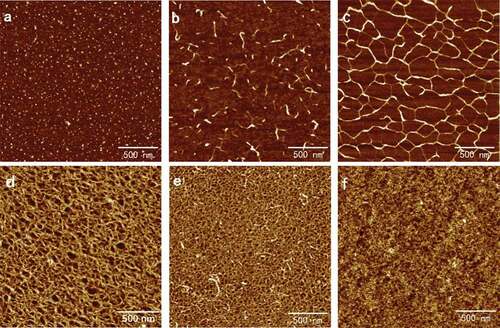
Figure 2. Root mean square roughness (Rq) of the self-assembly images of SA collected in different concentration.
Figure 3. Typical AFM height images of 0.02 mg/ml SA self-assembly in CaCl2 solutions with different ions concentration in 512 × 512 pixels. Scale bar: 500 nm. Concentration of CaCl2 solutions: (a) 0.1 mmol/l; (b) 1 mmol/l; (c) 2 mmol/l; (d) 3 mmol/l; (e) 5 mmol/l; and (f) 10 mmol/l.
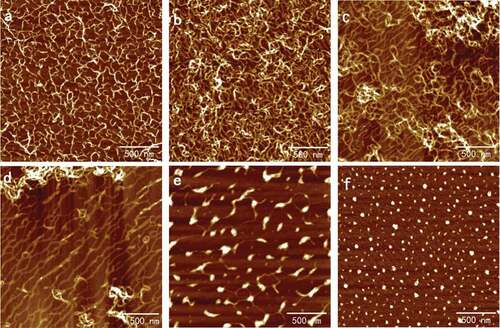
Figure 4. Typical AFM height images of 0.10 mg/ml SA self-assembly in presence of CaCl2 solutions with different concentration in 512 × 512 pixels. Scale bar: 500 nm. Concentration of CaCl2 solutions: (a) 0.1 mmol/l; (b) 1 mmol/l; (c) 2 mmol/l; (d) 3 mmol/l; (e) 5 mmol/l; and (f) 10 mmol/l.
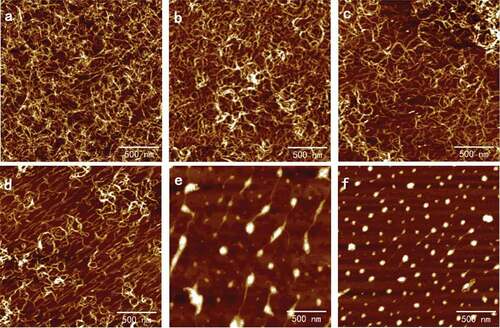
Figure 5. The diameter and density of the network holes and particles of SA self-assembly interacted with calcium chloride in different concentrations. (a) The diameter of the holes; (b) the density of the holes; (c) the diameter of the particles; and (d) the density of the particles.
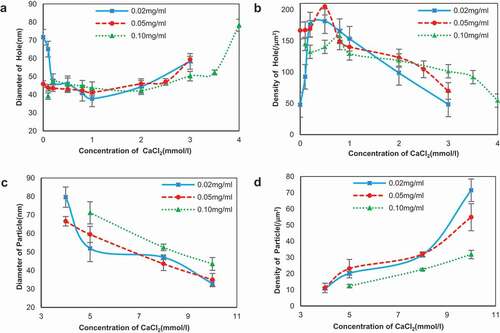
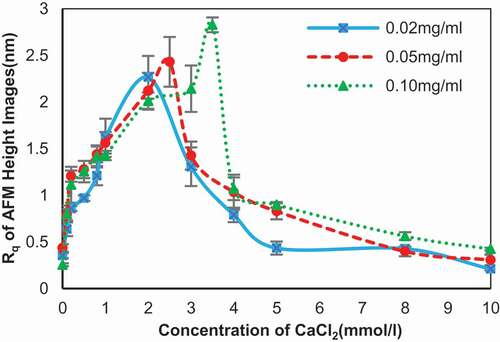
Figure 6. Root mean square roughness (Rq) of the self-assembly images of SA changed along with different concentration of calcium chloride. Concentration of SA: 0.02 mg/ml (blue line), 0.05 mg/ml (red line), and 0.10 mg/ml (green line).
Viscosity measurements of SA in different CaCl2 concentrations
Solutions of SA in different CaCl2 concentrations as mentioned above were prepared at room temperature.[Citation16] Viscosity measurements were carried out with NDJ-79A digital rotary viscometer (ChangJi Geological Instrument Co., Shanghai, China). Third module model and 0.1 type rotor was set according to the predicted viscosity. The special cylinder filled with solution under test rotated in 750 rpm, and the readings whose units were mPa∙s represented absolute viscosity. The preparation and viscosity test of solution in every concentration were repeated three times and at least five data were recorded when they were steady every time.
AFM imaging and data analysis
All imaging tests were executed on Multimode-8 AFM (Veeco Co., Santa Barbara, CA, USA) with SCANASYST-AIR probes (Bruker Co., Santa Barbara, CA, USA) in ScanAsyst mode at 0.997 Hz. Height images in 512 × 512 pixels were collected simultaneously. The bright and dark areas in the AFM images corresponded to high and low parts in the observed samples.[Citation17] First-order flatten were executed on the height images before further analysis using AFM offline software NanoScopeAnalysis V1.10 (Bruker Co., Santa Barbara, CA, USA). The width and height of a single chain were determined by measuring the horizontal distance and vertical distance through section analysis, respectively. Data of root mean square roughness () for the entire image obtained by roughness calculation was used to represent the frequency profile of alginate self-assembly surface. The size and density of polymer particles and network holes both were obtained by particle analysis. Five AFM height images for each sample at least were captured randomly, and 60 different chains in the images were selected to collect the related data for statistical analysis. All statistical analyses were performed using IBM SPSS Statistics 22 (IBM, New York, USA).
Results and discussion
The effect of the concentration on the self-assembly of SA
The present contribution aimed at revisiting the mechanism of the “egg-box” model. Specifically, the self-assembly surface morphology was the main target of the present work. The typical AFM height images of SA self-assembly were shown in . The surface morphology of self-assembly of SA changed significantly with the varying of the concentration of SA from 0.001 to 0.10 mg/ml. Concentration of 0.001 mg/ml was too low for SA to link with each other, so the polymer existed as independent dots with an average diameter of 16.20 ± 0.37 nm, as shown in . For SA at 0.005 mg/ml, the dispersive fibers that were like soft threads could be observed directly in ; however, they were only single, short, and sparse fibers with the average width of 16.62 ± 3.07 nm. The similar diameters illustrated that the chains observed in 0.005 mg/ml were formed by linking of dots in 0.001 mg/ml because of increasing concentration. The morphology was consistent with the common form of random coil structures and discrete circular structures for high flexible polysaccharides, such as SA, after drying on mica in nature state.[Citation17,Citation18]
When the concentration of SA increased to 0.02 mg/ml, an unbroken, well-proportioned network configuration is shown in , and the average diameter of the polygonous holes was about 71.66 ± 6.99 nm. With the increasing of the concentration, the diameter of the network holes got smaller and almost disappeared. The elliptic holes in 0.05 mg/ml SA had an average diameter of 45.82 ± 6.34 nm in , while there were rounded holes with average diameter of 33.12 ± 0.82 nm in 0.08 mg/ml SA (shown in ). Sodium alginate in 0.10 mg/ml would form a layered structure, in which the holes had almost disappeared because the concentration was high enough, as shown in . Indeed, concentration of SA played a remarkable role on the change of the surface configuration of the self-assembly.
The root mean square roughness (Rq) of the whole image derived from the AFM measurement was used to do further analysis and comparison among different samples; the statistic results is shown in . The Rq value showed a point of inflexion on the curve when the concentration of SA equaled to 0.05 mg/ml. Rq value increased before this tipping point was reached and decreased along with the increasing concentration of SA after this turning point. This phenomenon was a consequence of the change of self-assembly surface in varied SA concentration. Before the turning point, the SA molecules had an enhanced tendency to link and form network, in which the Rq value increased gradually from 0.24 to 0.43 nm. When the concentration exceeded the turning point, the holes composed of the fibers diminished progressively and the Rq value decreased to 0.23 nm at 0.08 mg/ml. Surprisingly, the Rq value of the AFM images in 0.10 mg/ml SA showed a small rise of 0.01 nm compared to 0.08 mg/ml, which indicated that the laminar structure of the self-assembly of SA still had defects and bumps on the surface, as shown in .
The effect of the concentration of calcium ions to the self-assembly of SA
Solutions of SA in 0.02, 0.05, and 0.10 mg/ml that possessed complete network were chosen to study the effects of the calcium ions in different concentrations on the ultrastructure of the self-assembly of SA. The typical AFM height images of the self-assembly of SA treated with CaCl2 are shown in and separately. The results for 0.05 mg/ml resembled 0.02 mg/ml and are not shown repeatedly here. The diameters and densities of alginate particles and the holes enclosed by the chains are shown in . It is seen that in the curing degree of SA chains increased obviously when calcium ions were added initially to 0.02 mg/ml alginate and the diameter of network holes shown in decreased to 65.10 ± 5.69 nm from 71.66 ± 6.99 nm. Only the addition of 0.1 mmol/l CaCl2 could bring out the alginate network with holes diameter 39.25 ± 1.77 nm again for 0.10 mg/ml, in which the concentration was so high that film has formed, as shown in . In this process, dimerization has occurred, which was also proposed by Borgogna and his colleagues[Citation19] that the initial Ca2+-binding mode pointed to an ion-induced chain–chain association even for initial additions of calcium ions. With the increasing of CaCl2 concentration, the chains became polylaminate, curlier, and more aggregative as shown in and separately, which turned the diameters of holes decreased to 37.74 ± 2.28 nm in 0.02 mg/ml and 43.66 ± 3.36 nm in 0.10 mg/ml, respectively.
As shown in and , respectively, after the aggregation of chains the further increasing of CaCl2 would induce the chains to separate and coarsen that largen the hole diameters to 44.40 ± 2.03 nm and 42.26 ± 1.47 nm. The width details are shown in and been discussed below. As shown in and , the chains straightened and extended in the same direction when the concentration of CaCl2 reached 3 mmol/l, and the similar arrangement could be seen in the subsequent images. The phenomenon also occurred in pectin applied by modified molecular combing and fluid fixation techniques on mica after drying.[Citation17,Citation18] We speculated that calcium ions had the same ability of guiding the direction of polysaccharide chains as manipulate that needed verification. At this CaCl2 concentration, the hole diameters had increased to 58.34 ± 5.18 nm and 50.22 ± 2.67 nm for 0.02 and 0.10 mg/ml alginate, respectively. The networks opened and the long chains further coarsen and became short rods linked by thin chains when the concentration of CaCl2 continued increasing and reached 5 mmol/l as shown in and . The diameters of the rods that were approximated as particles were 51.91 ± 7.16 nm and 71.17 ± 6.02 nm as shown in . Finally, only spherical particles with diameters decreased to 32.93 ± 1.75 nm and 43.43 ± 3.48 nm could be observed in the AFM height images for and separately.
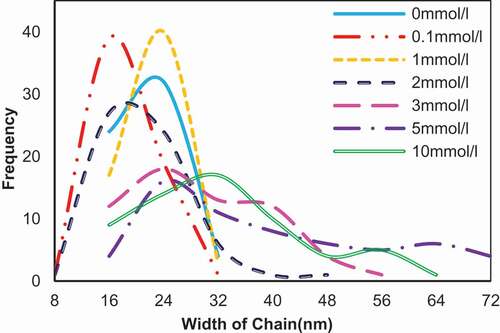
Figure 7. Width of the network chains (n = 60) of the self-assembly of 0.02 mg/ml SA in the presence of CaCl2 in different concentration. The ordinate refers to the diameter count in each interval.
The change trend of diameters and densities confirmed the self-assembly surface mentioned above well and revealed the effect of CaCl2 on the size of network holes. As seen in , the diameter of holes decreased in the beginning of addition of CaCl2 for 0.02 and 0.05 mg/ml SA (the blue and red lines); however, when concentration of CaCl2 exceeded 1 mmol/l, an upturn in the experimental curve appeared with a slow increase upon increasing concentration of CaCl2. The similar tendency was also founded in 0.10 mg/ml SA, where the difference showed a small rise in the beginning of addition of CaCl2 caused by the reappear of the holes. At the same time, the minimum of diameter appeared when concentration of CaCl2 equaled to 2 mmol/l, indicating that the concentration of SA played a role in the change of self-assembly surface. The higher the concentration of SA was, the higher resistance to CaCl2 was. The density of holes in showed a remarkable dependence on concentration of CaCl2 and had a totally opposite trend corresponding to the diameter, which appealed to common sense. Nevertheless, looking in detail to the experiment curve in and 5b, the turn of density of the holes occurred earlier than the diameter that correlated to the coarsening of the chains.
As mentioned above, the alginate chains had been broken into short rods and eventually became point-like structure when the concentration of CaCl2 exceeded 5 mmol/l. Diameter and density of the particles shown in –5d provided the evidence for the change. The data revealed obvious reduction of the diameter and corresponding increase in amounts of SA particles in this step. The simultaneous decrease of particle height (data not shown) illustrated that the size of alginate became smaller. There was no precipitation could be seen in solution even for 10 mmol/l CaCl2 after centrifuge, indicating that the change was not on account of precipitation of calcium alginate. The rarely discussed “zipping” of chains was at variance with the laterally aggregation within individual cluster.[Citation8] We assumed that it was another step and a possible partial collapse of alginate gel network could be used to explain the change.[Citation13,Citation20]
The change of Rq value of 0.02, 0.05, and 0.10 mg/ml of SA in presence of CaCl2 is shown in . The Rq value for 0.02 mg/ml of SA in the presence of CaCl2 exhibited a two-step change process. The Rq value firstly grew larger with the addition of CaCl2 and grew into a maximum of 2.27 ± 0.23 nm. After passing the maximum at 2 mmol/l of CaCl2, the Rq value decreased steadily to 0.21 ± 0.02 nm. The 0.05 and 0.10 mg/ml of SA had a similar tendency, with the maximum point shifted to 2.5 mmol/l (Rq is 2.43 ± 0.27 nm) and 3.5 mmol/l (Rq is 2.83 ± 0.08 nm) of CaCl2, respectively. The Rq decreased to 0.31 ± 0.06 nm and 0.42 ± 0.02 nm for 0.05 and 0.10 mg/ml following reaching the peak separately. The variations of Rq value proved the effect of calcium ions on self-assembly surface along with the data of diameter and density, as shown in .
The modified hypothesis for the “egg-box” model
From what had been discussed above, we might safely draw conclusion that change tendency of the self-assembly of SA in different concentration was similar. Accordingly, the widths of the chains of 0.02 mg/ml SA had only been executed by section analysis for AFM height images, in which the concentration was proper to select single chain.
More than 60 chains in every CaCl2 concentration were measured. Different to average diameters of circular particles in , the widths in 5 and 10 mmol/l CaCl2 referred to the smaller diameters of the rods or spherical particles that were considered as fragments of opened chains. Then the widths were divided on the basis of the smallest diameter, approximate 8 nm, and the numbers in each interval were counted and are shown in , noting that the tiny deviation caused by the method of measurement might exist. Although we had chosen as many chains, the error of manual operation in the section analysis and the artifacts caused by instrument such as “probe broadening” effect or the interaction between tip and the sample could not be excluded for certain.[Citation17,Citation21] The smallest width of chains was 7.84 nm in the presence of 0.1 and 2 mmol/l CaCl2 and near values such as 8.45 and 8.43 nm was found at CaCl2 concentration of 1 and 3 mmol/l, respectively. According to the data that calcium ion separated by a distance of 0.87 nm along the chain axis[Citation13], we speculated that the chains observed in the height images were existence state of polymer consisting of alginate molecules in nature caused by the clustering of molecules.[Citation17,Citation22–Citation24] Despite difficulty in observing single molecule at this resolution under AFM, the behaviors of alginate polymer could be identified through varying widths. The alginate chains in sodium form had widths in the range 8.08–25.52 nm, which was similar to the alginate in 0.1 mmol/l CaCl2 with width of 8.53–25.75 nm. This indicated that SA was not in the single chain form; instead, the chains in SA might be aggregated by noncovalent interactions that partly be from the air-drying operation after deposition on mica.[Citation17,Citation22–Citation24] As what had been suggested by Sikorski and his colleagues[Citation13], the packing of polymer chains in the SA was structurally different from dimers in calcium form. The widths measured in the same chain were not always same, indicating that the amounts of dimers might be different in radial direction of one chain. The random arrangement of blocks in alginate polymer led to unequal dimers aggregating in radial sections, which is demonstrated in . With the increasing of CaCl2 concentration, larger widths appeared. For example, the biggest diameter in 2 mmol/l increased to 40.38 nm. It was assumed that lateral association of available guluronic acid sequences accounted for this change.[Citation25] The alginate chains in the presence of 3, 5, and 10 mmol/l CaCl2 had widths in the range 8.43–49.37 nm, 12.13–71.81 nm, and 10.21–62.76 nm, respectively. Identical to results in , the remarkable increase and following reduction were considered as zipping of chains that would be explained in .
Figure 8. Viscosity of the SA solution in the presence of different concentration of CaCl2.
Concentration of SA: 0.02 mg/ml (blue line), 0.05 mg/ml (red line), and 0.10 mg/ml (green line).
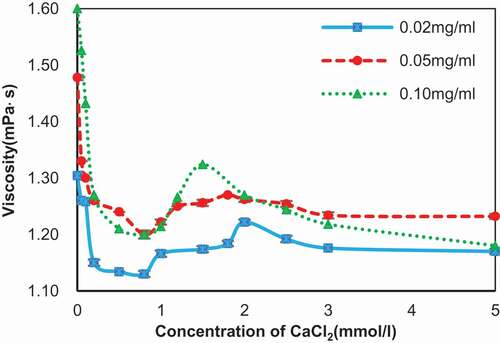
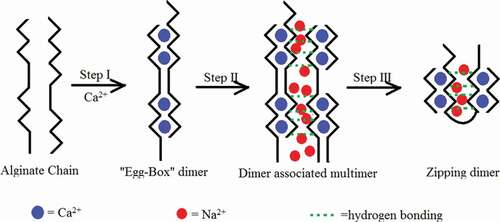
Figure 9. Hypothesized model of three-step binding of calcium ions to alginate molecules.
The black zigzag lines, black smooth lines, dotted green lines, blue dots, and red dots stand for G-blocks in alginate, M-blocks in alginate, hydrogen bond, calcium ions, and sodium ions, respectively.
The viscosity of alginate solutions in the presence of CaCl2 was measured to revisit multiple steps of the binding between SA and calcium ions, which was reported by Fang and his colleagues.[Citation8] The viscosity of alginate solutions in the presence of different concentrations of CaCl2 showed the similar change tendency and three steps could be identified in . In step I, the viscosity decreased with the increasing of CaCl2, suggesting a reduction in the individual size of alginate molecule. Viscosity dropped to 1.13 mPa∙s for 0.02 mg/ml alginate, 1.20 mPa∙s for 0.05 and 0.10 mg/ml alginate in 0.8 mmol/l CaCl2, respectively. The viscosity increased in step II, indicating a growth of chain size during this step. The viscosity peaks reached 1.22 and 1.27 mPa∙s in 2 mmol/l CaCl2 for 0.02 and 0.05 mg/ml alginate, while viscosity began dropping at 1.5 mmol/l CaCl2 where viscosity reached 1.32 mPa∙s. The larger widths of 1 and 2 mmol/l compared to 0.1 mmol/l shown in accorded with the viscosity. And viscosity decreased again in step III, which would indicate that the molecular size decreased during this step. After 5 mmol/l CaCl2, the viscosity continued dropping to 1.16, 1.23, and 1.16 mPa∙s in 0.02, 0.05, and 0.10 mg/ml alginate separately at 10 mmol/l CaCl2, which is not shown in . The molecular size changed in step III was insistent with the morphology in and 3 and the diminishing width of particles in . For different alginate concentrations, the turning point was not identical, affirming the role of SA concentration in the reaction again. Although the change of viscosity was consistent with the work of Fang and his co-workers, the details of chains aggregation in every step shown in the images were at variance with the related theories.
According to the AFM topological images above, we had proposed a different model shown in depicting the binding between alginate and calcium ions, which was not a definite model due to the absence of integrated details, however represented one way to describe the “egg-box” model in alginate and was consistent with the observed results. The alginate chains were actually random curing in nature and were expressed as straight for easily observation.
In step I, the egg-box dimers had formed by gluing together of pairing consecutive G units from two alginate chains through coordination of a Ca2+ cation. The polymer chain adopted a characteristic zigzag shape that had been proposed to create pocket-like cavities in which Ca2+ cations can be easily accommodated. The forming of diameter gave rise to the decrease of molecular size as shown in . The largest number of widths in 0.1 mmol/l was located at smaller width than in sodium form as shown in , and the decreasing of molecular size was speculated to be caused by the “tilted egg-box” proposed by Donati and his colleagues.[Citation11] The alginate chains placed at an angle not far from 90° because of the repulsion between carboxylic groups. The calcium ions were coordinated in the tilted egg-box structures and hence of the slopes of the curves in step I reported in and the decreasing of widths in . During step II, the association of dimers had taken place through non-specific interactions, such as water-mediated hydrogen bonding and disordered Ca2+ and Na+ ions, leading to the increase of molecular size.[Citation13] The significant increasing of widths in 1 mmol/l CaCl2 (step II) compared to 0.1 mmol/l CaCl2 (step I) shown in and viscosity change shown in verified this speculation. In step III, the chains zipped via inter-cluster separation and simultaneously intra-cluster association of egg-box dimers, for instance, the shrinking of alginate particles shown in ,f and ,f, which led to a reduction in molecular size. According to the work by Sikorski and his group[Citation13], coordination of calcium ions reduced the ability for lateral packing. It was assumed that the excessive calcium ions would neutralize the negative ions from free carboxyl group in alginate molecules and break the association between dimers. The hypothesis could explain the alginate self-assembly and matched the viscosity change. However, in the simultaneous chains in different dimensions widths indicated that chains in different steps could exist at the same time and the hypothesis only described the leading behaviors of alginate distinguished by major widths in every stage.
Conclusion
The binding process between alginate polymer and calcium ions is directly confirmed by morphological changes through collecting the AFM height images of the self-assembly of the alginate in the presence of CaCl2. The change of shape could be characterized by the network holes diameter and chains width. Corresponding to the “Egg-box” model, the modified three-step hypothesis here describes the binding stage verified before by various means. In addition, a binding stage not reported before is presented here, and it could be explained with the hypothesis. The results and hypothesis above provide useful information on the control of the self-assembly of SA in food packaging engineering and food preservation.
Additional information
Funding
References
- Smidsrød, O.;. Molecular Basis for Some Physical Properties of Alginates in the Gel State. Faraday Discussions of the Chemical Society 1974, 57, 263–274. DOI: 10.1039/DC9745700263.
- Vold, I. M.; Kristiansen, K. A.; Christensen, B. E. A Study of the Chain Stiffness and Extension of Alginates, in Vitro Epimerized Alginates, and Periodate-Oxidized Alginates Using Size-Exclusion Chromatography Combined with Light Scattering and Viscosity Detectors. Biomacromolecules 2006, 7, 2136–2146. DOI: 10.1021/bm060099n.
- Atkins, E. D. T.; Nieduszynski, I. A.; Mackie, W.; Parker, K. D.; Smolko, E. E. Structural Components of Alginic Acid. I. The Crystalline Structure of poly‐β‐D‐mannuronic Acid. Results of X‐Ray Diffraction and Polarized Infrared Studies. Biopolymers 1973, 12, 1879–1887. DOI: 10.1002/bip.1973.360120814.
- Siew, C. K.; Williams, P. A.; Young, N. W. G. New Insights into the Mechanism of Gelation of Alginate and Pectin: Charge Annihilation and Reversal Mechanism. Biomacromolecules 2005, 6, 963–969. DOI: 10.1021/bm049341l.
- Steinbüchel, A.; Rhee, S. K. Polysaccharides and Polyamides in the Food Industry: Properties, Production, and Patents; AGU Fall Meeting, San Francisco 2005.
- Chen, J. P.; Wang, L.; Wu, S. Characterization of a Ca-Alginate Based Ion-Exchange Resin and Its Application in Lead, Copper, and Zinc Removal. Separation Science & Technology 2001, 36, 3617–3637. DOI: 10.1081/SS-100108352.
- Braccini, I.; Grasso, R. P.; Perez, S. Conformational and Configurational Features of Acidic Polysaccharides and Their Interactions with Calcium Ions: A Molecular Modeling Investigation. Carbohydrate Research 1999, 317, 119–130.
- Fang, Y.; Al-Assaf, S.; Phillips, G. O.; Nishinari, K.; Funami, T.; Williams, P. A.; Li, L. Multiple Steps Andcritical Behaviors of the Binding of Calcium to Alginate. The Journal of Physical Chemistry B 2007, 111, 2456–2462. DOI: 10.1021/jp0689870.
- Grant, G. T.; Morris, E. R.; Rees, D. A.; Smith, P. J. C.; Thom, D. Biological Interactions between Polysaccharides and Divalent Cations: The Egg-Box Model. FEBS Letters 1973, 32, 195–198. DOI: 10.1016/0014-5793(73)80770-7.
- Morris, E. R.; Rees, D. A.; Thom, D.; Boyd, J. Chiroptical and Stoichiometric Evidence of a Specific, Primary Dimerisation Process in Alginate Gelation. Carbohydrate Research 1978, 66, 145–154. DOI: 10.1016/S0008-6215(00)83247-4.
- Donati, I.; Benegas, J. C.; Cesàro, A.; Paoletti, S. Specific Interactions versus Counterion Condensation. 2. Theoretical Treatment within the Counterion Condensation Theory. Biomacromolecules 2006, 7, 1587–1596. DOI: 10.1021/bm050981d.
- Li, L. B.; Fang, Y. P.; Vreeker, R.; Appelqvist, I.; Mendes, E. Reexamining the Egg-Box Model in Calcium-Alginate Gels with X-Ray Diffraction. Biomacromolecules 2007, 8, 464–468. DOI: 10.1021/bm060550a.
- Sikorski, P.; Mo, F.; Skjak-Braek, G.; Stokke, B. T. Evidence for Egg-Box-Compatible Interactions in Calcium-Alginate Gels from Fiber X-Ray Diffraction. Biomacromolecules 2007, 8(7), 2098–2103. DOI: 10.1021/bm0701503.
- Braccini, I.; Perez, S. Molecular Basis of Ca2+-Induced Gelation in Alginates and Pectins: The Egg-Box Model Revisited. Biomacromolecules 2001, 2, 1089–1096.
- Zhu, J.; Sabharwal, T.; Guo, L. H.; Kalyanasundaram, A.; Wang, G. D. Gloss Phenomena and Image Analysis of Atomic Force Microscopy in Molecular and Cell Biology. Scanning 2009, 31, 49–58. DOI: 10.1002/sca.20133.
- Zhong, D.; Huang, X.; Yang, H.; Cheng, R. S. New Insights into Viscosity Abnormality of Sodium Alginate Aqueous Solution. Carbohydrate Polymers 2010, 81, 948–952. DOI: 10.1016/j.carbpol.2010.04.012.
- Yang, H. S.; Chen, F. S.; An, H. J.; Lai, S. J. Comparative Studies on Nanostructures of Three Kinds of Pectins in Two Peach Cultivars Using Atomic Force Microscopy. Postharvest Biology & Technology 2009, 51, 391–398. DOI: 10.1016/j.postharvbio.2008.08.009.
- Yang, H. S.; An, H. J.; Li, Y. F. Manipulate and Stretch Single Pectin Molecules with Modified Molecular Combing and Fluid Fixation Techniques. European Food Research & Technology 2006, 223, 78–82. DOI: 10.1007/s00217-005-0138-3.
- Borgogna, M.; Skjåk-Bræk, G.; Paoletti, S.; Donati, I. On the Initial Binding of Alginate by Calcium Ions. The Tilted Egg-Box Hypothesis. The Journal of Physical Chemistry B 2013, 117, 7277–7282. DOI: 10.1021/jp4030766.
- Donati, I.; Holtan, S.; Morch, Y. A.; Borgogna, M.; Dentini, M.; Skjak-Braek, G. New Hypothesis on the Role of Alternating Sequences in Calcium-Alginate Gels. Biomacromolecules 2005, 6, 1031–1040. DOI: 10.1021/bm049306e.
- McMaster, T. J.; Miles, M. J.; Kasarda, D. D.; Shewry, P. R.; Tatham, A. S. Atomic Force Microscopy of A-Gliadin Fibrils and in Situ Degradation. Journal of Cereal Science 2000, 31, 281–286. DOI: 10.1006/jcrs.2000.0307.
- Fishman, M. L.; Cooke, P.; Hotchkiss, A.; Damert, W. Progressive Dissociation of Pectin. Carbohydrate Research 1993, 248, 303.
- Ikeda, S.; Shishido, Y. Atomic Force Microscopy Studies on Heat-Induced Gelation of Curdlan. Journal of Agricultural & Food Chemistry 2005, 53, 786–791. DOI: 10.1021/jf048797r.
- Fishman, M. L.; Cooke, P.; Levaj, B.; Gillespie, D. T.; Sondey, S. M.; Scorza, R. Pectin Microgels and Their Subunit Structure. Archives of Biochemistry & Biophysics 1992, 294, 253–260. DOI: 10.1016/0003-9861(92)90165-S.
- Yuguchi, Y.; Urakawa, H.; Kajiwara, K.; Draget, K. I.; Stokke, B. T. Small-Angle X-Ray Scattering and Rheological Characterization of Alginate Gels. 2. Time-Resolved Studies on Ionotropic Gels. Journal of Molecular Structure 2000, 554, 21–34. DOI: 10.1016/S0022-2860(00)00556-1.