
ABSTRACT
Sesame oil is a high-value edible vegetable oil, and concern about its authenticity has gained much attention for commercial and consumer health reasons. The present study compares the application of triacylglycerols (TAGs), fatty acids, and volatile organic compounds (VOCs) as markers for discriminating pure sesame oils from those adulterated with corn or soybean oils. The profiles of TAGs, fatty acids, and VOCs in oil samples were established by high-performance liquid chromatography-evaporative light scattering detector, gas chromatography (GC)-flame ionization detector, and GC-time-of-flight mass spectrometer, respectively. Data from six TAGs, seven fatty acids, and six VOCs were employed separately to classify oil samples via principal component analysis (PCA). The PCA results indicate that VOCs show much greater promise than TAGs and fatty acids for detecting corn or soybean oil adulteration (approximately 5% w/w content) of sesame oils.
Introduction
Sesame oil is a high-quality edible vegetable oil that contains high concentrations of nutrients. It is often consumed as a flavor enhancer in many Asian countries, despite its high price. To increase profit, unscrupulous producers may be tempted to blend premium sesame oils with lower-priced vegetable oils. Moreover, these fraudulent practices may also have implications for consumer safety.[Citation1–Citation3] Consequently, the authenticity of sesame oil needs to be ensured to prevent unfair trading practices and problems associated with mislabeling and consumer safety.
In recent years, corn and soybean oils have been used to adulterate sesame oils, due to their chemical similarities; in particular, the profiles of triacylglycerols (TAGs) and fatty acids in corn or soybean oils are similar to those in sesame oils. Analytical techniques for profiling the aforementioned compounds in sesame, corn and/or soybean oils include gas chromatography (GC) coupled with a flame ionization detector (FID)[Citation1,Citation4–Citation6] or mass spectrometer (MS)[Citation7] and high-performance liquid chromatography (HPLC) employing a refractive index detector[Citation8], an evaporative light scattering detector (ELSD)[Citation2,Citation9] or MS.[Citation10–Citation12] Due to the numerous profiles of TAGs and fatty acids present in oil samples, a number of studies have also combined analytical techniques with multivariate analysis to better evaluate and discriminate between pure sesame oils and oil adulterants. Such approaches have included principal component analysis (PCA) and hierarchical clustering analysis.[Citation4,Citation5,Citation7,Citation8] However, to date, such combined techniques have been unable to detect adulteration of sesame oil with soybean and corn oil at low concentrations (<5% and <10% respectively). Alternatively, analysis of volatile organic compounds (VOCs) combined with multivariate analysis have been considered for discrimination of sesame oil based on different processing (roasting) method[Citation13] and the presence of an oil adulterant (soybean oil), where such combined techniques could not detect the presence of soybean oil in sesame oil at concentrations of <10%.[Citation14]
Accordingly, the present study examined and compared the application of TAGs, fatty acids, and VOCs as marker compounds for discriminating pure sesame oils from those adulterated with corn or soybean oils. HPLC-ELSD, GC-FID, and GC-time-of-flight MS (TOF/MS) analyses were combined with PCA to detect sesame oil adulteration using the profiles of TAGs, fatty acids, and VOCs in oil samples, respectively. The results show that VOC marker compounds can be used to identify sesame oils adulterated with 5% (w/w) corn or soybean oil.
Materials and methods
Materials
All reagents and solvents used in this work were of analytical grade. The 37-component fatty acid methyl ester (FAME) mixture (No. 47885-U) and 11-octadecenoic acid (C18:1(n-7), >97.0 purity) were purchased from Sigma (MO, USA). Triacylglycerols (TAGs) were abbreviated according to the fatty acids (L: linoleic acid; O: oleic acid; P: palmitic acid) bound to the glycerol backbone. Individual TAG standards, including LLL, LLO, LLP, OOL, OOO, POL, and POO, were purchased from Sigma. Methanol and 14% boron trifluoride methanol (BF3) solution were purchased from J. T. Baker (NJ, USA) and Sigma, respectively. Sodium hydroxide (NaOH), sodium chloride (NaCl), and 2,2,4-trimethylpentane (isooctane) were purchased from Junsei (Tokyo, Japan). HPLC-grade solvents were purchased from Fisher Scientific (NJ, USA). Commercial manual sampling solid phase microextraction devices and 85 μm carboxen/polydimethylsiloxane (CAR/PDMS) fibers were purchased from Supelco (PA, USA).
A total of 12 different brands of edible oils (six unrefined sesame oils, three refined corn oils, and three refined soybean oils) were purchased from local supermarkets (Seongnam, Korea); they were all pure and qualified products. Each oil sample was sealed and stored in a dark, dry environment prior to analysis. Adulterated sesame oils were prepared at the laboratory, shortly before analysis, by randomly blending sesame and corn or soybean oils without duplicated mixing. The concentrations of corn or soybean oil in adulterated sesame oils were 5, 10, and 20% (w/w). Each analysis was conducted in triplicate.
Analysis of TAGs
The oil samples were analyzed for TAG contents using an Agilent 1200 HPLC (Agilent Technologies, CA, USA) equipped with an ELSD (Alltech, IL, USA). The stationary phase was a Develosil C30 UG-5 column (particle size 5 μm, 4.6 mm i.d. × 250 mm; Nomura Chemical Co., Aichi, Japan). The mobile phase was mixture of acetonitrile (solvent A) and dichloromethane (solvent B) at a flow rate of 1.0 mL/min. The gradient conditions of the mobile phase were as follows; 0–40 min (30–57% B), 40–48 min (57–70% B), 48–54 min (70–30% B), 54–60 min (30–30% B). The temperatures of the drift chamber and column oven were 60 and 25 °C, respectively. The nitrogen gas pressure was 340 kPa and the injection volume was 10 μL.
Analysis of fatty acids
Oil samples (each 20 mg) were first saponified with 2 mL of methanolic NaOH (0.5 M) on a heating block at 100 °C for 10 min, cooled to room temperature, and methylated with 2 mL of the BF3 solution at 100 °C for 10 min. A 2 mL sample of each isooctane and saturated NaCl solution was then added consecutively to the samples and vortexed. The upper isooctane layer containing FAMEs was transferred to a vial for GC analysis.
The FAMEs were analyzed in a GC-2010 with a FID and an AOC-20i autosampler (Shimadzu, Kyoto, Japan) using an HP-FFAP column (30 m × 0.25 mm ID × 0.25 μm film thickness; Agilent Technologies, CA, USA) as a stationary phase. Each sample (1 μL) was injected in split mode with a split ratio of 50:1. The gas flow rates were maintained as follows: carrier gas (helium), 1.50 mL/min; hydrogen, 30 mL/min; and air, 300 mL/min. The injector and detector temperatures were maintained at 230 and 250 °C, respectively. The oven temperature was initially held at 120 °C for 1 min; increased from 120 to 180 °C at a rate of 5 °C/min and held for 7 min; increased from 180 to 205 °C at 5 °C/min and held for 5 min; and from 205 to 230 °C at 5 °C/min and held for 12 min. The FAMEs were identified by comparing their retention times with those of reference standards.
Analysis of VOCs
Oil samples (2 g each) in 20 mL glass vial equipped with a PTFE/silicone septum (Supelco, PA, USA) were heated to 55 °C for 15 min (equilibrium time), extracted using a CAR/PDMS fiber for 15 min, and then thermally desorbed into the injection system of the GC-TOF/MS (LECO Corp., MI, USA). The dimensions of the DB-WAX primary column and DB-1701 secondary column (Agilent J&W, CA, USA) were 60 m × 0.25 mm ID × 0.25 μm film thickness, and 20 m × 0.10 mm ID × 0.40 μm film thickness, respectively. Helium (99.99%) was used as a carrier gas at a constant flow rate of 1.20 mL/min and a split ratio of 20:1. The temperatures of the GC inlet and transfer line were set at 220 °C. The primary oven temperature was maintained at 40 °C for 2 min, then increased to 230 °C at a rate of 20 °C/min, and held for 10 min. The temperature of the secondary oven was always set 10 °C higher than that of the primary oven throughout the analysis. The detector voltage was set to 1600 V, with electron energy of 70 eV. An acquisition delay of 400 s was employed, and the mass spectra were collected within the mass range m/z 33–650, at an acquisition rate of 10 spectra/s. The temperature of the ion source was set at 200 °C.
The raw chromatograms were processed using ChromaTOF® software version 4.22 (LECO Corp., MI, USA) and extracted with a signal-to-noise ratio of 20. The peaks were tentatively identified by comparing the obtained mass spectra with those available in mass spectral databases (Wiley 9 and NIST), with a minimum similarity match of 800. Each peak area was calculated using the unique mass of each detected VOC. All of the peak information from different chromatograms was aligned using the Statistical Compare (SC) option in ChromaTOF® software in order to obtain an accurate comparison between the profiles of VOCs in oil samples. This comparison was necessary for establishing the identity of compounds that could be used as potential markers for discriminating sesame oil from oil adulterants. The results of the SC process were exported in .csv file format and used in multivariate analyses.
Multivariate analyses
The data matrices of TAG, fatty acid, and VOC compositions (Supplementary Tables 1, 2, and 3 respectively) were analyzed by MetaboAnalyst version 4.0 (www.metaboanalyst.ca). These matrices were normalized using auto-scaling (mean-centered and divided by the standard deviation of each variable) and presented as heat maps. The normalized data matrices of each compound were also analyzed by PCA to screen clusters of sampling and variable distributions in different groups of oil samples.
Results and discussion
Compositions of TAGs, fatty acids, and VOCs in oil samples
The TAG, fatty acid, and VOC components from oil samples were profiled using HPLC-ELSD, GC-FID, and GC-TOF/MS, respectively (Supplementary Figs. 1, 2, and 3, respectively). The auto-scaled contents of the selected six TAGs, seven fatty acids, and six VOCs are presented as heat maps in . The variables of all the data were pretreated by an auto-scaling method to make each column of the quantitative matrix data with zero mean and unit variance and to prevent the variables with high content from dominating the clustering model building. The selection of compounds presented in was based on the distinctions and similarities in the content distributions of the compounds among oil samples.
Figure 1. Heat map of triacylglycerol, fatty acid, and volatile organic compound compositions of pure sesame, corn, and soybean oils.
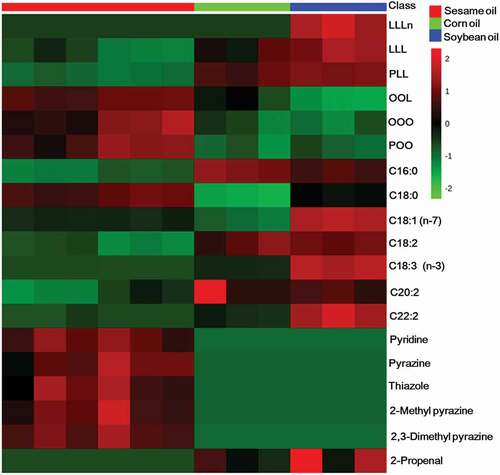
As shown in and Supplementary Table 1, sesame oils showed higher OOL, OOO, and POO contents, whereas corn and soybean oils showed higher LLL and PLL contents. Moreover, LLLn was only detected in soybean oils. These findings support those of previous studies, which reported OOL, OOO, and POO as predominant TAGs in sesame oils; LLL and PLL as predominant TAGs in soybean oils; and that LLLn was not detected in sesame oils.[Citation2,Citation9] All oil samples contained seven common fatty acid components, as shown in and Supplementary Table 2. Sesame oils were found to have higher C18:0 content than those of other oils. Aside from the C18:0 content, corn oils have similar fatty acid profiles to those of sesame oils, but have higher C16:0, C18:2, and C20:2 contents than those in sesame oils. On the other hand, soybean oils contain more fatty acid profiles that differ from those in sesame oils, mainly in terms of C16:0, C18:1(n-7), C18:2, C18:3(n-3), C20:2, and C22:2 contents, which are higher than those in sesame oils. These results confirm the differences and similarities in the fatty acid contents of sesame, corn, and soybean oils reported in previous studies.[Citation5,Citation15] The selected VOCs presented in and supplementary Table 3, including pyridine, pyrazine, thiazole, 2-methyl pyrazine, and 2,3-dimethyl pyrazine, were identified only in sesame oils. Most of the aforementioned VOCs have been reported as specific VOCs found in sesame oils.[Citation14] Dong et al[Citation13] also reported that the major VOCs in roasted black, brown, and white sesame oils were pyrazines, including methylated pyrazines, and the concentrations were found to increase with the increasing roasting temperature. On the contrary, 2-propenal was identified only in corn and soybean oils. It has been reported that 2-propenal can be produced via thermal oxidation of vegetable oils at temperatures above 100 °C.[Citation16] The 2-propenal content found in corn and soybean oils might therefore be due to thermal oxidation during the refining of oils, which employs high temperatures of ≥200 °C. Moreover, Dong et al.[Citation13] showed that 2-propenal was not detected in sesame oil produced from three varieties of sesame seeds (black, brown, and white) that had been processed under roasting conditions of 190–250 °C.
Discrimination of adulterated sesame oil
The distinctions and similarities in the contents of selected compounds of TAGs, fatty acids, or VOCs of the oil samples may allow discrimination and investigation of the similarities between oil samples. However, the relationships between oils are affected by all selected variables/compounds. Therefore, by only analyzing the combined effects of all variables with multivariate methods using chromatographic data, the evaluation and discrimination between pure sesame oils and oil adulterants can be performed more effectively and efficiently. Accordingly, the auto-scaled data matrix of each selected compound was analyzed using PCA.
Three-dimensional score plots of the first three principal components (PCs) for TAGs, fatty acids, and VOCs in oil samples are shown in ), ), and ), respectively. By employing the first three PCs, 85.60, 90.60, and 97.20% of the total variability in the original data were explained for TAGs, fatty acids and VOCs, respectively, indicating that the extracted principal components could represent the majority of information contained in the original data. As shown in , not all of the adulterated sesame oils could be clearly distinguished from pure sesame oils when using TAGs as marker compounds, except for five sesame oil samples adulterated with 20% soybean oil. This might be attributed to the higher contents of LLLn, LLL, and PLL ( and Supplementary Table 1) in soybean oils, enabling the detection of these compounds in most of sesame oils that contain 20% soybean oil () and Supplementary Table 1). Park et al.[Citation2] and Lee et al.[Citation9] suggested that soybean oil adulteration in sesame oil could be evaluated using LLLn which is a unique TAG species from soybean oil and the LLL/OOO ratio, taking advantage of the higher LLL content in soybean oil and higher OOO content in sesame oil.
Figure 2. Three-dimensional score plots of PCA (a) and heat map (b) of triacylglycerol compositions in pure and adulterated sesame oils. SSO, sesame oil; CO, corn oil; SBO, soybean oil.
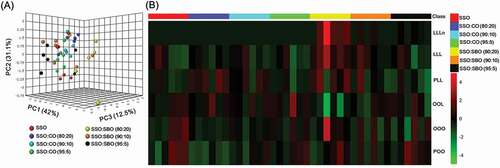
Figure 3. Three-dimensional score plots of PCA (a) and heat map (b) of fatty acid compositions of pure and adulterated sesame oils. SSO, sesame oil; CO, corn oil; SBO, soybean oil.
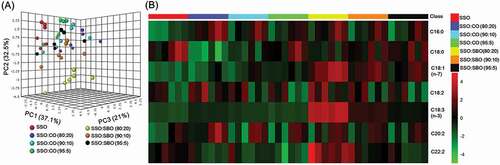
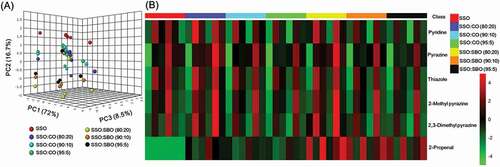
Figure 4. Three-dimensional score plots of PCA (a) and heat map (b) of volatile organic compound compositions of pure and adulterated sesame oils. SSO, sesame oil; CO, corn oil; SBO, soybean oil.
Better results in discriminating pure sesame oil from adulterated sesame oil were obtained when using fatty acids as marker compounds, in which sesame oils adulterated with 20% and 10% corn and soybean oils, respectively, can be distinguished from pure sesame oils ()). Higher contents of C18:1(n-7) and C18:3(n-3) in soybean oils and C16:0 in corn oils ( and ) and Supplementary Table 2) are likely to improve discrimination between pure and adulterated sesame oils. Zhang et al.[Citation7] and Peng et al.[Citation5] employed fatty acid compositions (28 and 10 identified fatty acids, respectively) combined with multivariate analysis to detect sesame oil adulteration with soybean oil, achieving detection limits for authentication of as low as 10 and 5%, respectively. Although the detection of soybean oil adulteration in sesame oil can be noticed at a concentration of as low as 5%, the detection level for evaluating the presence of corn oil in pure sesame oil remains high. Currently, it is possible to detect the presence of refined corn oils at around ≥15% in pure sesame oils by using combined analysis of stable isotope ratio, 1H NMR spectroscopy, and fatty acid profiles.[Citation1] This limitation arises mainly from the fact that sesame and corm oils have similar TAG and fatty acid profiles.
VOCs, in this study, show greater promise as marker compounds as compared to TAGs and fatty acids, enabling clear discrimination between pure and adulterated sesame oil samples that contains corn or soybean oil (down to approximately 5% w/w content) (). It seems that the higher the content of non-sesame oil, the further distance of this sample from the pure sesame oils. Moreover, the higher content of 2-propenal found only in corn and soybean oils was highly likely to improve the discrimination between pure and adulterated sesame oils ( and ) and Supplementary Table 3). This technique enhanced the previous technique introduced by Zhao et al.[Citation14], which employs particular VOCs found only in sesame oil and common VOCs found in both sesame and soybean oils. The technique developed by Zhao et al.[Citation14] can detect the presence of soybean oil in pure sesame oil at a concentration of as low as 10%. Moreover, this finding confirms the improvement of the adulteration detection levels achieved in previous studies, particularly those using corn oil as oil adulterant.
Conclusion
PCA of TAG, fatty acid, and VOC contents enabled discrimination between pure sesame oil and that adulterated with corn or soybean oil. Fatty acids showed better results in discriminating pure sesame oil from adulterated sesame oil than TAGs, enabling the detection of corn (>20%) or soybean oil (>10%) in pure sesame oil. As compared to fatty acids and TAGs, VOCs showed much greater promise as marker compounds, clearly discriminating between pure sesame oils and those adulterated with 5% corn or soybean oil. Further analyses employing different types of sesame oils such as those produced using unroasted sesame seeds and/or by refining processes, need to be conducted to validate the reliability of the method developed in the present study.
Supplemental Material
Download ()Supplementary Material
Supplemental data for this article can be accessed here.
Additional information
Funding
References
- Kim, J.; Jin, G.; Lee, Y.; Chun, H. S.; Ahn, S.; Kim, B. H. Combined Analysis of Stable Isotope, 1H NMR, and Fatty Acid to Verify Sesame Oil Authenticity. J. Agric. Food Chem. 2015, 63(40), 8955–8965. DOI: 10.1021/acs.jafc.5b04082.
- Park, Y. W.; Chang, P. S.; Lee, J. Application of Triacylglycerol and Fatty Acid Analyses to Discriminate Blended Sesame Oil with Soybean Oil. Food Chem. 2010, 123(2), 377–383. DOI: 10.1016/j.foodchem.2010.04.049.
- Wu, W. H.;. The Contents of Lignans in Commercial Sesame Oils of Taiwan and Their Changes during Heating. Food Chem. 2007, 104(1), 341–344. DOI: 10.1016/j.foodchem.2006.11.055.
- Lee, D. S.; Noh, B. S.; Bae, S. Y.; Kim, K. Characterization of Fatty Acids Composition in Vegetable Oils by Gas Chromatography and Chemometrics. Anal. Chim. Acta. 1998, 358(2), 163–175. DOI: 10.1016/S0003-2670(97)00574-6.
- Peng, D.; Bi, Y.; Ren, X.; Yang, G.; Sun, S.; Wang, X., Detection and Quantification of Adulteration of Sesame Oils with Vegetable Oils Using Gas Chromatography and Multivariate Data Analysis. Food Chem. 2015, 188, 415–421. DOI: 10.1016/j.foodchem.2015.05.001.
- Seo, H. Y.; Ha, J.; Shin, D. B.; Shim, S. L.; No, K. M.; Kim, K. S.; Lee, K. B.; Han, S. B. Detection of Corn Oil in Adulterated Sesame Oil by Chromatography and Carbon Isotope Analysis. J. Am. Oil Chemists’ Soc. 2010, 87(6), 621–626. DOI: 10.1007/s11746-010-1545-6.
- Zhang, L.; Li, P.; Sun, X.; Wang, X.; Xu, B.; Wang, X.; Ma, F.; Zhang, Q.; Ding, X. Classification and Adulteration Detection of Vegetable Oils Based on Fatty Acid Profiles. J. Agric. Food Chem. 2014, 62(34), 8745–8751. DOI: 10.1021/jf501097c.
- Lee, D. S.; Lee, E. S.; Kim, H. J.; Kim, S. O.; Kim, K. Reversed Phase Liquid Chromatographic Determination of Triacylglycerol Composition in Sesame Oils and the Chemometric Detection of Adulteration. Anal. Chim. Acta. 2001, 429(2), 321–330. DOI: 10.1016/S0003-2670(00)01289-7.
- Lee, W. J.; Su, N. W.; Lee, M. H.; Lin, J. T. Assessment of Authenticity of Sesame Oil by Modified Villavecchia Test and HPLC-ELSD Analysis of Triacylglycerol Profile. Food Res. Int. 2013, 53(1), 195–202. DOI: 10.1016/j.foodres.2013.04.008.
- Wei, F.; Ji, S. X.; Hu, N.; Lv, X.; Dong, X. Y.; Feng, Y. Q.; Chen, H., Online Profiling of Triacylglycerols in Plant Oils by Two-Dimensional Liquid Chromatography Using a Single Column Coupled with Atmospheric Pressure Chemical Ionization Mass Spectrometry. J. Chromatogr. 2013, 1312, 69–79. DOI: 10.1016/j.chroma.2013.09.005.
- Hu, N.; Wei, F.; Lv, X.; Wu, L.; Dong, X. Y.; Chen, H., Profiling of Tricylglycerols in Plant Oils by High-Performance Liquid Chromatography–Atmosphere Pressure Chemical Ionization Mass Spectrometry Using a Novel Mixed-Mode Column. J. Chromatogr. B. 2014, 972, 65–72. DOI: 10.1016/j.jchromb.2014.09.039.
- Wei, F.; Hu, N.; Lv, X.; Dong, X. Y.; Chen, H., Quantitation of Triacylglycerols in Edible Oils by Off-Line Comprehensive Two-Dimensional Liquid Chromatography–Atmospheric Pressure Chemical Ionization Mass Spectrometry Using a Single Column. J. Chromatogr. 2015, 1404, 60–71. DOI: 10.1016/j.chroma.2015.05.058.
- Dong, X. Y.; Li, P. P.; Wei, F.; Jiang, M.; Zhao, Y. Z.; Li, G. M.; Chen, H.; Zhao, Y. D. The Impact of Processing on the Profile of Volatile Compounds in Sesame Oil. Eur. J. Lipid Sci. Technol. 2012, 114(3), 277–286. DOI: 10.1002/ejlt.201100059.
- Zhao, F.; Liu, J.; Wang, X.; Li, P.; Zhang, W.; Zhang, Q. Detection of Adulteration of Sesame and Peanut Oils via Volatiles by GC × GC–TOF/MS Coupled with Principal Components Analysis and Cluster Analysis. Eur. J. Lipid Sci. Technol. 2013, 115(3), 337–347. DOI: 10.1002/ejlt.201200133.
- Ai, F. F.; Bin, J.; Zhang, Z. M.; Huang, J. H.; Wang, J. B.; Liang, Y. Z.; Yu, L.; Yang, Z. Y., Application of Random Forests to Select Premium Quality Vegetable Oils by Their Fatty Acid Composition. Food Chem. 2014, 143, 472–478. DOI: 10.1016/j.foodchem.2013.08.013.
- Ewert, A.; Granvogl, M.; Schieberle, P. Isotope-Labeling Studies on the Formation Pathway of Acrolein during Heat Processing of Oils. J. Agric. Food Chem. 2014, 62(33), 8524–8529. DOI: 10.1021/jf501527u.