
 ?Mathematical formulae have been encoded as MathML and are displayed in this HTML version using MathJax in order to improve their display. Uncheck the box to turn MathJax off. This feature requires Javascript. Click on a formula to zoom.
ABSTRACT
Low glycemic index (GI) rice flour was prepared through enzymatic hydrolysis. Slowly digestible and resistant starch contents increased significantly (p ≤ 0.05) by 195.82% and 204.03%, respectively, while as total, rapidly digestible and digestible starch contents decreased significantly (p ≤ 0.05) by 55.40%, 51.67%, and 18.74%, respectively, after enzymatic hydrolysis. Glycemic load of low GI rice flour was significantly (p ≤ 0.05) lower than untreated rice flour. The degradation temperature of low GI rice flour (~275°C) was lower compared to untreated rice flour (~298°C). Particle size distribution analysis indicated that both surface mean- D [3, 2] and volume mean diameter – D[4, 3] of low GI rice flour were higher than untreated rice flour. SEM results revealed numerous cracks in low GI rice flour whereas the surfaces of starch granules of untreated rice flour were smooth without scratches. Low GI rice flour presented A- and V-type polymorphs while as untreated rice flour showed only A-type crystallinity pattern.
Introduction
The recent transition in human lifestyle, decreased physical activity, and consumption of high energy and carbohydrate diet have increased the incidence of obesity and insulin resistance, particularly among Asians.[Citation1] This transition may render Asian populations more susceptible to the adverse effects of high intakes of white rice as rice has been a staple food in Asian populations for many years.[Citation2] Frequent consumption of high GI carbohydrate and high-calorie foods has been implicated with higher risks of heart disease, obesity, cancer, type-2 diabetes, and other chronic diseases.[Citation3] No single solution exists to alleviate the postprandial blood glucose, however, the consumption of low GI foods has been reported as a major mitigation strategy to prevent the upsurge in blood glucose in people suffering from type-2 diabetes.[Citation4] Furthermore, consumers increasingly demand the food products that will confer health benefits in addition to providing the nutritional requirements. This demand stemmed from increasing incidence of debilitating diseases and the alarming number of deaths linked to consumption of some foods, especially those with high-calorie content.
This scenario has challenged the food scientists to come up with innovative food products that would combine the dietary need satisfaction with disease management attributes. The approaches proposed includes the systemic manipulations of high-calorie foods especially carbohydrates to alter their digestibility inside the human digestive system. The manipulations are done to produce components that usually remain undigested in the upper intestinal tract or an intermediate starch that is digested slowly in the small intestine resulting in a sustained slow release of glucose to the bloodstream.[Citation5] The development of rice and rice products, which exhibit lower GI values, should benefit the populations.
Low GI foods have gained considerable interest in the past few years as low GI diets have been shown to improve glycemic control in people with type-2 diabetes.[Citation6] Rice (Oryza sativa L.) being high protein, low sodium, and cholesterol-free diet is currently acquiring popularity in the world. It also serves as a good choice for coeliac patients. Therefore, there is a pressing need to formulate low GI rice-based products. Production of low GI rice flour shall serve as a base for development of such products.[Citation1]
Reducing starch content or altering the starch digestibility are the key factors for the production of low GI rice flour.[Citation7] It is speculated that the digestibility, physicochemical, and several other properties of low GI rice flour may get changed during its preparation through enzymatic hydrolysis. To the best of our knowledge, no studies have focused on the digestibility, physicochemical, thermal, and morphological properties of low GI rice flour prepared through enzymatic hydrolysis. The present study was, therefore, carried out to develop the low GI rice flour through enzymatic hydrolysis and characterize its in-vitro digestibility, physicochemical, morphological, and thermal properties. This work is an extension of our previous work[Citation8] wherein the structural properties of the low GI rice flour were studied.
Materials and methods
Raw material
The paddy (cv. Jehlum) obtained from Mountain Research Center for Field Crops (MRCFC), Khudwani, Anantnag, J&K, India of SKUAST-Kashmir was subjected to milling in modern rice mill (ASR RM 209). The small brokens were ground to a fineness that passed through 200 μm sieve. Sieved rice flour samples were packed in 2000 g low-density polyethylene (LDPE) pouches for further use.
Composition analysis
Moisture (method 925.09), crude protein (method 955.04), crude fat (method 920.39), ash (method 942.05), crude fiber (method 962.09), dietary fiber (method 991.43) and carbohydrate content (determined by subtracting the contents of crude protein, fat, fiber, and ash from 100% dry matter) were measured by AOAC Official Methods (2000).[Citation10] Total and reducing sugars were determined by HPLC method. The gross food energy value was estimated using equation (1);
where CP means crude protein (%), CF means crude fat (%) and CHO means carbohydrate content (%).
In vitro starch digestion properties
Total starch (TS) content was determined following the procedures of Goñi et al..[Citation11] Very rapidly digestible starch (VRDS), rapidly digestible starch (RDS) and slowly digestible starch (SDS) were determined based on an in vitro starch digestibility procedure[Citation12] using the following equations (2), (3), and (4), respectively; G0
where G0 is the content of free glucose contained in the system before digest, G1 is the glucose content released from starch contained in the system after 1 min, G20 is the glucose content released from starch contained in the system after 20 min, and G120 is the glucose content released from starch contained in the system after 120 min and TS is the total starch content of rice flour samples. The factor (0.9) is the glucose to the starch conversion factor.
Resistant starch (RS) content of samples was determined by following the procedures of Goñi et al..[Citation11] Digestible starch (DS) of rice flour samples was determined as the difference between total starch (TS) and resistant starch (RS). Starch hydrolysis rate (SHR) of rice flour samples was determined using Equation (5):
where Gt is the percentage of glucose at any particular time (t). Starch digestibility index (SDI) of rice flour samples was calculated using equation (6) proposed by Rashmi and Urooj.[Citation13]
where RDS is rapidly digestible starch and TS is total starch.
Apparent amylose and amylopectin
Apparent amylose and amylopectin contents of rice flour samples were determined following the method described by Gujaral and Rosell.[Citation14]
Sweetness index (SI) and total sweetness index (TSI)
SI was determined following the procedures described by Magwazaa and Oparab.[Citation15] The SI was calculated based on the content and sweetness properties of individual carbohydrates by multiplying the sweetness coefficient of each sugar (glucose = 1.00, fructose = 2.30 and sucrose = 1.35) with the concentration of that sugar as given below in Equation (7).
In this sweetness estimation approach, the contribution of each carbohydrate is calculated based on the fact that fructose and sucrose are 2.30 and 1.35 times, respectively, sweeter than glucose; hence, the level of sweetness is expressed using the molar concentration of each sugar. The concentration of individual sugars was analyzed using High-Performance Liquid Chromatography (HPLC).
TSI is another index used to indicate the sweetness, where the contribution of each major component of sugar is estimated relative to sucrose, which is assigned an arbitrary value of 1. TSI was calculated according to equation (8) given below[Citation15];
Sugar profile and glycemic load (GL)
Sugar profile (glucose, fructose, sucrose, maltose, and lactose) of rice flour samples was determined by HPLC method. The sample was ground, passed through a 40-mesh sieve and homogenized thoroughly. Appropriately, 10 g of this sample was weighed and transferred into 250 mL disposable plastic cup. One hundred milliliters of distilled water was pipetted in, stirred for 20 min and solids were allowed to settle followed by sonication for 5 min. Ten-milliliter aqueous extract was pipetted into 25 mL volumetric flask and diluted with acetonitrile. It was mixed well, allowed to warm to room temperature and volume was adjusted with acetonitrile. The flask was shaken and using a disposable syringe, 3 mL of the solution added to a glass vial. Standards and samples were run according to the chromatography software.
GL was estimated indirectly by multiplying the amount of available carbohydrate contained in a nominal serving (50 g) of rice flour with glycemic index (GI) value of rice flour, divided by 100 (equation 9). The available carbohydrate per serving was calculated by subtracting dietary fiber from the total carbohydrates of rice flour sample. GI used for calculation of GL was taken from our previous work.[Citation8]
Thermogravimetry
Thermal analysis of the starch samples was performed in a TG-DTA apparatus (DTG model 2010, TA Instruments, New Castle, USA). Change in sample weight against temperature (thermogravimetric analysis, TG) and heat released (exothermic) or absorbed (endothermic) in the sample (differential thermal analysis, DTA) were measured. Samples (4–8 mg) were heated from 30°C to 800°C at a heating rate of 10°C/min. Nitrogen was used as a purge gas at a flow rate of 50 mL/min.
Particle size distribution
Particle size distribution was measured using a particle size analyzer with laser diffraction Helos and Rodos (Sympatec, Clausthal-Zellerfeld, Germany).
Morphological properties-scanning electron microscopy (SEM)
The morphology of rice flour samples was studied using a scanning electron microscope (SEM) (Jeol JSM- 7500, Joel Ltd, Tokyo, Japan). Samples were dried at 50°C overnight and coated with a thin film of gold under vacuum glued onto a sample holder using double-sided cellophane tape and then coated with gold.
Starch granule crystallinity-x-ray diffraction (XRD)
The starch granule crystallinity of untreated and low GI rice flour samples was examined using an X-ray diffractometer (Shimadzu XRD 7000) with Cu Kα value of 1.54060 radiations at a speed of 2°/min, diffraction angle (2θ) at 4° and 50° at 40 kV and 30 mA. The total area under the curve and the area under each prominent peak were determined using OriginPro software package. The moisture content of flour samples was adjusted to 20 ± 0.05% by placing them in a desiccator with oversaturated K2SO4 (25°C, aw = 0.98) for 10 days until the moisture content was constant. The flour samples (20 mg db) were packed tightly in a rectangular aluminum cell (20 × 20 mm, thickness 0.15 cm) and exposed to an X-ray beam with X-ray generator running at 35 KV and 30 mA. The scanning regions of the diffraction angle (2θ) were 3°-37°, which covers all the significant diffraction peaks of starch crystallites. The other operating conditions were: step interval 0.05° and scan rate of 60 s/°min. The percent crystallinity (Xc) was calculated according to equation (10);
where Ac is the crystalline area and Aa is the amorphous area on the X-ray diffractogram.
Results and discussions
Composition analysis
presents the physicochemical characteristics of low GI rice flour. As observed from , some striking differences were found in composition, especially in crude protein, crude fiber, crude fat, and carbohydrate contents. Water activity (aw) of both untreated and low GI rice flour was in the range acceptable for better shelf life. However, the water activity (aw) of low GI rice flour (0.09 ± 0.00) was significantly (p ≤ 0.05) lower than that of untreated rice flour (0.66 ± 0.00). Moisture contents of both untreated (10.36 ± 0.06%) and low GI (8.94 ± 0.07%) rice flour samples were in the range generally acceptable for long-term storage with better shelf-life. Crude protein of low GI rice (6.41 ± 0.01%) flour was three times higher than that of untreated rice flour (22.31 ± 0.02%). Chen and Chang[Citation9] have also reported similar findings for high-protein, low GI rice flour. Further, crude fat of low GI rice flour (6.90± 0.03%) was also significantly (p ≤ 0.05) higher than that of untreated rice flour (0.56 ± 0.20%). Similar findings have been reported by Chen and Chang[Citation9] for high-protein rice flour obtained from broken rice through enzymatic hydrolysis method. Cereal starches contain integral lipids in the form of lysophospholipids (LPL) and free fatty acids (FFA) which are positively correlated with the amylose fraction and lysophospholipids (LPL) and account for ~2% of starch weight.[Citation16] Granules may also be contaminated with surface lipids. The contaminants comprise triglycerides, glycolipids, phospholipids, and free fatty acids derived from the amyloplast membrane and non-starch sources. These differ from integral (internal) lipids, which are composed exclusively of the free fatty acids (FFAs) and lysophospholipids (LPL). Part of the amylose fraction within lipid-containing granules exists as an amylose inclusion complex where the fatty acid chains occupy a hydrophobic core located within the single amylose helix.[Citation16] As the amylose was hydrolyzed enzymatically during the preparation of low GI rice flour, therefore release and subsequently higher fat content in low GI rice flour should not be surprising.
Table 1. Physicochemical and in vitro digestion properties of low glycemic index (GI) rice flour.
The crude fiber of low GI rice flour (2.22 ± 0.03%) was significantly (p ≤ 0.05) higher than that of untreated rice flour (0.73 ± 0.05%). Similarly, dietary fiber (4.30 ± 0.01%) of low GI rice flour was significantly (p ≤ 0.05) higher compared to untreated rice flour (3.61 ± 0.02%). Increase in dietary fiber on enzymatic hydrolysis may be attributed to starch hydrolysis into simple sugars and finally removing those sugars. This ultimately may have resulted in an increase in the components such as cellulose, hemicellulose, lignin, etc., contributing to total dietary fiber.
Ash content of low GI rice flour samples was found to be higher than untreated rice flour samples; however, the difference was not significant (p ≤ 0.05). This increase in ash content may be ascribed to the effect of pH adjustment of slurry[Citation9] and the release of inorganic components of rice flour which were trapped with starch on its hydrolysis.[Citation17] Change in carbohydrate composition may be attributed to starch digestion by the added enzymes (Chen and Chang 1984). Carbohydrate content of low GI rice flour (58.53 ± 0.17%) was significantly (p ≤ 0.05) less than that of untreated rice flour (81.11 ± 0.33%). Similar findings have been obtained by Puri et al.[Citation17] wherein they subjected rice starch to hydrolysis by α-amylase and glucoamylase. Also, the higher energy value of low GI rice flour may be due to its higher fat and protein contents.
Total sugars and reducing sugars
Total sugars of low GI rice flour (23.58 ± 0.06%) were significantly (p ≤ 0.05) higher compared to untreated rice flour (0.4 ± 0.05%) (). Untreated rice flour did not contain glucose (reducing sugar); however, low GI rice flour constituted 12.18 ± 0.03% of glucose as reducing sugar. This may be due to the digestion of starch during enzymatic hydrolysis of rice flour.[Citation9]
In vitro digestion properties
Data from indicated significant (p ≤ 0.05) increase in SDS and RS in low GI rice flour and significant (p ≤ 0.05) decrease in TS, VRDS, RDS, and DS in low GI rice flour. SDS and RS increased by almost 195.82% and 204.03%, respectively; however, TS, VRDS, RDS, and DS decreased by almost 55.40%, 55.86%, 51.67% and 18.74%, respectively. TS was significantly (p ≤ 0.05) lower in low GI rice flour (36.63 ± 0.15%) compared to untreated rice flour (82.14 ± 0.61%). Both VRDS as well as RDS decreased significantly (p ≤ 0.05) in low GI rice flour; however, SDS and RS increased significantly (p ≤ 0.05). Similar findings have been reported by Lee et al.[Citation18] RS content was found to increase from 8.42 ± 0.17% in untreated rice flour to 25.6 ± 1.55% in low GI rice flour. According to Robertson et al.[Citation19], the diet with high RS could notably reduce postprandial blood glucose and insulin reaction, and improve insulin sensitivity, which is deemed beneficial in delaying the postprandial rise in blood glucose of type-2 diabetic patients and in the management and control of their condition. SDS decreases with increase in apparent amylose[Citation20] whereas RDS increases with increase in apparent amylose.[Citation21] Correlating it to the present study, amylose content of low GI rice flour was lower than the untreated rice flour. Therefore, low GI rice flour had higher SDS; higher RS and lower RDS contents (). RS was inversely proportional to the amount of starch digested and directly proportional to protein and dietary fiber contents.
SHR of untreated rice flour decreased by almost 41.86% in low GI rice flour. The high hydrolysis rate of untreated rice flour agrees with the high value of RDS fraction in detriment of the SDS fraction. SDI, a measure of the relative rate of starch digestion, was 94.88 ± 0.91% and 102.85 ± 0.41%, respectively, for untreated and low GI rice flour samples implying significant (p ≤ 0.05) difference between the two. Significantly (p ≤ 0.05) lower value of SDI was found in untreated rice flour despite its higher TS content in comparison to low GI rice flour. The higher SDS fraction and high protein of low GI rice flour explain the observation of low SDI. This confirms the relevance of starch fractions in food rather than TS.[Citation22] The findings also support the well-known literature reports that fat, protein, and RS content in food decreases glycemic response (GR).[Citation23] These contents of food (fats, protein, and RS) tend to retard starch degradation and delay the rate of gastric emptying in the small intestine which consequently leads to lower GR and GI value of food.[Citation22]
As observed from , amylose content decreased from 17.11 ± 0.02% in untreated rice flour to 7.45 ± 0.15% in low GI rice flour representing almost 56.45% decrease in amylose content. The gelatinized starches with low amylose content are difficult to hydrolyze by amylases than those with a high amount of amylose and higher degrees of crystallinity.[Citation24] Corroborating it to the present study, low GI rice flour with less amount of apparent amylose and higher percent degree of crystallinity () was difficult to hydrolyze as compared to the untreated rice flour. Rocha et al.[Citation25] have also reported the decrease in amylose contents in cassava, sweet potato, and Peruvian carrot on enzymatic hydrolysis. The decrease in amylose content of low GI rice flour may be attributed to the enzymatic hydrolysis of amylose.[Citation25] The increase in amylopectin was, however, expected which increased by almost 11.66% from 82.88 ± 0.012% in untreated rice flour to 92.55 ± 0.15% in low GI rice flour.
Table 2. Apparent amylose, amylopectin, glycemic load, sweetness index, total sweetness index and sugar profile of low glycemic index (GI) rice flour.
Figure 1. Thermal decomposition behavior of low glycemic index (GI) rice flour (A): Thermal gravimetric analysis (TGA) of untreated and low glycemic index (GI) rice flour (B): Differential thermal gravimetric (DTG) of untreated and low glycemic index (GI) rice flour.
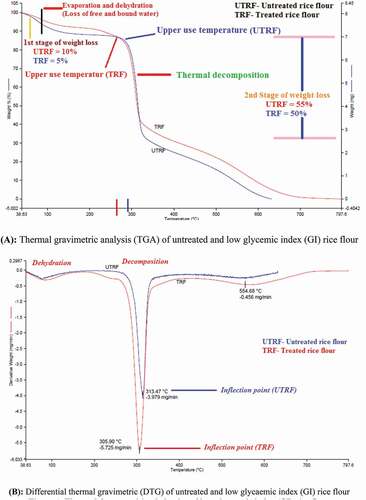
Figure 2. Particle size distribution of untreated and low glycemic index (GI) rice flour.
D[2,3] = surface area mean (Sauter Mean Diameter)D[3,4] = volume moment mean (De Brouckere Mean Diamater) – particles constituting the bulk of the sample volumeDv (90) = the diameter where 90% of the population lies below this value and 10% above thisDv (50) = the diameter where 50% of the population lies below this value and 50% above thisDv (10) = the diameter where 10% of the population lies below this value and 90% above this.
![Figure 2. Particle size distribution of untreated and low glycemic index (GI) rice flour.D[2,3] = surface area mean (Sauter Mean Diameter)D[3,4] = volume moment mean (De Brouckere Mean Diamater) – particles constituting the bulk of the sample volumeDv (90) = the diameter where 90% of the population lies below this value and 10% above thisDv (50) = the diameter where 50% of the population lies below this value and 50% above thisDv (10) = the diameter where 10% of the population lies below this value and 90% above this.](/cms/asset/05a5d9dd-43cf-4e43-9bf3-59ba562f1b60/ljfp_a_1545789_f0002_oc.jpg)
Figure 3. Scanning electron micrographs of low glycemic index rice flour.
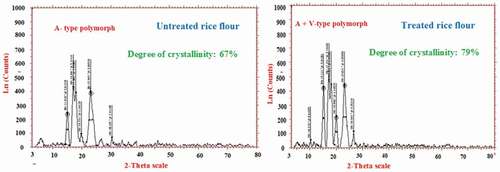
Figure 4. X-ray diffractrometry of low glycemic index rice flour showing ln(counts) at each Bragg’s angle (2θ).
Glycemic load (GL)
GL of low GI rice flour (20.03 ± 0.2) was significantly (p ≤ 0.05) lower than that of untreated rice flour (67.5 ± 0.2) (). Diets with high GL have been hypothesized to increase the risks of certain cancers by increasing blood glucose or insulin concentrations.[Citation20] Therefore, the decrease in GL is desirable. The lower GL of low GI rice flour may be attributed to its lower GI and available carbohydrate content.
Sweetness index (SI), total sweetness index (TSI) and sugar profile
indicates that SI and TSI were not detected in untreated rice flour, however, in low GI rice flour, SI and TSI were recorded as 12.78 ± 0.03% and 9.25 ± 0.02, respectively. Increase in SI in low GI rice flour may be ascribed to increase in the free sugars. The presence of these free sugars in low GI rice flour may be ascribed to starch hydrolysis and the release of sugars from starch complexes thereafter. also presents the sugar profile of untreated and low GI rice flour. Glucose, fructose, sucrose, maltose, and lactose were not detected at all in untreated rice flour, whereas in low GI rice flour, glucose, maltose, and lactose were recorded as 12.78 ± 0.03%, 1.32 ± 0.00% and 0.4 ± 0.00%, respectively. However, fructose and sucrose remained undetected in low GI rice flour as well.
Thermal decomposition
TGA and DTG (derivative of TGA curves) were carried out to observe the thermal decomposition behavior of untreated and low GI rice flour. shows the thermal decomposition behavior of untreated and low GI rice flour studied by TGA under nitrogen. Generally, dehydration and decomposition are the two separate processes which could be observed clearly during the thermal degradation of starch in an inert condition such as nitrogen.[Citation21] Here in our results, two stages of weight loss can be seen in both untreated and low GI rice flour (). The first step of weight loss was observed from 38°C to 125°C which is attributed to the evaporation of free moisture. The second stage of weight loss was from 250°C to 325°C with the mass decreasing dramatically.
Untreated rice flour had higher initial weight loss than low GI rice flour with values around 10% in the temperature range of 38–125°C. However, low GI rice flour showed losses of only 5% by weight in the same temperature range (38–125°C). By increasing the temperature from 250°C to 325°C, there is a steep fall in weight with untreated rice flour losing around 55% of weight in contrast to low GI rice flour losing only 50% of weight. The onset is considered the tangent of the TG curve. The onset temperature depicts the initial hydrolysis of the starch molecule.[Citation26] Low GI rice flour had lower onset temperature than untreated rice flour. Similar findings have been reported by Chen et al..[Citation21]
In the DTG curve, the derivative of the mass loss (dm/dt) is plotted as a function of temperature or time. The curves are the first derivative of the TG data and indicate the temperatures in which the degradation processes start and that where the reaction’s maximum velocity is reached. Correspondingly, two peaks could be observed in DTG curves () – one is attributed to dehydration while another one to decomposition. Some previous studies have reported that dehydration and decomposition have generally been considered as two separate processes associated with the degradation mechanisms of starch.[Citation27] The degradation temperature of low GI rice flour (~275°C) was lower compared to untreated rice flour (298°C) which may be due to the high superficial area of the hydrolyzed starches of low GI rice flour.[Citation27]
The inflection points of untreated and low GI rice flour samples are 313.47°C and 305.90°C, respectively, as can be observed in . It indicates that the greatest rate of change in weight loss for low GI rice flour occurred at the lower temperature in contrast to untreated rice flour in which it occurred at a higher temperature. Thermal decomposition results of the present study thus revealed the influence of enzymatic digestion on the thermal behavior of starches.
Particle size distribution analysis
Particle size distribution of flour, measured as the geometric mean particle diameter, is a critical factor in determining the usefulness and applications of flour in further processing and baking.[Citation28] The quality of the flour depends on a number of factors including particle size. Results of particle size distribution analysis are shown in . As observed from , the surface mean- D[2,3], also known as Sauter mean, of untreated rice flour (72.4 μm) was lower than that of low GI rice flour (82.5 μm). Similarly, the volume mean diameter – D[3,4], also known as DeBroukere mean, of untreated rice flour (180 μm) was lower compared to low GI rice flour (225 μm). Further, Dv (90) for untreated and low GI rice flour was 369 μm and 435 μm, respectively. This would mean that 50% of the particles in untreated and low GI rice flour samples were below 369 μm and 435 μm, respectively, and 50% were above 369 μm and 435 μm, respectively. Dv (50) and Dv (10) of untreated and low GI rice flour were (150 and 204) and (36.7 and 46.6), respectively. Span provides information about the distribution width which was found to be 2.211 and 1.9 for untreated and low GI rice flour, respectively. As the particle sizes of untreated rice flour were finer than that of low GI rice flour, therefore, the baked products developed from such flour may provide better baking results since the fine particle size flour is believed to provide better baking quality.[Citation29]
also shows the particle size distribution pattern of rice flour samples. The graph depicts that the volume density of untreated rice flour was lower compared to low GI rice flour. The curve patterns of rice flour exhibited a large peak ranging from 50 to 900 μm for untreated rice flour and 90–900 μm for low GI rice flour. The increase in particle size is also believed to increase the ash content as has been opined by Sakhare et al.[Citation29] These results are in consonance with our results for ash content as shown in . Smaller particle size flours have lower protein content than bigger size particle flours.[Citation30] As the particle size of low GI rice flour was higher than untreated rice flour, therefore, its higher protein content is justified (). Amylose content is believed to be lower in flour of bigger particle size[Citation30] and therefore, in the present study, lower apparent amylose content of low GI rice flour than untreated rice flour is also supported.
The particle size of rice flour may also affect the enzymatic hydrolysis of starch. According to Tester and Karkalas[Citation31], the larger the particle size, the smaller is the surface to volume ratio and hence the potential surface to be attacked and hydrolyzed by enzymes. Present results indicate the limited hydrolysis of low GI rice flour (supporting the results of our previous study[Citation8]) compared to untreated rice flour, possibly due to bigger particle size. This supports our results showing lower GL of low GI rice flour than untreated rice flour.
Surface morphology-scanning electron microscopy (SEM)
shows the SEM images of untreated and low GI rice flour. The surfaces of starch granules of untreated rice flour are smooth without scratches, while the starch granular surfaces of low GI rice flour were extensively eroded with numerous cracks. It elucidates that the hydrolysis occurred by exocorrosion and was not uniform for all the starch granules indicating that some of the regions were more susceptible to enzymes than others, probably due to the structural characteristics of starch. The porous structure formed during an enzyme attack would be larger and deeper into granules because of more extensive hydrolysis and the presence of pores and pinholes on the surface of starch. The surface pores of hydrolyzed starch are openings to the granule interior, mostly extending to the central cavity. Compound enzymes could directly access a loosely organized region in the center of starch by channels and cavities, which might lead to an alteration in the granule morphology. The starch of low GI rice flour contained more hole-shaped granules than the native starch (untreated rice flour) (). These granules were found more frequently in larger granules. The hole-shaped granules could result from granular swelling followed by collapse. The swelling could have occurred early in the reaction when the starch granules underwent swelling in a concentrated solution of compound enzyme.[Citation32]
Native rice starch granules (untreated rice flour) were irregular in shape with sharp edges and small in size forming compact spherical bundles or clusters, known as compound granules. Digestion was not clearly apparent; the main indication was a less smooth and more rugged granular surface with occasional pitting. Starch granules showed irregular shapes and a wide size range. Limited signs of hydrolysis after enzymatic digestion of low GI rice flour included increased surface roughness and occasional pitting as compared to the smooth surface of native granules of untreated rice flour.
X-ray diffractometry
shows the XRD patterns of untreated and low GI rice flour samples investigated. Untreated rice flour exhibited the typical A-type pattern with prominent peaks at diffraction angles (2θ) of 15°, 17°, 18°, and 23°. The prominent peaks at diffraction angles (2θ) of 15°, 17°, 18°, and 23° are characteristic of A-type crystalline structure.[Citation33] In addition to the peaks corresponding to A-type crystalline structure, low GI rice flour had an additional peak at diffraction angle (2θ) of 20° whilst such a peak was not found in untreated rice flour. The peak at such a diffraction angle belongs to amylose-lipid complexes.[Citation33]
The additional peak obtained at 19° (2θ) in low GI rice flour is also a characteristic of V-type polymorph.[Citation34] Thus, low GI rice flour exhibited both A- and V-type polymorphs (). This transformation of diffraction pattern may be attributed to debranching and retrogradation which reorganized the structure of starch into a helical complex to that of V-amylose.[Citation35] Apart from recrystallization of amylose chains, linear debranched amylopectin chains would also associate to form RS crystalline structure during the period of heating and cooling.[Citation36] From XRD results, it seems that the degree of A-type crystallinity correlated well with the enthalpy of starch gelatinization shown in our previous study[Citation8], the highest enthalpy of starch gelatinization which was found in untreated rice flour corresponded with the highest degree of A-type crystallinity.
The percentage degree of crystallinity of untreated and low GI rice flour is presented in . The diffraction peaks seemed clear in low GI rice flour. As expected, the percentage crystallinity of low GI rice flour (79%) was higher compared to untreated rice flour (67%), which meant that the amylolytic enzymes used for the preparation of low GI rice flour degraded the amorphous parts preferentially. Chen et al.[Citation21] have also reported an increase in the percentage crystallinity of starch after acid hydrolysis.
Conclusion
Low GI rice flour was prepared using enzymatic hydrolysis method. The proximate analysis of low glycemic index rice flour indicates its good nutritional profile compared to untreated rice flour. The study showed a significant difference in in vitro starch digestion profile between untreated and low GI rice flour. SDS and RS of low GI rice flour were significantly (p≤ 0.05) higher compared to untreated rice flour, whereas RDS was significantly (p≤ 0.05) lower in low GI rice flour. Sweetness index, total sweetness index and sugar profile also differed significantly (p≤ 0.05). Low GI rice flour had lower initial weight loss compared to untreated rice flour. The degradation temperature of low GI rice flour (~275°C) was lower compared to untreated rice flour (~298°C). In the temperature range of 38–125°C, the initial weight loss was higher in untreated rice flour (10% by weight) than low GI rice flour (5%) in the same temperature range. The X-ray diffraction patterns showed both A- and V-type crystallinity pattern of low GI rice flour in contrast to untreated rice flour exhibiting the only A-type crystalline pattern. The percentage degree of crystallinity of low GI rice flour was also found to be higher than untreated rice flour. It was, therefore, concluded from the study that the in vitro digestion profile, physicochemical and thermal decomposition properties of low GI rice flour were altered. Digestibility of the starch was reduced suggesting the use of low GI rice flour and products made thereof for diabetic patients.
Acknowledgments
The authors are highly grateful to Sophisticated Test and Instrumentation Center, Cochin University of Science and Technology, Cochin, Kerala, India, and Electron Microscopy and Nanoscience Laboratory, Punjab Agriculture University, Ludhiana India for providing the laboratory facilities as and when required for carrying out analysis. The authors report no conflict of interest.
References
- Srikaeo, K.; Arranz-Martínez, P. Formulating Low Glycaemic Index Rice Flour to Be Used as a Functional Ingredient. J. Cereal Sci. 2015, 61, 33–40. DOI: 10.1016/j.jcs.2014.10.002.
- Hu, E. A.; Pan, A.; Malik, V.; Sun, Q. White Rice Consumption and Risk of Type-2 Diabetes: Meta-Analysis and Systematic Review. BMJ. 2012, 344, e1454. DOI: 10.1136/bmj.e1454.
- Shumoy, H.; Raes, K. In Vitro Starch Hydrolysis and Estimated Glycemic Index of Tef Porridge and Injera. Food Chem. 2017. DOI: 10.1016/j.foodchem.2017.02.060.
- Karl, J. P.; Roberts, S.; Schaefer, E. J.; Gleason, J. A.; Fuss, P.; Ramussen, H.; Das, S. K. Effects of Carbohydrate Quantity and Glycemic Index on Resting Metabolic Rate and Body Composition during Weight Loss. Obesity. 2015, 23(11), 2190–2198. DOI: 10.1002/oby.21268.
- Agama-Acevedo, E.; Islas-Hernández, J. J.; Pacheco-Vargas, G.; Osorio-Díaz, P.; Bello-Pérez, L. A. Starch Digestibility and Glycemic Index of Cookies Partially Substituted with Unripe Banana Flour. LWT-Food Sci Technol. 2012, 46(1), 177–182. DOI: 10.1016/j.lwt.2011.10.010.
- Jenkins, D. J.; Kendall, C. W.; Augustin, L. S.; Mitchell, S.; Sahye-Pudaruth, S.; Mejia, S. B.; Josse, R. G. Effect of Legumes as Part of A Low Glycemic Index Diet on Glycemic Control and Cardiovascular Risk Factors in Type 2 Diabetes Mellitus: A Randomized Controlled Trial. Arch Intern Med. 2012, 172(21), 1653–1660. DOI: 10.1001/2013.jamainternmed.70.
- Eleazu, C. O.;. The Concept of Low Glycemic Index and Glycemic Load Foods as Panacea for Type-2 Diabetes Mellitus; Prospects, Challenges and Solutions. Afr Health Sci. 2016, 16(2), 468–479. DOI: 10.4314/ahs.v16i2.15.
- Amin, T.; Naik, H. R.; Hussain, S. Z.; Rather, A. H.; Murtaza, I.; Dar, B. N. Structural Properties of High-Protein, Low Glycemic Index (GI) Rice Flour. Int J Food Properties. 2016, 20(11), 2793–2804. DOI: 10.1080/10942912.2016.1252391.
- Chen, W. P.; Chang, Y. C. Production of High-Fructose Syrup and High Protein Rice Flour from Broken Rice. J Sci Food Agric. 1984, 35(10), 1128–1135. DOI: 10.1002/jsfa.2740351012.
- AOAC Official Methods. Official Methods of Analysis; Association of Official: Washington, DC, 2000.
- Goñi, I.; Garcia-Alonso, A.; Saura-Calixto, F. A Starch Hydrolysis Procedure to Estimate Glycemic Index. Nutr Res. 1997, 17, 427–437. DOI: 10.1016/S0271-5317(97)00010-9.
- Englyst, H.; Kingman, S.; Cummings, J. Classification and Measurement of Nutritionally Important Starch Fractions. Eur J Clin Nutr. 1992, 46, S33–S50.
- Rashmi, S.; Urooj, A. Effect of Processing on Nutritionally Important Starch Fractions in Rice Varieties. Int J Food Sci Nutr. 2003, 54(1), 27–36. DOI: 10.1080/096374803161976.
- Gujaral, H. S.; Rosell, C. M. Formulations and Quality Characterization of Gluten-Free Egyptian Balady Flat Bread. Ann Agric Sci. 2013, 58(1), 19–25. DOI: 10.1016/j.aoas.2013.01.004.
- Magwazaa, L. S.; Oparab, U. L. Analytical Methods for Determination of Sugars and Sweetness of Horticultural Products- A Review. Sci Hortic. 2015, 184, 179–192. DOI: 10.1016/j.scienta.2015.01.001.
- Tester, R. F.; Karkalas, J.; Qi, X. Starch- Composition, Fine Structure and Architecture. J Cereal Sci. 2004, 39, 151–165. DOI: 10.1016/j.jcs.2003.12.001.
- Puri, S.; Maninder, A.; Sarao, L. K. Optimization of the Use of Fungal Enzymes Amylase and Glucoamylase to Enhance the Nutritional and Functional Properties of Rice Flour. Int J Scientific Eng Res. 2013, 9(4), 738–763.
- Lee, K. Y.; Lee, S.; Lee, H. G. Effect of the Degree of Enzymatic Hydrolysis on the Physico-Chemical Properties and in Vitro Digestibility of Rice Starch. Food Sci Biotechnol. 2007, 19(5), 1333–1340. DOI: 10.1007/s10068-010-0190-z.
- Robertson, M. D.; Bickerton, A. S.; Dermis, A. L.; Vidal, H.; Frayn, K. N. Insulin-Sensitizing Effects of Dietary Resistant Starch and Effects on Skeletal Muscle and Adipose Tissue Metabolism. Am J Clin Nutr. 2005, 82(3), 559–567. DOI: 10.1093/ajcn.82.3.559.
- Choi, Y.; Giovannucci, E.; Lee, J. Glycaemic Index and Glycaemic Load in Relation to Risk of Diabetes-Related Cancers: A Meta-Analysis. Br J Nutr. 2012, 108, 1934–1947. DOI: 10.1017/S0007114512003984.
- Chen, P.; Fengwei, X.; Zhao, L.; Qiao, Q.; Xingxun, L. Effect Of Acid Hydrolysis On The Multi-Scale Structure Change Of Starch With Different Amylose Content. Food Hydrocoll. 2017, 69, 359–368. DOI: 10.1016/j.foodhyd.2017.03.003.
- Odenigbo, A.; Rahimi, J.; Ngadi, M.; Amer, S.; Mustafa, A. Starch Digestibility and Predicted Glycemic Index of Fried Sweet Potato Cultivars. Functional Foods Health Disease. 2012, 2(7), 280–289. DOI: 10.31989/ffhd.v2i7.83.
- Foster-Powell, K.; Holt, S. H.; Brand-Miller, J. C. International Table of Glycemic Index and Glycemic Load Values. Am J Clin Nutr. 2002, 76(1), 5–56. DOI: 10.1093/ajcn/76.1.5.
- Hung, P. V.; Huynh, T. C.; Nguyen, T. L. In Vitro Digestibility and in Vivo Glucose Response of Native and Physically Modified Rice Starches Varying Amylose Contents. Food Chem. 2015. DOI: 10.1016/j.foodchem.2015.02.118.
- Rocha, T. D.; Carneiro, A. P.; Franco, C. M. Effect of Enzymatic Hydrolysis on Some Physicochemical Properties of Root and Tuber Granular Starches. Ciência E Tecnologia De Alimentos. 2010, 30(2), 544–551. DOI: 10.1590/S0101-20612010000200039.
- Matsuguma, L. S.; Lacerda, L. G.; Schnitzler, E.; Filho, M. A.; Franco, C. M.; Demiate, I. M. Characterization of Native and Oxidized Starches of Two Varieties of Peruvian Carrot (Arracacia Xanthorrhiza B.) From Two Production Areas of Paraná State, Brazil. Braz Arch Biol Technol. 2009, 52(3), 701–713. DOI: 10.1590/S1516-89132009000300022.
- Aggarwal, P.; Dollimore, D. A Thermal Analysis Investigation of Partially Hydrolyzed Starch. Thermochim Acta. 1989, 31, 17–25.
- Patwa, A.; Malcolm, B.; Wilson, J.; Ambrose, R. P. Particle Size Analysis of Two Distinct Classes of Wheat Flour by Sieving. Trans ASABE. 2014, 57(1), 151–159.
- Sakhare, S. D.; Inamdar, A. A.; Soumya, C.; Indrani, D.; Rao, G. V. Effect of Flour Particle Size on Microstructural, Rheological and Physico-Sensory Characteristics of Bread and South Indian Parotta. J Food Sci Technol. 2014, 51(12), 4108–4113. http://link.springer.com/article/10.1007/s13197-013-0939-5.
- Hera, E. D.; Gomez, M.; Rosell, C. M. Particle Size Distribution of Rice Flour Affecting the Starch Enzymatic Hydrolysis and Hydration Properties. Carbohydr Polym. 2013, 98, 421–427. DOI: 10.1016/j.carbpol.2013.06.002.
- Tester, R. F.; Karkalas, J. Hydrolysis of Native Starches with Amylases. Anim Feed Scienec Technol. 2006, 130, 39–54. DOI: 10.1016/j.anifeedsci.2006.01.016.
- Chen, Y.; Huang, S.; Tanga, Z.; Chena, X.; Zhang, Z. Structural Changes of Cassava Starch Granules Hydrolyzed by a Mixture of α-amylase and Glucoamylase. Carbohydr Polym. 2011, 85, 272–275. DOI: 10.1016/j.carbpol.2011.01.047.
- Gelders, G. G.; Vanderstukken, T. C.; Goesaert, H.; Delcour, J. A. Amylose-Lipid Complexation: A New Fractionation Method. Carbohydr Polym. 2004, 56, 447–458. DOI: 10.1016/j.carbpol.2004.03.012.
- Shamaia, K.; Bianco-Peled, H.; Shimonic, E. Polymorphism of Resistant Starch Type-III. Carbohydr Polym. 2003, 54, 363–369. DOI: 10.1016/S0144-8617(03)00192-9.
- Cui, R.; Oates, C. G. The Effect of Amylose-Lipid Complex Formation on Enzyme-Susceptibility of Sago Strach. Food Chem. 1999, 65, 417–426. DOI: 10.1016/S0308-8146(97)00174-X.
- Pongjanta, J.; Utaipathanaceep, A.; Naivikhul, O.; Piyachomkwan, K. Debranching Enzyme Concentration Affected on Physicochemical Properties and alpha-Amylase Hydrolysis Rate of Resistant Starch Type-III from Amylose Rice Starch. Carbohydr Polym. 2009, 78, 5–9. DOI: 10.1016/j.carbpol.2009.03.037.