
ABSTRACT
This study aimed to develop a Quality Index Method (QIM) for ice stored Metapenaeus affinis, and estimate its shelf life of shrimp during 12 days of storage analyzing periodically microbiological (total mesophilic (TMC), psychrotrophilic (PTC), physicochemical (TVB-N, TMA, pH, TBARS and FFA), and sensory (Quality Index Method protocol) characteristics. Partial least squares (PLS) regression was used to correlate the QIM attributes, and linear regression analysis was used to check the variables as a function of storage time. Principal component analysis (PCA) was used for interpreting physicochemical and bacteriological quality parameters. The QIM scheme was developed based on 18 demerit points, in which zero indicates total freshness. From the integration of sensory, microbiological, and physicochemical data, it was possible to estimate that the shelf life of ice stored Metapenaeus affinis is 9 days.
Introduction
Shrimp is one of the popular seafood consumed in Iran. In Abadan (West Iran), Metapenaeus affinis, called as king prawn, are caught from marine water (Persian Gulf), processed and sold in the local market or exported. There is a reduced quality due to microbiological and enzymes activities during postmortem storage, which results in undesired odors and off-flavors over time, causing ultimate rejection by the consumer and making shrimp unfit for consumption.[Citation1] Therefore, valid sensory methods were used for freshness assessment of seafood. Quality Index Method (QIM), a tool to assess the sensory properties of shrimp with specific aspects for each species, currently used for determining shrimp freshness. However, these sensory studies should be associated with microbiological and physicochemical analyses to estimation the shelf life.[Citation2] QIM is a sensory method believed to be originally developed by the Tasmanian Food Research Division.[Citation3] In the seafood industry, QIM has been used successfully because of some advantages such as maintaining sample integrity and estimating the period over which the seafood stored at chilling is proper for consumption.[Citation4,Citation5] There are separate schemes for different species of shrimp due to quality standards and spoilage indicators of each species.
The QIM is based on some significant and well-defined aspects of the characteristics of the seafood, such as color, texture, and odor, using a score system from 0 to 3 demerit points. The sum of these scores gives the Quality Index (QI), which the higher score can be given for a single attribute, but the higher the number of demerit points shows that seafood has more defects. The total demerit points obtained by seafood, have a linear correlation between QI and storage time, may be used to readily predict its remaining shelf life.[Citation6] The correlation coefficient between the QI and the storage days should be close to 1.0. The calibration curves give a reliable prediction of the storage time. The calculated standard error of prediction in the reliability of the QIM assessments. There are few scientific researches addressing issues related to QIM of crustacean. Tam et al.[Citation7]; Gonçalves et al.[Citation8] and Oliveira et al.[Citation9] researched the quality assessment applicable to black tiger shrimp (Penaeus monodon), spiny lobster (Panulirus argus) and Litopenaeus vannamei through the use of QI, respectively. The objective of the present study was to investigate the QIM to determine the quality and freshness of shrimp Metapenaeus affinis, correlating the results with microbiological and physicochemical changes that occurred during the ice-storage period.
Material and methods
Sample preparation and storage time
Freshly caught shrimp Metapenaeus affinis were collected from the Persian Gulf in Khozestan (south Iran). The average weight of shrimp was 15.26 ± 0.05 g per shrimp. Immediately after collection, samples were cooled with ice and transported to the Department of Marine Natural Resources, Khorramshahr University of Marine Science and Technology within 1 h. The ratio of shrimp to ice was 1:3 (w/w). Upon arrival, shrimp were washed in cold water. After draining, shrimp weighing approximately 200 g were packed in a zip bag. Shrimp samples were kept in ice in a plastic container with drain holes. Shrimp were re-iced daily to maintain the same ratio. All samples were taken for microbiological, physicochemical, and sensory analyses every 3 days for up to 12 days.
Sensory analysis
The sensory analysis for the development of QIM for raw shrimp was based on methods previously described.[Citation7] Scores were given for each quality attributes according to descriptions, ranging from 0 to 3 (). The scores given for all the quality attributes are summarized by the Quality Index, which increases linearly with the storage time in ice. Three panelists, which had previously been trained according to ISO 8586,[Citation10] experienced in shrimp freshness evaluation carried out the sensory analysis. Photographs of each stage were taken at the same time and should be used to illustrate quality attributes when introducing the QIM concept for assessing shrimp quality to the fishery industry. All analysis was done at baseline (day 0) and at a regular interval of 3 days in triplicate.
Table 1. QIM scheme for sensory evaluation of shrimp metapenaeus affinis.
Microbiological analysis
Samples were collected aseptically. The samples (25 g) were placed in a stomacher bag containing 225 mL of 0.85% saline water. After mixing for 1 min in a stomacher blender, further serial dilution was done using the same diluent. Thereafter, 0.1 mL of appropriate dilution was used for microbiological analysis by spread plate method. The media and condition used were: (a) total mesophilic count (TMC) on pour plates of plat count agar (PCA, Biolife Italian Mascia Brunelli, Italy) incubated for 24–48 h at 37°C; (b) total psychrotrophic bacteria (PTC) on pour plates of plate count agar (PCA, Biolife Italian Mascia Brunelli, Italy) incubated for 10 days at 4°C.
Physicochemical analysis
Total volatile basic nitrogen (TVBN), trimethylamine (TMA), pH, thiobarbituric acid reactive substances (TBARS) and free fatty acid (FFA) were determined. TVBN (mg/100 g shrimp) was measured using the distillation method.[Citation11] This method was determined by distillation after the addition of MgO to homogenized shrimp samples. The distillate was collected in a flask containing aqueous solution of boric acid and methyl red as an indicator. Afterward, the boric acid solution was titrated with a sulphuric acid solution. The TVB-N value was determined according to the consumption of sulphuric acid. To determine the TMA, 20 mL of 35% formaldehyde was added to 25 mL perchloric acid shrimp extract prior to the following steps. Thus, TMA was the only volatile and measurable amine.[Citation12] To determine the pH, 10 mL of distilled water were added to 2 g of ground shrimp. The mixture was homogenized, and the pH was measured in triplicate using a pH meter.[Citation13] To determine the TBA, 10 g of homogenized sample were added with 97.5 mL of distilled water and 2.5 mL of 4N HCl. The mixture was heated with steam distillation. Five mL of distillate was added to 5 mL of thiobarbituric reactive reagent containing 0.02 M TBA in 90% glacial acetic acid and incubated in boiling water for 35 min. After cooling, the absorbance of the pink solution was measured at 538 nm using a spectrophotometer. The constant 7.8 was used to calculate the TBARS number.[Citation14] The TBARS value is expressed as mg malonaldehyde/kg sample. To determine the FFA, the Free Fatty Acid content was determined in the lipid extract by Egan et al.[Citation15]
Statistical analysis
Average were compared through an Analysis of Variance (ANOVA) and effects were considered significant (by Duncan´s test) when p-value ≤0.05. Pearson correlation analysis with 95% of the confidence interval was used to determine the relationship between time of iced storage and QI. Results obtained for QIM were then used to partial least-squares (PLS) regression. Observed and predicted values by linear regression were used to estimate the uncertainty (standard error of estimate) of the prediction of the QI. All regressions were calculated using XLSTAT. Correlation between mean parameter values over time (in days) was then estimated for each parameter in each developing QIM scheme and used to improve and establish the final QIM scheme. Multivariate factor analysis (MFA), by principal component analysis (PCA),[Citation16] was carried out to determine the importance of each parameter of the QIM scheme and to eventually reject those which were unfitted to describe freshness during storage time.
Results and discussion
Quality index method (QIM)
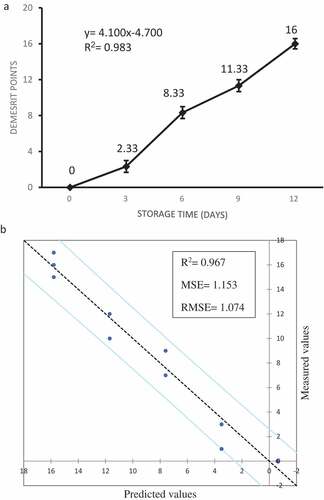
Changes in sensory-based attributes associated with texture, odor, and color have been previously reported for shrimp samples during storage on ice.[Citation7] The recent activity has been in the development of QIM schemes suited to individual species.[Citation17] For this current study, the sensory characteristics (texture, odor, and color) for the quality assessment of ice-stored Metapenaeus affinis are shown in , and the individual scores of the QIM parameters during storage in ice are shown in . The QI for Metapenaeus affinis increased with storage time. On the first and last days of storage (day 0 and day 12), Metapenaeus affinis received a freshly: QI = 0 and completely deteriorate: QI = 16.00. For each storage day of sampling, QI was calculated and there was a linear relationship with storage time and there were highly correlated (R2 = 0.983) between the total QI for each storage day and days in ice (). The evaluation of QIM could be expressed by the linear equation QIM = 4.100× storage time-4.700, indicating a good adjustment of the experimental data. PLS model used to data indicated that the regression model proposed had a standard error of estimate of approximately 1 day (1.153) based on average QI scores of three samples per storage day (). Different results were reported by Gonçalves et al.[Citation8], who obtained Mean Standard Error (MSE) of 2.745 when developing the QIM protocol for spiny lobster (Panulirus argus) with seven attributes. Since the QI is a sum of seven parameter values, the measurement error may be assumed to be normally distributed and the prediction can, therefore, be considered as t-distributed. The 95% confidence interval (estimated by MSE × t (df = 14) = 1.153 × 2.145 = 2.473) may, therefore, be estimated as approximately 2.4 days. The most common procedure to determine the rejection time based on sensory evaluation of freshness is used for comparing QIM scores with the panel scores for fishery industry. The scores given by the trained panelists show that Metapenaeus affinis has a high freshness status (at 0–3 days of ice storage) obtaining a QIM of 0–2.33; the mean QIM is 8.33 at 3–6 days; and after 6 days the QIM exceeds 11.33. The mean scores of day 12 are similar the results appear that the demerit points reached the limit on the 9th day, when members of the panel rejected the samples, making it unfit sensory Metapenaeus affinis from the 9th day due to the presence of unpleasant odor in meat. Therefore, the panelists considered the samples of days 9 and 12 were similar. The shelf life of Metapenaeus affinis stored at ice was deemed to have been 9 days (QI = 11.33), according to the external attributes of sensory evaluation used (). This result was also confirmed by subsequent microbiological analysis. By the day 9 and 12 of storage, mesophilic count and psychrotrophilic count in Metapenaeus affinis became more than 7 log10 CFU/g,[Citation18] which is higher than the maximally recommended limit in raw shrimp. The time of rejection in this study corroborates to the Tam et al.[Citation7] who studied with raw black tiger shrimp (Penaeus monodon) (9 days), and differ with Martinsdóttir et al.[Citation9] and Oliveira et al.[Citation19] who studied with Pandalus borealis and L.vannamei the time of rejection was 10 days and 12 days, respectively. In the final developed QIM scheme, all the parameters showed an increasing linear trend and were highly correlated (R > 0.728) with a time of ice storage ().
Table 2. Average scores for each quality parameters assessed with the QIM scheme for shrimp Metapenaeus affinis stored on ice and the correlation with days on ice
Figure 1. Linear correlation between QIM and storage time of shrimp Metapenaeus affinis during the ice storage (a); Partial Least Squares (PLS) regression for Quality Index Method (QIM) of shrimp Metapenaeus affinis during the ice storage and the predicted values (b)
shows the progress of all parameters considered by Metapenaeus affinis during ice storage. Generally, scores increased during the time of ice storage, and this overall increase was always consistent and with low standard error. However, when data are interpreted carefully, it can be observed that the attributes related to the head and meat color remained stable during the first days of storage. As mentioned earlier, QI showed a gradual increase in sensory evaluation for all attributes. In the first three days, there were no changes for head color attribute. The head color attributes changed from bright pink, no spots to blue-green or slight dark, with moderate spots after the 9th day, and from the 12th day became darken (). The body color attributes changed from blue-green, bright and iridescent to brownish red, opaque, with moderate spots after the 9th day, and from the 12th day became darken (). The meat color attributes changed from translucent and shiny to lime color after the 6th day, and from the 9th day, and 12th day became slightly pinkish and pinkish or light yellow (). The attribute texture showed loss of uniform quality for all samples. Initially, the average QI related to texture was close to zero due to the hard and elastic texture of the muscle, which changed with proteolysis, leading to the soft and watery texture. In the first three days, there were no changes for odor attribute, being characterized as the fresh to sea odor. After six days, the odor of meat showed a progressive increase in the QI, which reached from ammonia odor to the maximum score (putrid) ().
Microbiological evaluation
The total mesophilic (TMC) and psychrotrophilic (PTC) counts of Metapenaeus affinis during 12 days of ice storage are shown in . Most of the spoilage bacteria associated with fresh shrimp can include Pseudomonas, Achromobacter, Flavobacterium as well as Micrococcus.[Citation20] Gram and Huss[Citation21] reported that the Gram-negative psychrotrophic bacteria are the major group of microorganism responsible for spoilage of chilled stored seafood. At day 0 of storage, TMC and PTC bacteria counts were 2.42 log CFU/g and 1.67 log CFU/g, respectively. In general, TMC and PTC bacteria counts increased continuously as the storage time increased (P < 0.05). The TMC and PTC counts for the Metapenaeus affinis during the ice storage period correlated with time, yielding very high coefficients (0.954–0.985). However, the specific bacteria that cause the spoilage of Metapenaeus affinis have not been identified. By day 9 of storage, TMC bacteria count in Metapenaeus affinis became more than 7 log10 CFU/g, which is higher than the maximal recommended limit in marine species.[Citation18] According to Ouattara et al.[Citation22], a bacterial count load in the range of 7 and 8 log10 CFU/g was considered the limit of acceptability in untreated Penaeus shrimp. Similar results obtained by Okpala et al.[Citation23] and Gonçalves and Santos[Citation24], estimating the shelf life of Pacific white shrimp (Litopenaeus vannamei) to be 8 days and 9 days, respectively. Conversely, Mu et al.[Citation25] reported that the shelf life of Pacific white shrimp was determined 6 days.[Citation25] Shrimp shelf life was subsequently determined using a regression analysis (TMC bacteria count = 1.35x + 1.39 × storage time). Based on the regression equation, the mesophilic count limit would be reached on day 6 of storage.
Table 3. Microbiological evaluation of Metapenaeus affinis during ice storage (log CFU/g)
Physicochemical analysis
The changes in the TVBN, pH, TMA, TBARS, and FFA values of Metapenaeus affinis flesh during storage are shown in . The increase of TVBN and TMA compounds may be related to the degradation of proteins and non-protein by bacterial spoilage of shrimp. The determination of TVBN and TMA levels at the time of sensory rejection appears to be adequate to evaluate the spoilage level of shrimp. According to Castro et al.[Citation26], TVBN index is often used as a method in assessing the shelf life of seafood products. The changes in TVBN and TMA levels of Metapenaeus affinis were monitored during ice storage of 12 days (). At day 0, TVBN and TMA contents of Metapenaeus affinis were found 11.89 mg N/100g flesh and 0.40 mg N/100g flesh, respectively, which increased up to 39.59 mg N/100g flesh and 6.72 mg N/100g flesh at the end of the storage period, respectively. TVBN and TMA showed a significant correlation with storage time, gradually increasing with each sampling day (R = 0.986 and R = 0.987, respectively). Acceptability limit of TMA for seafood is 5 mg N/100g.[Citation27] TMA showed a significant correlation with storage time. The TMA values increased during the storage time, which took it above the upper limit of consumption on day 9 (5.18 mg N/100g) and is agreed with results found by Okpala et al.[Citation23] Okpala et al.[Citation23], Dabade et al.[Citation28] and Zhang et al.[Citation29] have reported variable TMA content for shrimps. The increase of TVBN and TMA through time was in agreement with the microorganism activity during storage. The TVBN exceeded the value of 30 mg N/100g on day 9, which is considered the upper acceptability limit (25 mg N/100g) for seafood.[Citation30,Citation31] In this study, a linear increase (R = 0.986) was observed (TVBN content = 7.305× storage time + 4.419) with time.
Table 4. Changes of physicochemical parameters of Metapenaeus affinis during storage on ice
Changes in pH of fresh of Metapenaeus affinis are shown in . The pH of Metapenaeus affinis on day 0 was 7.26, which was closed to the results by Lopez-Caballero et al.[Citation32] (7.3), Mendes et al.[Citation33] (7.1) and Goswami et al.[Citation34] (7.2), but the higher than Litopenaeus vannamei reported by Don et al.[Citation35] (6.35). The pH values in Metapenaeus affinis gradually increased until they reached about 8.08 after 12 days that can be explained by biochemical changes due to the action of tissue enzymes and microorganisms promoting the evaluation of pH.[Citation36] pH correlate significantly with storage time (r = 0.888). Shamshad et al.[Citation37] reported that pH > 7.6 of shrimp Penaeus were classified as unacceptable or putrid. pH value of Metapenaeus affinis up to 9 days of ice storage was acceptability limit (7.58).
Thiobarbituric acid Reactive substances (TBARS) has proved to be valuable indicators to assess the degree of lipid oxidation during the seafood storage. Changes in TBARS value of Metapenaeus affinis are shown in . At the beginning of storage, TBARS values were 0.26 mg malonaldehyde/kg sample. TBARS value of samples increased up to day 9 (P < 0.05) and the abrupt decrease was obtained at day 12. The increase in TBARS during storage may be attributed to the partial dehydration of seafood and interacting lipids with air oxygen.[Citation30] The decrease of TBARS value at day 12 was more likely due to the losses in the secondary lipid oxidation products. The TBARS value showed no significant correlation during storage time. The maximum level of TBARS value indicating the good quality of the seafood (frozen, chilled or stored with ice) is 1–2 mg MDA/kg.[Citation38] In this study, TBARS value of Metapenaeus affinis up to 9 days of ice storage was acceptability limit (2.04 mg MDA/kg).
Both the primary and secondary oxidation products have been assessed to consider the complexity of the lipid oxidation process. The initial FFA value was 1.32% of oleic acid and reached to the maximum amount (12.07% of oleic acid) at the 12th day of storage. A gradual increase in FFA formation of Metapenaeus affinis during ice storage was observed because of hydrolysis of phospholipids and triglycerides because of lipases and phospholipases.[Citation39] FFA showed a significant correlation with storage time (r = 0.990). The increase of FFA may be attributed to the action of the psychrotrophic bacteria especially Pseudomonas spp can produce lipase and phospholipase causing an increase in FFA.[Citation1] There was a positive correlation between FFA and PTC (r = 0.958).
Correlation between sensory, bacteriological, and physicochemical analyses
The correlation between quality parameters of ice-stored Metapenaeus affinis was further measured by principal component analysis (PCA) to provide a small number of linear combinations (principal components of factors) of a set of variables that retains as much information of the original variables as possible (). The parameters included the attributes used in the QIM protocol (texture, odor, and color), in addition to TMC, PTC, TVBN, pH, TMA, TBARS, FFA. In the component analysis, only two vectors were used to explain 99.31%, and the first principal component (PC1) explained 86%, while the second principal component (PC2) explained 13.32% of the variations in the quality parameters as a function of storage time. In the principal component analysis, the vectors length corresponds to the relative importance of each quality parameter for the differentiation of samples, that is, the fundamental parameters for determining shrimp storage time. Thus, the parameters in the order of importance of the vectors are TMC (0.969), PTC (0.986), TVBN (0.997), TMA (0.972), pH (0.814), TBARS (0.829), FFA (0.983), sensory (0.987), with their respective factorial loads in parentheses.
Figure 2. Principal Component Analysis (PCA) of the study quality parameters of ice-stored Metapenaeus affinis: (a) the parameters of the quality index as follows: sensory, TMC, PTC, TVBN, TMA, pH, TBARS, FFA (b) storage time (day): 0, 3, 6, 9, and 12
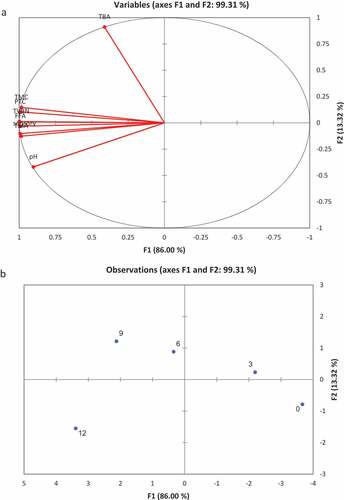
shows the formation of four groups of samples. Samples stored for 0 day are located in the negative PC1 and PC2 quadrants; therefore, it is similar with respect to its freshness. The sample stored for 3 days is located in the negative PC1 quadrant and positive PC2 quadrant, demonstrating that it is different from the previous ones, with lower freshness. Samples stored for 6 and 9 days were located in the positive PC1 and PC2 quadrants, indicating that they were similar to each other and different from the others. Finally, samples stored for 12 days are in the positive PC1 quadrant and negative PC2 quadrant, indicating they are different from the other shrimp samples.
Conclusion
The QIM scheme developed for Metapenaeus affinis stored on ice consisted of seven parameters giving a potential total of 18 demerit points. The calculated QI showed a linear relationship to storage time (QIM = 4.100 × storage time-4.700, R2 = 0.983), which could be used to assess the remaining storage time to an accuracy of ±1 days. The shelf life of ice-stored Metapenaeus affinis according to bacteriological, physicochemical, and results of QIM is 9 days, period in which it is fit for consumption.
Acknowledgments
We would like to thank Khorramshahr University of Marine Science and Technology for supporting this work under research grant contract No. 159.
Additional information
Funding
References
- Nirmal, N. P.; Benjakul, S. Retardation of Quality Changes of Pacific White Shrimp by Green Tea Extract Treatment and Modified Atmosphere Packaging during Refrigerated Storage. Int. J. Food Microbiol. 2011, 149, 247–253. DOI: 10.1016/j.ijfoodmicro.2011.07.002.
- Lanzarin, M.; Ritter, D. O.; Novaes, S. F.; Monteiro, M. L. G.; Almeida Filho, E. S.; Marsico, E. T.; Franco, R. M.; Conte, C. A., Jr; Freitas, M. Q. Quality Index Method (QIM) for Ice Stored Gutted Amazonian Pintado (Pseudoplatystoma Fasciatum × Leiarius Marmoratus) and Estimation of Shelf Life. LWT Food Sci. Technol. 2016, 65, 363–370. DOI: 10.1016/j.lwt.2015.08.019.
- Bremner, H. A.;. A Convenient, Easy to Use System for Estimating the Quality to Chilled Seafood. Fish Process. Bull. 1985, 7, 59–70.
- Sveinsdottir, K.; Hyldig, G.; Martinsdottir, E.; Jorgensen, B.; Kristbergsson, K. Application of Quality Index Methods (QIM) Scheme in Shelf-Life Study of Farmed Atlantic Salmon (Salmo Salar). J. Food Sci. 2002, 67, 1570–1579. DOI: 10.1111/j.1365-2621.2002.tb10324.x.
- Gonçalves, A. A.;. Tecnologia do pescado: Ciência, tecnologia, inovação e legislação; Editora Atheneu: São Paulo, 2011; pp 608.
- Li, X.; Chen, Y.; Cai, L.; Xu, Y.; Yi, S.; Zhu, W.; Mi, H.; Li, J.; Lin, H. Freshness Assessment of Turbot (Scophthalmus Maximus) by Quality Index Method (QIM), Biochemical, and Proteomic Methods. LWT Food Sci. Technol. 2017, 78, 172–180. DOI: 10.1016/j.lwt.2016.12.037.
- Tam, L. N.; Khu, D. N.; Thanh, N. B.; Thi, T. T. V. Towards Improved Quality Benchmarking and Shelf Life Evaluation of Black Tiger Shrimp (Penaeus Monodon). Food Chem. 2017, 235, 220–226. DOI: 10.1016/j.foodchem.2017.05.055.
- Gonçalves, A. A.; de Lima, J. T. A. X.; de Paula, F. E. R. Development of Quality Index Method (QIM) Scheme for Spiny Lobster (Panulirus Argus, Latreille, 1804) Stored in Ice. Food Control. 2015, 47, 237–245. DOI: 10.1016/j.foodcont.2014.07.010.
- Oliveira, V. M.; Freitas, M. Q.; São Clemente, S. C.; Mársico, E. T. Método do Índice de Qualidade (MIQ) desenvolvido para camarão (Litopenaeus vannamei) cultivado (Quality Index Method (QIM) developed for farmed shrimp Litopenaeus vannamei). Revista de Ciência da Vida. 2009, 29(1), 60–71.
- ISO. Sensory Analysis—General Guidance for the Selection, Training and Monitoring of Assessors. Part 1: Selected Assessors, 8586-1; The International Organization for Standardization: Genf, Switzerland, 1993; pp 1–10.
- Goulas, A. E.; Kontominas, M. G. Effect of Salting and Smoking-Method on the Keeping Quality of Chub Mackerel (Scomber Japonicus): Biochemical and Sensory Attributes. Food Chem. 2005, 93, 511–520. DOI: 10.1016/j.foodchem.2004.09.040.
- AOAC. 1995. Association of Official Analytiacal Chemists 15th ed; Washington DC, Chapter, 35: 7–9.
- Masniyom, P.; Soottawat, B.; Visessanguan, W. Combination Effect of Phosphate and Modified Atmosphere on Quality and Shelf-Life Extension of Refrigerated Seabass Slices. J. Food Sci. Technol. 2005, 38, 745–756. DOI: 10.1016/j.lwt.2004.09.006.
- Siripatrawan, U.; Noipha., S. Active Film from Chitosan Incorporating Green Tea Extract for Shelf Life Extension of Pork Sausages. Food Hydrocoll. 2012, 27, 102–108. DOI: 10.1016/j.foodhyd.2011.08.011.
- Egan, H., Kirk, R. S; and Sawyer, R. (1997). Pearson´s Chemical Analysis of Food. 9th Edn. Longman Scientific and Technical.Churchill Livingstone, Edinburgh, UK, pp. 609–634.
- Zar, J. H.;. Biostatistical Analysis; McElroy, W., Swanson, P. Eds.; Prentice-Hall Inc. pp. 619: Englewood Cliffs, N.J., 1999.
- Hyldig, G.; Martinsdóttir, E.; Sveinsdóttir, K.; Schelvis, R.; Bremner, A. Quality Index Method. In: Sensory Analysis of Foods of Animal Origin. Leo ML Nollet and Fidel Toldrá, editors. Boca Raton, CRC Press, s. 2010. 267–284.
- ICMSF. Microorganisms in Foods. The International Commission on Microbiological Specifications for Foods of the International Union of Biological Societies; Blachwell Scientific Publications: Oxford, 1986.
- Martinsdottir, E.; Sveinsdottir, K.; Luten, J.; Schelvis, R.; Hyldig, G. Reference Manual for the Fish Sector: Sensory Evaluation of Fish Freshness; QIM Euro fish: Reykjavik, Iceland, 2001.
- Lu, S.;. Effects of Bactericides and Modified Atmosphere Packaging on Shelf Life of Chinese Shrimp (Fenneropenaeus Chinensis). LWT - Food Sci. Technol. 2009, 42(1), 286–291. DOI: 10.1016/j.lwt.2008.03.004.
- Gram, L.; Huss, H. Microbiological Spoilage of Fish and Fish Products. Food Microbiol. 1996, 33, 121–137. DOI: 10.1016/0168-1605(96)01134-8.
- Ouattara, B.; Sabato, S. F.; Lacroix, M. Combined Effect of Antimicrobial Coating and Gamma Irradiation on Shelf Life Extension of Pre-Cooked Shrimp (Penaeus Spp.). Int. J. Food Microbiol. 2001, 68, 1–9. DOI: 10.1016/S0168-1605(01)00436-6.
- Okpala, C. O. R.;. Investigation of Quality Attributes of Ice-Stored Pacific White Shrimp (Litopenaeus Vannamei) as Affected by Sequential Minimal Ozone Treatment. LWT Food Sci. Technol. 2014, 57, 538–547. DOI: 10.1016/j.lwt.2014.02.007.
- Gonçalves, A. A.; Santos, T. C. L. Improving Quality and Shelf-Life of Whole Chilled Pacific White Shrimp (Litopenaeus Vannamei) by Ozon Technology Combined with Modified Atmosphere Packaging. LWT Food Sci. Technol. 2019, 99, 568–575. DOI: 10.1016/j.lwt.2018.09.083.
- Mu, H.; Chen, H.; Fang, X.; Mao, J.; Gao, H. Effect of Cinnamaldehyde on Melanosis and Spoilage of Pacific White Shrimp (Litopenaeus Vannamei) during Storage. J. Sci. Food Agric. 2012, 92, 2177–2182. DOI: 10.1002/jsfa.5605.
- Castro, P.; Millán, R.; Penedo, J. C.; Sanjuán, E.; Santana, A.; Caballero, M. J. Effect of Storage Conditions on Total Volatile Bases Nitrogen Determinations in Fish Muscle Extracts. J. Aquat. Food Prod. Technol. 2012, 21, 519–523. DOI: 10.1080/10498850.2011.610917.
- Bono, G.; Badalucco, C. Combining Ozone and Modified Atmosphere Packaging (MAP) to Maximize Shelf-Life and Quality of Striped Red Mullet (Mullus Surmuletus). LWT- Food Sci. Technol. 2012, 47(2), 500–504. DOI: 10.1016/j.lwt.2012.02.014.
- Dabadé, D. S.; Den Besten, H. M. W.; Azokpota, P.; Nout, M. J. R.; Hounhouigan, D. J.; Zwietering, M. H. Spoilage Evaluation, Shelf-Life Prediction, and Potential Spoilage Organisms of Tropical Brackish Water Shrimp (Penaeus Notialis) at Different Storage Temperatures. Food Microbiol. 2015, 48, 8–16. DOI: 10.1016/j.fm.2014.11.005.
- Zhang, B.; Ma, L. K.; Deng, S. G.; Xie, C.; Qiu, X. H. Shelf-Life of Pacific White Shrimp (Litopenaeus Vannamei) as Affected by Weakly Acidic Electrolyzed Water Ice-Glazing and Modified Atmosphere Packaging. Food Control. 2015, 51, 114–121. DOI: 10.1016/j.foodcont.2014.11.016.
- Kilincceker, O.; Dogan, I. S.; Kucukoner, E. Effect of Edible Coatings on the Quality of Frozen Fish Fillets. LWT - Food Sci. Technol. 2009, 42, 868–873. DOI: 10.1016/j.lwt.2008.11.003.
- Ojagh, S. M.; Rezaei, M.; Razavi, S. H.; Hosseini, S. M. H. Effect of Chitosan Coatings Enriched with Cinnamon Oil on the Quality of Refrigerated Rainbow Trout. Food Chem. 2010, 120, 193–198. DOI: 10.1016/j.foodchem.2009.10.006.
- López-Caballero, M. E.; Martínez-Alvarez, O.; Gómez-Guillén, M. C.; Montero, P. Quality of Thawed Deepwater Pink Shrimp (Parapenaeus Longirostris) Treated with Melanosis-Inhibiting Formulations during Chilled Storage. Int. J. Food Sci. Technol. 2007, 42, 1029–1038. DOI: 10.1111/j.1365-2621.2006.01328.x.
- Mendes, R.; Huidobro, A.; López Caballero, E. Indole Levels in Deepwater Pink Shrimp (Parapenaeus Longirostris) from the Portuguese Coast. Effects of Temperature Abuse. Eur. Food Res. Technol. 2002, 214, 125–130. DOI: 10.1007/s00217-001-0419-4.
- Goswami, T. K.; Ravindra, M. R.; Nayak, T. K. Time-Temperature Relationships for IQF Shrimp with Liquid Nitrogen and Its Quality Assessment. J. Food Process Eng. 2001, 24, 71–85. DOI: 10.1111/j.1745-4530.2001.tb00532.x.
- Don, S.; Xavier, K. A. M.; Devi, S. T.; Nayak, B. B.; Kannuchamy, N. Identification of Potential Spoilage Bacteria in Farmed Shrimp (Litopenaeus Vannamei): Application of Relative Rate of Spoilage Models in Shelf Life-Prediction. LWT Food Sci. Technol. 2018, 97, 295–301. DOI: 10.1016/j.lwt.2018.07.006.
- Tuckey, N. P. L.; Forster, M. E.; Gieseg, S. P. Effects of Rested Harvesting on Muscle Metabolite Concentrations and K-Values in Chinook Salmon (Oncorhynchus Tshawytscha) Fillets during Storage at 15 Degrees C. J. Food Sci. 2010, 75, C459–C464. DOI: 10.1111/j.1750-3841.2010.01648.x.
- Shamshad, S. I.; Kher-Un-Nisa; Riaz, M.; Zuberi, R.; Qadri, R. B. Shelf Life of Shrimp (Penaeus Merguiensis) Stored a Different Temperature. J. Food Sci. 1990, 55(5), 1201–1205. DOI: 10.1111/j.1365-2621.1990.tb03898.x.
- Moini, S.; Tahergorabi, R.; Hosseini, S. V.; Rabbani, M.; Tahergorabi, Z.; Feas, X.; Aflaki, F. Effect of Gamma Radiation on the Quality and Shelf Life of Refrigerated Rainbow Trout (Oncorhynchus Mykiss) Fillets. J. Food Prot. 2009, 72, 1419–1426. DOI: 10.4315/0362-028X-72.7.1419.
- Rostamzad, H.; Shabanpour, B.; Shabani, A.; Shahiri, H. Enhancement of the Storage Quality of Frozen Persian Sturgeon Fillets by Using of Ascorbic Acid. Int. Food Res. J. 2011, 18, 109–116.