
 ?Mathematical formulae have been encoded as MathML and are displayed in this HTML version using MathJax in order to improve their display. Uncheck the box to turn MathJax off. This feature requires Javascript. Click on a formula to zoom.
ABSTRACT
The objective of this study was to separate and identify the bioactive compounds in the Robusta coffee brew. The coffee brew showed significant potential for antioxidant, anti-α-glucosidase, and antiglycation activities, as well as effectiveness in managing type 2 diabetes mellitus (T2DM). Indonesian Lampung Robusta coffee beans were roasted at the first crack level, followed by grinding and brewing. The bioactive compounds of the coffee brew were separated and isolated using the bioassay-guided approach. The isolated compounds were further identified using NMR and LC-MS. The highly bioactive compounds in the coffee brew were highly polar and present in large amounts. Furthermore, the three major compounds with the most potent bioactivities were identified as 5-O-caffeoylquinic acid (5-CQA), 4-O-caffeoylquinic acid (4-CQA), and 3-O-caffeoylquinic acid (3-CQA). This study also demonstrated that caffeine had little influence on the abovementioned bioactivities. These results are important for the isolation of bioactive compounds in coffee brew for further applications of coffee-based functional foods to overcome T2DM.
Introduction
Coffea arabica (Arabica) and C. canephora (Robusta) are the two important species of coffee with the greatest economic value. Arabica has been reported to have better sensory properties than Robusta; thus, a blend of these two species is common in brews.[1] Robusta coffee brew is well recognized for its strong bitter taste, which is a result of the presence of a variety of compounds, such as alkaloids and phenolic groups.[Citation2] The compositions of the bioactive compounds in Robusta coffee beans are significantly altered by the roasting process.[Citation3,Citation4] High temperature during roasting facilitates the reactions that are responsible for changes in the physicochemical properties of the roasted coffee beans.[Citation5,Citation6] Some reactions (such as Maillard, pyrolysis, and caramelization) that occur during the roasting process induce transformations of color, flavor, and aroma, while also causing significant changes in the compositions of the bioactive compounds present in the coffee beans.[Citation1,Citation3] Some researchers noticed that the first crack is the critical point for the alteration of the physicochemical properties of the coffee beans during roasting.[Citation4–Citation6] The cracking of the coffee beans is identified by hearing a special sound similar to a popping sound,[Citation6] which occurs at approximately 175–185°C.[Citation5] Therefore, the study of the bioactive compounds in Robusta coffee beans at the first crack roasting level could considerably enrich the previous findings reported for green coffee beans[Citation7,Citation8] and commercially roasted coffee beans.[Citation9]
Epidemiological studies show that the consumption of coffee brew contributes to the prevention of noncommunicable diseases including type-2 diabetes mellitus (T2DM),[Citation10,Citation11] which is one of the most frequently reported diseases in the world, with high rates of morbidity and mortality.[Citation12] Therefore, the consumption of food-sourced natural components to prevent T2DM has become popular in the last decade. In addition, many researchers are working to better understand how to increase the benefits of natural compounds for diabetic management.
The presence of bioactive compounds in food is beneficial for the management of T2DM through several plausible mechanisms, such as antioxidant, anti-α-glucosidase, and antiglycation activities. An antioxidant agent helps to prevent the oxidative stress that causes pancreatic injury, which occurs in the developmental stages of T2DM.[Citation13] Anti-α-glucosidase agents also contribute to T2DM prevention by inhibiting the oligosaccharide hydrolysis enzymes, thereby reducing the absorption of glucose from the small intestinal wall,[Citation14,Citation15] while an antiglycation agent plays a significant role in reducing the formation of advanced glycation end products (AGEs).[Citation16]
Numerous studies have reported that compounds originating from plants and natural products, such as fukugetin, palmatine, berberine, honokiol, amorfrutins, trigonelline, gymnemic acids, gurmarin, and phlorizin have demonstrated considerable anti-diabetic activities.[Citation17] In addition to the compounds above, some natural compounds have also shown beneficial effects in anti-diabetic treatment. Phenolic compounds of plant origin become key enzyme inhibitors in carbohydrate digestion.[Citation18] For instance, (–)-epigallocatechin-3-gallate (EGCG) present in tea accounted for oxidative stress prevention and α-glucosidase inhibition.[Citation19] Chlorogenic acids (CGAs) are phenolic compounds that have been proposed as major contributors to antioxidative activity in coffee brew.[Citation7] Moreover, coffee brew shows greater antioxidative activity than green tea and black tea extract.[Citation20]
To our knowledge, the specific natural compounds isolated from coffee brew demonstrating effective mechanisms for diabetes management have not been reported. Therefore, this study sequentially fractionated and separated Robusta coffee brew in order to obtain fractions and some single compounds. The purpose of this work was to separate and identify the most potent bioactive compounds responsible for the antioxidant, anti-α-glucosidase, and antiglycation activities in Robusta coffee brew. The results can potentially be used for further applications in functional food production.
Materials and methods
Chemicals
Bovine serum albumin (BSA), rat intestinal acetone powder, 2,2-diphenyl-1-picrylhydrazyl (DPPH), 6-hydroxy-2,5,7,8-tetramethyl-chroman-2-carboxylic acid (Trolox); 2,2ʹ-azobis (2-methyl-propionamidine) dihydrochloride (AAPH), and fluorescein (FL) sodium salt were purchased from Sigma-Aldrich, Inc. (St. Louis, USA). Aminoguanidine sulfate hydrate and 5-O-caffeoylquinic acid (5-CQA) were purchased from Tokyo Chemical Industry Co., Ltd. (Tokyo, Japan). Formic acid, BT Chelex® 100 Resin, and 2-morpholinoethane sulfonic acid (MES) were purchased from Nacalai Tesque, Inc. (Kyoto, Japan), Bio-Rad Laboratories, Inc. (California, USA), and Dojindo Molecular Technologies, Inc. (Kumamoto, Japan), respectively. Ultrapure (type 1) water produced by a Milli-Q ultrafiltration device (Simplicity® UV; Merck Millipore Corp., Darmstadt, Germany) was used in all experiments. Other chemicals used in this experiment were purchased from Wako Pure Chemical Industries, Ltd. (Osaka, Japan).
Sample preparation
Robusta Lampung EK1 green coffee was purchased from PT. Lintang Visikusuma (Jakarta, Indonesia). The green coffee beans (1 kg) were roasted in a Toper TKM-X 5 roaster machine (Toper, Izmir, Turkey) for 5.5 min with an inlet and outlet temperature of 200°C and 210°C, respectively. The roasting process was stopped after reaching the first crack or color lightness (L*) at 32.02 ± 1.35. The roasted beans (15 g) were ground using a Eureka Mignon coffee grinder (Eureka, Florence, Italy) and then packed in vacuum-sealed aluminum foil containers before being refrigerated. The coffee was brewed by adding 100 mL boiling water to 5 g ground coffee (5 g eq./100 mL coffee brew). The mixture was heated to 95°C, stirred using a magnetic stirrer for 1 min, cooled and stirred in an ice bath for 2 min, and finally passed through a Kiriyama funnel filter paper No. 5C (Kiriyama Glass Works Co., Tokyo, Japan).
Separation and isolation of the bioactive compounds
The coffee brew (2 mL) was fractionated on octadecylsilane (ODS) Sep-Pak C18 open column cartridges (Waters, New York, USA). The column was successively eluted with 10 mL water, 20% MeOH, 40% MeOH, MeOH, and EtOH. Each fraction was collected, dried, and weighed. Solid particles were rediluted with 2 mL water (for water and 20% MeOH fractions) or MeOH (for 40% MeOH, MeOH, and EtOH fractions). The separation in the ODS Sep-Pak was conducted four times, resulting in a total of 8 mL of each fraction solution. Water, 20% MeOH, and 40% MeOH fractions were separated by a Hitachi 860-CO HPLC system equipped with a UV/VIS detector (Japan Spectroscopy Co., Ltd., Tokyo, Japan) in a Cosmosil 5C18-MS-II column (10 × 250 mm; Nacalai Tesque, Inc., Kyoto, Japan) with 0.05% formic acid and MeOH as a mobile phase to verify the activity of the fractions. From this verification, only water and 20% MeOH fractions were selected for further separation using a Hitachi 860-CO HPLC system equipped with UV/VIS detector (Japan Spectroscopy Co., Ltd., Tokyo, Japan), using an Inertsil® ODS-4 column (10 × 250 mm; GL Sciences, Inc., Tokyo, Japan). The fraction (100 µL) was injected into the column for 40 times of injection (total 4 mL for each fraction). The mobile phase (0.05% formic acid (A) and MeOH (B)) was delivered into the column at 3 mL min−1 with the following gradient mode: 0 min (5% B), 0–35 min (50% B), 35–40 min (50% B), 40–45 min (5% B), and 45–55 min (5% B). The peak groups separated from the water fraction and the 20% MeOH fraction detected by the UV detector (254 nm) were collected. There were eight peak groups (P) separated from the water fraction: P. 1.1 ( = 0.0–5.5 min), P. 1.2 (
= 5.5–17.0 min), P. 1.3 (
= 17.0–19.0 min), P. 1.4 (
= 19.0–23.0 min), P. 1.5 (
= 23.0–24.5 min), P. 1.6 (
= 24.5–25.5 min), P. 1.7 (
= 25.5–27.0 min), and P. 1.8 (
= 27.0–29.5 min). There were 12 peak groups (P) separated from the 20% MeOH fraction: P. 2.1 (
= 0.0–5.5 min), P. 2.2 (
= 5.5–17.0 min), P. 2.3 (
= 17.0–19.0 min), P. 2.4 (
= 19.0–23.0 min), P. 2.5 (
= 23.0–24.5 min), P. 2.6 (
= 24.5–25.5 min), P. 2.7 (
= 25.5–27.0 min), P. 2.8 (
= 27.0–29.5 min), P. 2.9 (
= 29.5–30.5 min), P. 2.10 (
= 30.5–34.0 min), P. 2.11 (
= 34.0–35.0 min), and P. 2.12 (
= 35.0–39.0 min). The fractions with the four highest peaks (P. 1.3, P. 1.6, P. 2.5, and P. 2.7) were further injected into the HPLC to determine the number of the compound in each peak. Peaks P.1.3, P.1.6, and P.2.7 consisted of one high peak, further designated as compounds 1.3, 1.6, and 2.7. Peak P.2.5 consisted of one high peak and three low peaks. The P.2.5 fraction was further separated using a Cosmosil cholester column (10 × 250 mm; Nacalai Tesque, Inc., Kyoto, Japan) in a SHIMADZU HPLC system equipped with a diode-array detector (DAD) (SHIMADZU Corp., Kyoto, Japan). The elution mode for the P.2.5 fraction purification was like the aforementioned separation using HPLC in the ODS-4 column. The high peak (
= 27.6 min) was collected and designated as compound 2.5. The flow chart of the separation and isolation of the compounds responsible for the antioxidant, α-glucosidase inhibitor, and glycation inhibitor activities from the Robusta coffee brew are presented in .
Figure 1. Flow chart of the separation and isolation of the antioxidant, α-glucosidase inhibitor, and glycation inhibitor from Robusta coffee brew. The separation and isolation were conducted in triplicate (n =3). The concentration of the coffee brew, coffee fractions, and single compounds were equivalent with 5 g ground coffee/100 mL coffee brew (5 g eq./100 mL). P.1.1-P.1.8*: P.1.1, P.1.2, P.1.4, P.1.5, P.1.7, and P.1.8 were the peak groups separated from the water fraction. P.2.1-P.2.12**: P.2.1, P.2.2, P.2.3, P.2.4, P.2.6, P.2.8, P.2.9, P.2.10, P.2.11, and P.2.12 were the peak groups separated from the 20% MeOH fraction
Three assays (antioxidative, anti-α-glucosidase, and antiglycation activities) were used to determine the activities of the separated and isolated samples. By using this bioassay-guided approach, the most potent contributors to the activities could be directly chosen for identification at the end of this work. In this study, Robusta coffee beans were obtained at a critical roasting level, at which excessive changes in the chemical composition of the beans had just begun.[Citation4] Utilization of this level allowed us to study coffee beans containing equal proportions of native and newly formed bioactive compounds. The three isolated compounds (compound 1.3, compound 1.6, and compound 2.5) that showed significant activities were chosen for identification using LC-MS and NMR analyses and for quantitation by weighing and HPLC analysis. The other compounds, or peaks (P. 1.1, P. 1.2., etc.), which had lower activities, were not further identified.
DPPH assay
The DPPH analysis was conducted based on the protocol developed in the previous study.[Citation21] A series of Trolox standard solutions or a series of sample solutions at various concentrations were used for the measurements. The results were expressed as Trolox equivalents (µmolTE L−1), which were calculated by dividing the sample curve slope by the Trolox curve slope.
H-ORAC assay
The hydrophilic oxygen radical absorbance capacity (H-ORAC) method validated by the previous study[Citation22] was used to evaluate the antioxidant activity of the coffee brew and its fractions. The H-ORAC values were expressed as Trolox equivalents (µmolTE L−1).
Antiglycation assay
Antiglycation activity was determined using the procedures described by the previous study,[Citation23] with modifications. Fifty microliters of each sample or aminoguanidine sulfate hydrate as a positive control (2.5, 5, 7.5, and 10 mg mL−1) was mixed with 900 µL of 0.1 M phosphate buffer (sodium phosphate buffer pH 7.4 treated by Chelex resin), 300 µL of BSA solution (50 mg mL−1 in water), and 300 µL of fructose solution (0.22 g mL−1 in water).
Blank sample reactions were also determined without adding BSA and fructose. The sample mixtures were incubated at 37°C for 72 h. The fluorescence levels were read under a Tecan Infinite® 200 luminescent spectrophotometer (Tecan Group Ltd., Männedorf, Switzerland) every 24 h at an excitation/emission wavelength pair λ =370/440. The inhibition of each sample on the fructose-induced glycation of BSA was expressed as IC50 (the concentration for 50% inhibition), where inhibition was calculated as follows:
where: IA was the inhibition, A0 was the intensity of the blank sample, A1 was the intensity before incubation, and A2 was the intensity of the sample after incubation.
Anti-α-glucosidase assay
The inhibition of α-glucosidase activity was determined using the previously reported protocol[Citation24] with some modifications. Rat intestinal acetone powder (100 mg), used as an enzyme source, was placed in a 1.5 mL Eppendorf tube and suspended in 1 mL 0.1 M sodium phosphate buffer (pH 7.0). The suspension was centrifuged at 10.000 × g for 45 min at 4°C using a Himac CF16RX centrifuge unit (Hitachi Koki Co., Ltd., Tokyo, Japan). The rotor used was a fixed T16A31 angle rotor at a 45° angle (Hitachi Koki Co., Ltd., Tokyo, Japan). A sample (25 µL), 0.1 M phosphate buffer (100 µL), 0.25 M maltose in phosphate buffer (100 µL), and 10 mg mL−1 crude enzyme solution (25 µL) were incubated at 37°C for 40 min, enabling the sample to produce glucose. The reaction was stopped using 250 µL of 0.2 M Na2CO3. For the positive control and blank sample, acarbose and DMSO were used instead of the sample. The sample solution (16 µL) was mixed with glucose color reagent (240 µL) in a 96-well plate, incubated for 5 min in a micro PST-60HL-4 thermoshaker (Biosan, Riga, Latvia), and read by a microplate reader at 505 nm. The glucose concentration was quantified by a glucose calibration curve, while the inhibitory activity was calculated as follows:
where: IA was the inhibition, A was a sample producing glucose, B was a blank sample producing glucose, C was a control sample, and D was a control blank sample for control producing glucose.
LC-MS analysis
A SHIMADZU LC-MS-2020 system (SHIMADZU Corp., Kyoto, Japan) was used for the bioactive compound molecular weight elucidation. Each sample (2 µL) was eluted in a Cosmosil 5C18-MS-II column (2.0 × 150 mm; Nacalai Tesque, Inc., Kyoto, Japan), and the temperature was kept at 40°C. The mobile phases (0.05% formic acid (A) and HPLC grade MeOH (B)) passed through the column at a flow rate of 1 mL min−1. The elution was performed in the following gradient mode: 0 min (5% B), 0–30 min (90% B), 30–35 min (90% B), 35–40 min (5% B), and 40–50 min (5% B). Detections were performed in the PDA detector and were recorded at 254 nm and 320 nm. The ESI source in negative and positive mode was used for the MS analysis. The analyses were performed under the following conditions: an m/z range of 150–1000; a desolvation gas (N2) with a drying and nebulizer flow rate of 15 L min−1 and 1.5 L min−1, respectively; a scan speed of 883 u/sec; ESI voltage of +4.5 kV and −3.5 kV; a capillary temperature of 250°C; a DL temperature of 250°C; a heat block temperature of 200°C; and detector voltage of −1.1 kV and −1.0 kV.
NMR analysis
The proton (1H) and carbon (13C) nuclear magnetic resonance (NMR) spectra of the pure compounds were recorded at 500 MHz on a JNM-ECX500 NMR spectrometer (JEOL USA, Inc., Massachusetts, USA). Deuterium oxide (D2O) with purity ≥99.9% was used as the solvent.
HPLC analysis for quantification
The isolated single compounds were quantified using HPLC. The single compound solutions (5 g eq./100 mL coffee brew) were filtered through a 0.45-µm PTFE membrane (Sigma-Aldrich, Darmstadt, Germany). The filtrate (20 μL) was eluted on a Zorbax C18 column (4.6 × 150 mm; Agilent Technologies, Inc., Santa Clara, USA) with a SHIMADZU LC-20AD system equipped with UV/VIS detector (SHIMADZU Corp., Kyoto, Japan). HPLC grade MeOH (A) and 0.05% formic acid in HPLC grade water (B) passed through the column at a flow rate of 1 mL min−1 in the following gradient system: 0 min (5% A), 0–30 min (90% A), 30–35 min (90% A), 35–40 min (5% A), and 40–50 min (5% A). The compounds were detected at 320 nm. A 5-point of 5-CQA standard curve with concentrations ranging from 31 to 500 mg L−1 (triplicate, LoD = 2.3 mg L−1, and r2 = 0.996) was used for quantification of the isolated compounds detected at 320 nm according to the previously reported method.[Citation25] The concentrations were expressed as mg mL−1.
Statistical analysis
Data were evaluated using one-way analysis of variance (ANOVA), followed by the Duncan test for multiple comparisons. The software used for these analyses was SPSS Statistics 22 (IBM Corp., New York, USA).
Results and discussion
Separation and isolation of the bioactive compounds
represents the activity of the Robusta coffee brew fractions separated in the ODS Sep-Pak open columns. The fractions (mixed, water, 20% MeOH, 40% MeOH, MeOH, and EtOH) exhibited significant differences (p < .05) in DPPH scavenging activity, hydrophilic oxygen radical absorbance capacity (H-ORAC), and α-glucosidase inhibition. The Robusta coffee brew contained primarily polar compounds, which were dissolved in water and polar organic solvents. Phenolics, alkaloids, and melanoidins were reported to be the three major compounds detected in the coffee brew.[Citation3] In this study, the compounds were distributed in the five fractions according to their polarity as follows: water > 20% MeOH > 40% MeOH > MeOH > EtOH. The phenolics possessed different polarities, depending on their structures. The previous study reported that caffeoylquinic acids (CQAs) demonstrated higher polarity than did diCQA.[Citation26] Caffeine, a major alkaloid in coffee brew, was partially polar; thus, it was soluble in water and polar organic solvents.[Citation27] Furthermore, compared to the phenolics, the melanoidins were less soluble since they were obtained according to ethanol solubility.[Citation28] Note that the distributions of these compounds determined the activities of the coffee brew fractions.
Figure 2. Different activities of coffee brew fractions separated in the ODS Sep-Pak as determined by the DPPH assay (a), H-ORAC assay (b), and anti-α-glucosidase assay (c). The concentration of coffee fractions was 5 g eq./100 mL. The values were expressed as the mean ± SD (n= 3). Different superscripts indicate significant differences in the Duncan test (p< .05)
The highest DPPH scavenging activity was attributed to the 40% MeOH fraction, followed by the 20% MeOH, MeOH, water, and EtOH fractions (). The DPPH scavenging activity of the mixed sample (mixture of all fractions) was only slightly higher than that of the 40% MeOH fraction. Thus, the compounds dissolved in 40% MeOH exhibited higher antioxidative activity against the DPPH radical than did those dissolved in the other solvents. Interestingly, the 40% MeOH fraction contained less soluble solid (1 mg mL−1) than did the water fraction (6 mg mL−1) and the 20% MeOH fraction (5 mg mL−1). The high antioxidative activity of the compounds in the 40% MeOH presumably showed that they served as extraordinary radical scavengers, and the activity was most likely augmented by interactions between the compounds and DPPH radicals due to the polarity of the compounds. The DPPH assay was considered more sensitive for determination of the antioxidative activity of less polar compounds.[Citation29] In this study, the compounds in the 40% MeOH fraction were less polar than those in the water and 20% MeOH fractions, allowing them to have more intensive interactions with the DPPH radicals. Differences in DPPH radical scavenging due to polarity variations were also revealed by the data of the MeOH fraction and the EtOH fraction. Although these fractions contained very small amounts of soluble solid, i.e., about <1 mg mL−1, they demonstrated comparable scavenging activity with the water and 20% MeOH fractions.
As depicted in , the antioxidant activity for each fraction based on the H-ORAC assay followed the order: 20% MeOH > water > 40% MeOH > MeOH > EtOH. This ordering occurred although the content of soluble solid in the 20% MeOH fraction (5 mg mL−1) was lower than that in the water fraction (6 mg mL−1), affecting the H-ORAC antioxidative activity. Generally, the polarity of a compound is positively related to the antioxidant activity according to the ORAC assay,[Citation29] and particularly the H-ORAC assay.[Citation22] In this case, the antioxidative activity of the 20% MeOH fraction by the H-ORAC assay was higher than that of the water fraction, suggesting that the polarity of both fractions did not affect the antioxidant activity by the H-ORAC method. The remaining fractions (40% MeOH, MeOH, and EtOH) exhibited low and very low H-ORAC antioxidative activity, which was likely associated with their lower soluble solid content (bioactive content) and polarity compared to the water and 20% MeOH fractions.
Concerning α-glucosidase inhibition, the 40% MeOH fraction exhibited the most potential for inhibiting α-glucosidase activity, followed by the 20% MeOH, water, MeOH, and EtOH fractions (). This result is in accordance with the results of the DPPH scavenging activity (), where the 40% MeOH, which contained less soluble solid, exhibited higher activities than the fractions containing more soluble solid. The compounds dissolved in the 40% MeOH fraction may have had more interactions with the α-glucosidase enzyme, resulting in greater inhibition activity. However, further interactions between the compounds and the enzyme were not addressed in this study.
presents another potential bioactivity of the coffee brew fractions, namely, anti-advance glycation end-product (AGEs) formation activity (antiglycation activity). The evaluation of the antiglycation activity for each fraction could not be conducted for the concentration of 2.5–10 mg mL−1 due to unsatisfactory repeatability. Therefore, the evaluation was conducted for the mixed fraction. After 24 h of incubation, the mixed fraction sample (mixture of water, 20% MeOH, 40% MeOH, MeOH, and EtOH) displayed a relatively high antiglycation activity, which remained approximately 2.3 times lower than that of the aminoguanidine (positive control). When the fractions were omitted from the mixture, the mixture without the 20% MeOH showed the lowest inhibition of glycation, followed by mixtures without water or without 40% MeOH. The absence of MeOH and EtOH in the mixture did not affect the antiglycation activity, which suggests that the 20% MeOH was the fraction exhibiting the highest antiglycation activity.
Table 1. Antiglycation activities of the Robusta coffee brew fractions separated in the ODS Sep-Pak
In addition to glycation inhibitory activity, the 20% MeOH fraction also showed the highest antioxidant activity assessed by H-ORAC. Inhibiting the formation of AGEs is linked to an oxidative reaction, while the compounds responsible for antioxidant capacity also exhibit anti-AGE capacity.[Citation30]
Among the five coffee brew fractions separated in the ODS Sep-Pak, the water, 20% MeOH, and 40% MeOH fractions exhibited the most potential for antioxidant, anti-α-glucosidase, and antiglycation properties. However, the 40% MeOH fraction contained a small amount of soluble solid (1 mg mL−1) compared to the water fraction (6 mg mL−1) and the 20% MeOH fraction (5 mg mL−1). It was difficult to isolate the single compound from the 40% MeOH fraction. Therefore, the three fractions were subjected to HPLC in a 5C18-MS-II column to separate the subfractions to verify their activities. The activities of the subfractions separated from the water, 20% MeOH, and 40% MeOH fractions are presented in . In general, the subfractions separated from the 40% MeOH fraction (Fr. 3.1–Fr. 3.6) exhibited lower antioxidant and anti-α-glucosidase activities than the subfraction separated from the water fraction (Fr. 1.1–Fr. 1.4) and the 20% MeOH fraction (Fr. 2.1–Fr. 2.6). Hence, the water and 20% MeOH fractions were further separated using HPLC in the ODS-4 column to isolate single compounds.
Figure 3. Different activities of the subfractions separated from the water, 20% methanol, and 40% methanol fractions in the HPLC-5C18-MS-II column: DPPH (a), H-ORAC (b), and anti-α-glucosidase (c). The concentrations of coffee subfractions were 5 g eq./100 mL. The values were expressed as the mean ± SD (n =3). Different superscripts indicate significant differences in the Duncan test (p< .05)
Eight peak groups were separated from the water fraction (P. 1.1 – P. 1.8) using HPLC in the ODS-4 column, as shown in , and P.1.3 and P.1.6 showed the highest peaks, which consisted of one single compound for each peak, designated as comp. 1.3 and comp. 1.6, respectively. shows the 12 peak groups (P. 2.1–P.2.12) separated from the 20% MeOH fraction using HPLC in the ODS-4 column. The separations to obtain single compounds were carried out for P.2.7 (detected as a single compound, named as comp. 2.7) and P 2.5 (one high peak and three low peaks). The single compound collected from the P 2.5 fraction was designated as comp. 2.5. The low peak groups consisting of mixed compounds were not further separated.
Figure 4. HPLC chromatograms of water (a) and 20% MeOH (b) fractions separated in the HPLC-ODS 4 column
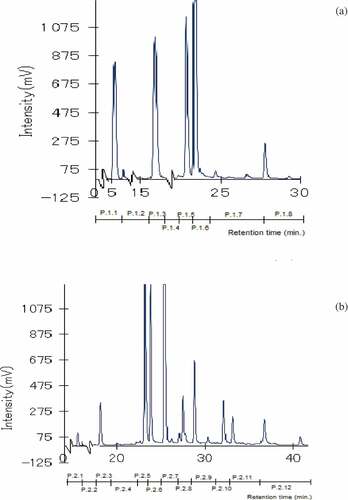
The DPPH values, ORAC values, and α-glucosidase inhibition of the peak groups and single compounds separated from the water and 20% MeOH fractions are presented in –c, respectively. The samples exhibited significantly different behaviors during specific stages (p <.05). In general, most of the compounds, or peak groups, contributed to the three activities studied, which were dependent on the concentrations of the compounds as represented by the peak intensities. The compounds with higher peak intensities exhibited greater activities, except for P. 1.1 and comp. 2.7. The comp. 2.7 was the most abundant compound, yielding up to 0.9 mg mL−1 coffee brew, and it exhibited a very high peak intensity. However, this fraction showed inferior antioxidative (DPPH and H-ORAC) activities and α-glucosidase inhibition activity compared with the other compounds, or peaks. According to the LC-MS analysis, this compound was identified as caffeine, as revealed by a maximum UV absorption at 272 nm and positively charged molecular ions [M+H]+ at m/z 195. Therefore, caffeine might not be one of the important bioactive compounds accounting for radical scavenging and α-glucosidase inhibition. This finding is in agreement with other studies in which caffeine less effectively scavenged free radicals,[Citation31–Citation34] although some reports stated that caffeine was one of the important compounds responsible for the antioxidant properties found in coffee brew.[Citation1,Citation35] The P 1.1 also showed a high intensity, but its activity was very low. The main peak in this peak group was not phenolic, because it did not have a maximum absorbance at 320 nm.
Figure 5. Different activities of peaks and compounds of the water and 20% MeOH fractions separated in the HPLC-ODS 4 column: DPPH (a), H-ORAC (b) and anti-α-glucosidase (c). The concentrations of the peaks or compounds were 5 g eq./100 mL. All values were expressed as the mean ± SD (n = 3). Different superscripts indicate significant differences in the Duncan test (p < .05)
Based on the DPPH scavenging activity (), there were five highly active compounds, or peak groups, i.e., comp. 1.6, comp. 1.3, P. 1.5, comp. 2.5, and P. 2.12, which were attributed to phenolics because of the maximum absorbance at 320 nm. Moreover, the P. 2.6 and five last peak groups separated from the 20% MeOH fraction () showed relatively high DPPH scavenging activity (). These peak groups also contained phenolic groups, based on their maximum absorbance at 320 nm.
shows that the five most active compounds, or peak groups, included comp. 1.3, P. 1.5, comp. 1.6, comp. 2.5, and P. 2.6. In addition, the last five phenolic groups separated from the 20% MeOH fraction, as mentioned above, also exhibited considerable H-ORAC antioxidative activity. Three compounds exhibited high and selective α-glucosidase inhibitory activity, i.e., comp. 1.3, comp. 1.6, and comp. 2.5, as shown in . The remaining compounds, or peaks, exhibited lower activity. Briefly, this study showed that the major contributors for antioxidative (DPPH and H-ORAC) activities and α-glucosidase inhibitory activity were the phenolic compounds, with comp. 1.3, 1.6, and 2.5 reported to have very high activities.
Structural identification and quantification of bioactive compounds
The LC-MS and NMR identification of compounds 1.3, 1.6, and 2.5 are presented in . The molecular ions of the bioactive compounds were at m/z 355 for the positive ion ([M +H]+) and 353 for the negative ion ([M-H]−). These spectra corresponded to caffeoylquinic acid (CQA) or chlorogenic acid isomers. The CQA isomers were identified based on their spectra at m/z 355 for the positive ion ([M +H]+) or at m/z 353 for the negative ion ([M-H]−).[Citation36,Citation37]
Table 2. LC-MS molecular ion; 13C NMR and 1H NMR (500 MHz, D2O) chemical shifts; and quantitative data of 5-CQA, 4-CQA, and 3-CQA isolated from coffee brew
Further identification of the CQA isomer was performed using 1H NMR, 13C NMR, DEPT-90 NMR, DEPT-135 NMR, and two-dimensional NMR (correlation spectroscopy (COSY), heteronuclear multiple-bond correlation (HMBC), and heteronuclear multiple quantum coherence (HMQC)). The results of instrumental measurements helped to identify compounds 1.3, 1.6, and 2.5 as 3-O-caffeoylquinic acid (3-CQA), 5-O-caffeoylquinic acid (5-CQA), and 4-O-caffeoylquinic acid (4-CQA), respectively, as presented in . The 13C NMR spectrum for the CQA presents 16 carbon atoms, with 7 and 9 atoms for the quinic and caffeoyl moieties.[Citation38] These isomers were identified according to the position of the ester bound in the quinic moiety. An ester bond observed in an HMQC spectra showed a coupling between resonating 1H and 13C: 1H (δ 5.15 ppm) with carbon C5 (δ 71.05 ppm) for 5-CQA; 1H (δ 4.75 ppm) with carbon C4 (δ 78.25 ppm) for 4-CQA; and 1H (δ 5.28) with carbon C5 (δ 72.80 ppm) for 3-CQA (). The chemical structures of 5-CQA, 4-CQA, and 3-CQA are depicted in .
Figure 6. The chemical structure of 5-O-caffeoylquinic acid (a), 4-O-caffeoylquinic acid (b), and 3-O-caffeoylquinic acid (c)
Previous researchers reported that coffee brew contained nine native phenolic acids.[Citation9] There are three major phenolic acids found in green or roasted coffee, including monoCQAs such as 5-CQA, 4-CQA, and 3-CQA, while 5-CQA is present at the highest level.[Citation7,Citation9,Citation37] Similarly, our study showed that these substances were observed to be the main phenolic compounds of coffee brew from Robusta beans roasted in the first crack level. The quantitation of 5-CQA, 4-CQA, and 3-CQA in the isolated compounds using weighing and HPLC methods is presented in . The highest abundance of the compound was attributed to 5-CQA.
This study confirmed that phenolic acids greatly contributed to the antioxidant activity of coffee brew, as reported in previous studies,[Citation1,Citation3,Citation7] although one study reported that the main compounds responsible for antioxidant activity were melanoidins, caffeic acid, and caffeine rather than chlorogenic acid (CQA).[Citation35] Therefore, this study proposes three specific phenolic acids demonstrating the highest contribution to antioxidative and anti-α-glucosidase activities in Robusta coffee brew.
Some studies identified newly formed compounds in the roasted coffee beans, such as phenolic acid derivatives (chlorogenic acid lactones, free cinnamic acid, etc.),[Citation39] nitrogen-containing compounds,[Citation39] and melanoidins.[Citation1] In this study, phenolic acid derivatives might be represented by low-intensity peaks detected by HPLC. Since these peaks exhibited low activities, they were not further isolated for identification. Our previous study showed that melanoidins with high molecular weight (MW > 12–14 kDa) negatively correlated with antioxidative activity;[Citation4] thus, they were not further isolated and identified. Our investigation verified previous reports showing the relationship between 5-, 4-, and 3-CQA concentration and antioxidative activity.[Citation7] Another study reported that the positive standard of 3-CQA and 5-CQA possessed higher inhibitory effects on α-glucosidase activity than did the coffee extract.[Citation40]
As some researchers reported that phenolic acids are potential inhibitors against α-glucosidase,[Citation15,Citation41] this study also found that specific phenolic acids (5-CQA, 4-CQA, and 3-CQA) served as the three major contributors to α-glucosidase inhibition in addition to antioxidant activity. According to glycation inhibition, 5-CQA, 4-CQA, and 3-CQA may also play important roles in the activity, since caffeine, the other major compound, is less effective in preventing AGE formation.[Citation30] Hence, our experimental results successfully confirmed that CQAs can provide advantageous effects on T2DM management through the following plausible mechanisms: antioxidant (radical scavenging), α-glucosidase inhibition, and glycation inhibition. The efficacy of these compounds for T2DM management may occur in different locations, since CQAs possess a high accessibility[Citation42] and high bioavailability in human.[Citation43] Moreover, an efficacy study should be conducted to evaluate the effectiveness of coffee bioactive compounds as anti-diabetic agents.
Conclusion
Bioactive compounds of Robusta coffee brew prepared from beans roasted at the first crack level were successfully separated and isolated according to bioassay-guided techniques. Antioxidant and anti-α-glucosidase agents in Robusta coffee brew occurred in a variety of polarities and concentrations. The compounds 5-CQA, 4-CQA, and 3-CQA possessed high polarity and exhibited the largest contributions to the activities, while they were also detected as major phenolics in Robusta coffee brew. In addition, we found that caffeine had little effect on the activities. Our study is highly meaningful for further possible applications of coffee as a functional food.
Acknowledgments
The authors acknowledge the Ministry of Research, Technology, and Higher Education of the Republic of Indonesia for the financial support [grant numbers 1689/IT3.11/PN/2018, February 21, 2018]. The authors also thank the Japan Student Services Organization (JASSO) for a one-year scholarship in Japan for the first author. Our appreciation is also given to Associate Prof. Tomoko Shimamura for her valuable contributions during the experiment at Kochi University, Japan. The authors state that they have no conflict of interest.
Additional information
Funding
References
- Vignoli, J. A.; Bassoli, D. G.; Benassi, M. T. Antioxidant Activity, Polyphenols, Caffeine and Melanoidins in Soluble Coffee : The Influence of Processing Conditions and Raw Material. Food Chem. 2011, 124, 863–868. DOI: 10.1016/j.foodchem.2010.07.008.
- Hečimović, I.; Belščak-Cvitanović, A.; Horžić, D.; Komes, D. Comparative Study of Polyphenols and Caffeine in Different Coffee Varieties Affected by the Degree of Roasting. Food Chem. 2011, 129, 991–1000. DOI: 10.1016/j.foodchem.2011.05.059.
- Vignoli, J. A.; Viegas, M. C.; Bassoli, D. G.; Benassi, M. D. T. Roasting Process Affects Differently the Bioactive Compounds and the Antioxidant Activity of Arabica and Robusta Coffees. Food Res. Int. 2014, 61, 279–285. DOI: 10.1016/j.foodres.2013.06.006.
- Herawati, D.; Giriwono, P. E.; Dewi, F. N. A.; Kashiwagi, T.; Andarwulan, N. Critical Roasting Level Determines Bioactive Content and Antioxidant Activity of Robusta Coffee Beans. Food Sci. Biotechnol. 2019, 28, 7–14. DOI: 10.1007/s10068-018-0442-x.
- Gloess, A. N.; Vietri, A.; Wieland, F.; Smrke, S.; Schönbächler, B.; López, J. A. S.; Petrozzi, S.; Bongers, S.; Koziorowski, T.; Yeretzian, C. Evidence of Different Flavour Formation Dynamics by Roasting Coffee from Different Origins: On-Line Analysis with PTR-ToF-MS. Int. J. Mass Spectrom. 2014, 365–366, 324–337. DOI: 10.1016/j.ijms.2014.02.010.
- Fadai, N. T.; Melrose, J.; Please, C. P.; Schulman, A.; Van Gorder, R. A.; Heat, A. Mass Transfer Study of Coffee Bean Roasting. Int. J. Heat Mass Transf. 2017, 104, 787–799. DOI: 10.1016/j.ijheatmasstransfer.2016.08.083.
- Jeszka-Skowron, M.; Stanisz, E.; De Peña, M. P. Relationship between Antioxidant Capacity, Chlorogenic Acids and Elemental Composition of Green Coffee. LWT - Food Sci. Technol. 2016, 73, 243–250. DOI: 10.1016/j.lwt.2016.06.018.
- Jeszka-Skowron, M.; Zgoła-Grześkowiak, A.; Grześkowiak, T. Analytical Methods Applied for the Characterization and the Determination of Bioactive Compounds in Coffee. Eur. Food Res. Technol. 2014, 240, 19–31. DOI: 10.1007/s00217-014-2356-z.
- Fujioka, K.; Shibamoto, T. Chlorogenic Acid and Caffeine Contents in Various Commercial Brewed Coffees. Food Chem. 2008, 106, 217–221. DOI: 10.1016/j.foodchem.2007.05.091.
- Zhang, Z.; Hu, G.; Caballero, B. Habitual Coffee Consumption and Risk of Hypertension: A Systematic Review and Meta-Analysis of Prospective Observational Studies. Am. J. Clin. Nutr. 2011, 93, 1–8. DOI: 10.3945/ajcn.110.004044.
- Sarriá, B.; Martínez-López, S.; Mateos, R.; Bravo-Clemente, L. Long-Term Consumption of a Green/Roasted Coffee Blend Positively Affects Glucose Metabolism and Insulin Resistance in Humans. Food Res. Int. 2016, 89, 1023–1028. DOI: 10.1016/j.foodres.2015.12.032.
- Ding, M.; Bhupathiraju, S. N.; Chen, M.; Van Dam, R. M.; Hu, F. B. Caffeinated and Decaffeinated Coffee Consumption and Risk of Type 2 Diabetes: A Systematicreview and A Dose-Response Meta-Analysis. Diabetes Care. 2014, 37, 569–586. DOI: 10.2337/dc13-1203.
- Fernandez-Gomez, B.; Lezama, A.; Amigo-Benavent, M.; Ullate, M.; Herrero, M.; Martín, M. Á.; Mesa, M. D.; Del Castillo, M. D. Insights on the Health Benefits of the Bioactive Compounds of Coffee Silverskin Extract. J. Funct. Foods. 2016, 25, 197–207. DOI: 10.1016/j.jff.2016.06.001.
- Singh, K.; Kafka, A.; Kang, B. H.; Goundra, R.; Kwon, Y. I.; Apostolidis, E. In Vitro Evaluation and Determination of Responsible Fraction of Coffee Beans and Dried Sugar Beet Leaves for Alpha-Glucosidase Inhibition. Int. J. Appl. Res. Nat. Prod. 2014, 7, 15–20.
- Zhang, L.; Tu, Z. C.; Yuan, T.; Wang, H.; Xie, X.; Fu, Z. F. Antioxidants and α-Glucosidase Inhibitors from Ipomoea Batatas Leaves Identified by Bioassay-Guided Approach and Structure-Activity Relationships. Food Chem. 2016, 208, 61–67. DOI: 10.1016/j.foodchem.2016.03.079.
- Uribarri, J.; Dolores, M.; Pía, M.; Maza, D.; Filip, R.; Gugliucci, A.; Luevano-, C.; Macías-Cervantes, M. H.; Bastos, D. H. M.; Medrano, A.;; et al. Dietary Advanced Glycation End Products and Their Role in Health and Disease. Adv. Nutr. 2015, 6, 461–473. DOI: 10.3945/an.115.008433.
- Francini, F.; Schinella, G. R. Natural Products for the Treatment of Type 2 Diabetes Mellitus. Planta Med. 2015, 81, 975–994. DOI: 10.1055/s-0035-1546131.
- Asgar, M. A.;. Anti-Diabetic Potential of Phenolic Compounds : A Review. Int. J. Food Prof. 2013, 16, 91–103. DOI: 10.1080/10942912.2011.595864.
- Yan, S.; Shao, H.; Zhou, Z.; Wang, Q.; Zhao, L.; Yang, X. Non-Extractable Polyphenols of Green Tea and Their Antioxidant, Anti-α-Glucosidase Capacity, and Release during in Vitro Digestion. J. Funct. Foods. 2018, 42, 129–136. DOI: 10.1016/j.jff.2018.01.006.
- Pellegrini, N.; Serafini, M.; Colombi, B.; Del Rio, D.; Salvatore, S.; Bianchi, M.; Brighenti, F. Total Antioxidant Capacity of Plant Foods, Beverages and Oils Consumed in Italy Assessed by Three Different in Vitro Assays. J. Nutr. 2003, 133, 2812–2819. DOI: 10.1093/jn/133.8.2622.
- Suda, I.; Oki, T.; Nishiba, Y.; Masuda, M.; Kobayashi, M.; Nagai, S.; Hiyane, R.; Miyashige, T. Polyphenol Contents and Radical-Scavenging Activity of Extracts from Fruits and Vegetables in Cultivated in Okinawa, Japan. Nippon Shokuhin Kagaku Kogaku Kaishi. 2005, 52, 462–471. DOI: 10.3136/nskkk.52.462.
- Watanabe, J.; Oki, T.; Takebayashi, J.; Yamasaki, K.; Takano-Ishikawa, Y.; Hino, A.; Yasui, A. Method Validation by Interlaboratory Studies of Improved Hydrophilic Oxygen Radical Absorbance Capacity Methods for the Determination of Antioxidant Capacities of Antioxidant Solutions and Food Extracts. Anal. Sci. 2012, 28, 159–165.
- Lavelli, V.; Corey, M.; Kerr, W.; Vantaggi, C. Stability and Anti-Glycation Properties of Intermediate Moisture Apple Products Fortified with Green Tea. Food Chem. 2011, 127, 589–595. DOI: 10.1016/j.foodchem.2011.01.047.
- Kim, S. D.;. Α-Glucosidase Inhibitor Isolated From Coffee. J. Microbiol. Biotechnol. 2015, 25, 174–177. DOI: 10.4014/jmb.1411.11057.
- Corso, M. P.; Vignoli, J. A.; Benassi, M. D. T. Development of an Instant Coffee Enriched with Chlorogenic Acids. J. Food Sci. Technol. 2016, 53, 1380–1388. DOI: 10.1007/s13197-015-2163-y.
- Ludwig, I. A.; Sanchez, L.; Caemmerer, B.; Kroh, L. W.; De Peña, M. P.; Cid, C. Extraction of Coffee Antioxidants: Impact of Brewing Time and Method. Food Res. Int. 2012, 48, 57–64. DOI: 10.1016/j.foodres.2012.02.023.
- Edwards, Q. A.; Lunat, I.; Neale, L. D. G.; Kulikov, S. M. Distribution of Caffeine between Selected Water-Organic Solvent Media. Int. J. Chem. Sci. 2015, 13(3), 1218–1226.
- Bartel, C.; Mesias, M.; Morales, F. J. Investigation on the Extractability of Melanoidins in Portioned Espresso Coffee. Food Res. Int. 2015, 67, 356–365. DOI: 10.1016/j.foodres.2014.11.053.
- Grajeda-Iglesias, C.; Salas, E.; Barouh, N.; Baréa, B.; Panya, A.; Figueroa-Espinoza, M. C. Antioxidant Activity of Protocatechuates Evaluated by DPPH, ORAC, and CAT Methods. Food Chem. 2016, 194, 749–757. DOI: 10.1016/j.foodchem.2015.07.119.
- Mesías, M.; Navarro, M.; Martínez-Saez, N.; Ullate, M.; Del Castillo, M. D.; Morales, F. J. Antiglycative and Carbonyl Trapping Properties of the Water Soluble Fraction of Coffee Silverskin. Food Res. Int. 2014, 62, 1120–1126. DOI: 10.1016/j.foodres.2014.05.058.
- Ludwig, I. A.; Sánchez, L.; De Peña, M. P.; Cid, C. Contribution of Volatile Compounds to the Antioxidant Capacity of Coffee. Food Res. Int. 2014, 61, 67–74. DOI: 10.1016/j.foodres.2014.03.045.
- Brezová, V.; Šlebodová, A.; Staško, A. Coffee as a Source of Antioxidants: An EPR Study. Food Chem. 2009, 114, 859–868. DOI: 10.1016/j.foodchem.2008.10.025.
- Anesini, C.; Turner, S.; Cogoi, L.; Filip, R. Study of the Participation of Caffeine and Polyphenols on the Overall Antioxidant Activity of Mate (Ilex Paraguariensis). LWT - Food Sci. Technol. 2012, 45, 299–304. DOI: 10.1016/j.lwt.2011.06.015.
- Xu, H.; Wang, W.; Liu, X.; Yuan, F.; Gao, Y. Antioxidative Phenolics Obtained from Spent Coffee Grounds (Coffea Arabica L.) By Subcritical Water Extraction. Ind. Crops Prod. 2015, 76, 946–954. DOI: 10.1016/j.indcrop.2015.07.054.
- Pérez-Hernández, L. M.; Chávez-Quiroz, K.; Medina-Juárez, L. Á.; Gámez Meza, N. Phenolic Characterization, Melanoidins, and Antioxidant Activity of Some Commercial Coffees from Coffea Arabica and Coffea Canephora. J. Mex. Chem. Soc. 2012, 56(4), 430–435.
- Jaiswal, R.; Müller, H.; Müller, A.; Karar, M. G. E.; Kuhnert, N. Identification and Characterization of Chlorogenic Acids, Chlorogenic Acid Glycosides and Flavonoids from Lonicera Henryi L. (Caprifoliaceae) Leaves by LC-MSn. Phytochemistry. 2014, 108, 252–263. DOI: 10.1016/j.phytochem.2014.08.023.
- Mills, C. E.; Oruna-Concha, M. J.; Mottram, D. S.; Gibson, G. R.; Spencer, J. P. E. The Effect of Processing on Chlorogenic Acid Content of Commercially Available Coffee. Food Chem. 2013, 141, 3335–3340. DOI: 10.1016/j.foodchem.2013.06.014.
- Suárez-Quiroz, M. L.; Campos, A. A.; Alfaro, G. V.; Ríos-Gonzáles, O.; Villeneuve, P.; Figueroa-Espinoza, M. C. Journal of Food Composition and Analysis Isolation of Green Coffee Chlorogenic Acids Using Activated Carbon. Food Compos. Anal. 2014, 33, 55–58. DOI: 10.1016/j.jfca.2013.10.005.
- Rodrigues, N. P.; Bragagnolo, N. Identification and Quantification of Bioactive Compounds in Coffee Brews by HPLC-DAD-MSn. J. Food Compos. Anal. 2013, 32, 105–115. DOI: 10.1016/j.jfca.2013.09.002.
- Alongi, M.; Anese, M. Effect of Coff Ee Roasting on in Vitro α -Glucosidase Activity : Inhibition and Mechanism of Action. Food Res. Int. 2018, 111, 480–487. DOI: 10.1016/j.foodres.2018.05.061.
- Ishikawa, A.; Yamashita, H.; Hiemori, M.; Inagaki, E.; Kimoto, M.; Okamoto, M.; Tsuji, H.; Memon, A. N.; Mohammadi, A.; Natori, Y. Characterization of Inhibitors of Postprandial Hyperglycemia from the Leaves of Nerium Indicum. J. Nutr. Sci. Vitaminol. (Tokyo). 2007, 53, 166–173. DOI: 10.3177/jnsv.53.166.
- Świeca, M.; Gawlik-Dziki, U.; Dziki, D.; Baraniak, B. Wheat Bread Enriched with Green Coffee – In Vitro Bioaccessibility and Bioavailability of Phenolics and Antioxidant Activity. Food Chem. 2017, 221, 1451–1457. DOI: 10.1016/j.foodchem.2016.11.006.
- Farah, A.; Monteiro, M.; Donangelo, C. M.; Lafay, S. Chlorogenic Acids from Green Coffee Extract are Highly Bioavailable in Humans. J. Nutr. 2008, 138, 2309–2315. DOI: 10.3945/jn.108.095554.