
ABSTRACT
This study proposed a method using hyper-spectral imaging technology in determining eggs’ quality in term of freshness from a biochemical perspective by estimating the S-ovalbumin content. This method has the potential in assessing eggs’ quality rapidly and non-destructively. Hyper-spectral image of egg was captured using a hyper-spectral imaging system and regression model was built to estimate the S-ovalbumin content. The successive projections algorithm (SPA) was used to select significant wavebands followed by building a partial least squares regression (PLSR) model and a multiple linear regression (MLR) model. The MLR model could predict S-ovalbumin content better than PLSR model with a higher correlation coefficient (0.922) and lower root mean square error (0.086) of the calibration set, a higher correlation coefficient (0.911) and lower root mean square error (0.119) of the validation set, and a higher residual predictive deviation (2.348). The regression equation from the MLR model was used to compute each pixel of the image in the validation set and visualisation of S-ovalbumin content distribution in the egg was obtained using pseudo-color image. The findings implied that the proposed hyper-spectral imaging system with the regression model developed has the potential in determining and visualising the eggs’ quality.
Introduction
Eggs are one of the most important food in daily life due to its rich nutrition, which contains high protein. Egg quality changes during storage is complex, which include increasing egg weight loss rate, changing pH, and protein content.[Citation1] Hence, evaluating and predicting egg quality during storage period is critical in food processing and preservation. At present, non-destructive testing methods for evaluating egg freshness are mainly focus on the external quality of eggs, such as weight and egg-shaped index, and the changes of basic physical and chemical indicators, for instance, nitrogen content and moisture.[Citation2] The performance of these methods is limited to the various changes of each individual egg. Meanwhile, there are few methods proposed to evaluate egg freshness in its biological properties.
S-ovalbumin is a biological properties that converted from ovalbumin (the most abundant protein found in eggs, accounting for 54–63% of total egg white protein when an egg is first laid).[Citation3] This conversion is irreversible during storage time and does not depend on factors such as age, nutritional status, and weight except for pH and temperature.[Citation4] Therefore, S-ovalbumin correlates highly with storage time with low natural variability and has the potential to become a commonly used indicator to evaluate egg freshness.
The current biochemical method to measure S-ovalbumin content is through chemical analysis, which is time-consuming. This method is not feasible for rapid detection of every single egg in the factory/market since it requires the breaking of eggs for chemical analysis. Therefore, developing a rapid, non-destructive, and accurate method to predict S-ovalbumin content is necessary. Various non-destructive approaches commonly used are machine vision,[Citation5] near-infrared spectroscopy,[Citation6–Citation8] and hyper-spectral imaging technology.[Citation9,Citation10] Machine vision reflects the spatial attributes and distribution properties of the detected object,[Citation11] while near-infrared spectroscopy estimates its physical and chemical values. Hyper-spectral imaging technology has the advantages of both spectral detection and machine vision techniques.[Citation12] It has been used successfully to assess the quality of different agricultural products, for instance, internal and external quality parameters of eggs,[Citation13] moisture content of salmon,[Citation14] and maturity of winter jujube.[Citation15] However, few studies have been addressed in using hyper-spectral imaging technology to develop a prediction model to a specific protein content in egg whites.[Citation16]
In this paper, we presented a study of using hyper-spectral imaging technology to assess the S-ovalbumin content in egg whites. The objectives of this study were to: (1) determine the characteristic band in estimating the content of S-ovalbumin in egg whites, (2) develop a non-destructive prediction model, and (3) visualise the S-ovalbumin content using the established model.
Materials and methods
Experimental sample
A total of 108 brown chicken eggs were obtained on their lay date from a farm in Jiu Feng Mountain in Wuhan, Hubei Province, China. The eggs were stored in an incubator (SPX intelligent biochemical incubator [Ningbo Jiangnan Instrument Factory]) at 22 ± 1°C with a relative humidity of 65%. Twelve eggs were randomly selected and numbered sequentially every 5 days, i.e., on days 1, 6, 11, 16, 21, 26, 31, 36, and 41.
Hyper-spectral imaging data acquisition and calibration
A Zolix Hyper SIS-VNIR-CL transmission spectrum image acquisition device system (Ocean Optics Company, Shanghai, China) was used to obtain the hyper-spectral images of the egg (). The main components of this system consist of a hyper-spectral imager, a computer, a transmission light source box, and a data acquisition software (SpectraSENS, Zolix Instruments CO., Ltd). The hyper-spectral imager is composed of a self-manufactured hyper-spectral spectrometer (wavelength range of 300–1100 nm with 520 spectral bands at 1.25 nm wavelength interval), a light source, a switch, a charge coupled device (CCD) camera, and a screw-type mobile platform.
Figure 1. Schematic diagram of transmission spectrum image acquisition device, 1: Computer, 2: USB line, 3: High spectrometer, 4: CCD camera, 5: Compact black box, 6: Egg, 7: Light box, 8: Mobile platform, and 9: Light
A small circular hole was cut at the upper part of the light source box to place the egg vertically with the blunt end facing up. During the data collection, the transmitting light from the light source box passed through the egg and the egg image was captured by the hyper-spectral imaging system using the CCD camera with a 0.15-s exposure time. Each image size was 1394 × 1024 pixels with spectral resolution of 2.8 nm. There was no any leakage of transmitted light from the light source box during the data collection. The mobile platform was moved at a rate of 1.7 mm/s within a moving distance of 80 mm when each egg was placed on it.
The hyper-spectral imager was calibrated prior data collection[Citation17] to remove the noise in the image due to the influence of dark current and other external factors. The camera lens was covered by a cap to obtain a black calibration image (D) (with 0% transmittance); a standard white board was placed under the CCD camera to obtain a white calibration image (W) (with 99% transmittance). The raw hyper-spectral transmission image (I) was obtained by placing the egg directly above the transmitted light source. The calibrated egg image (A) was calculated by:
A =(I-D) / (W-D)
The hyper-spectral images collected were imported into the ENVI 4.7 and MATLAB 2016a software for processing.
S-ovalbumin content determination (chemical analysis)
The steps to measure S-ovalbumin content with broken eggs were as follows.
(i) Egg whites of each egg were separated and then placed in fifteen 100-mL small beakers (numbered 1–12). Each of them was stirred using a the magnetic stirrer at 4°C. (ii) A total of 5 ± 0.05 g of egg whites was then poured into another fifteen 100-mL beakers (numbered 13–24) and 25 mL of phosphate buffer at pH 7.5 was added to each tiny beaker. The solution was stirred using the magnetic stirrer for 5 min. (iii) For each egg, 5 mL of the mixed solution was pipetted into two 20-mL glass sealed test tubes labeled as iA, iB, where i is the egg number. The test tube (iA) was placed in a water bath pot at 75°C for 30 min and allow to cool down. (iv) A tolal of 5 mL of precipitator was added to the test tubes (iA and iB) to mix up with the solution and was poured into centrifuge tubes. (v) A total of 5 mL of precipitator was then added to each test tube to rinse its inner wall, and the liquid in the test tubes transferred to the corresponding centrifuge tubes. (vi) After standing for 10 min, the mixture was centrifuged for 5 min at 12,000 rpm speed. (vii) A total of 2 mL of the supernatant drawn from the top of each centrifuge tube was pipetted into 10-mL centrifuge tube, and 4 mL of the biuret solution was added to each centrifuge tube and allow to stand for about 30 min at room temperature. (viii) The absorbance at 540 nm (ODheated, ODunheated) of each sample was measured by an ultraviolet spectrophotometer. The blank control sample was a mixture of 2 mL of deionised water and 4 mL of biuret solution. S-ovalbumin content was calculated according to the formula in EquationEq. (2)(2) .[Citation18]
Acquisition of spectral data
A 3D hyper-spectral cube with spatial dimensions of pixels and spectral dimension of 520 wavelengths was obtained for each sample. The region of entire egg was selected manually as the region of interest (ROI) using ENVI 4.7 software. The raw spectrum of each sample was the average spectrum extracted from the ROI. There were noise signals at both ends of the spectrum, hence, only the range of 450–1000 nm wavelength was selected to predict the S-ovalbumin content.
Spectral preprocessing and sample partitioning
The raw spectrum were preprocessed using min-max normalisation to ease subsequent data processing. The min-max normalisation converts the raw data to the range of 0–1 through the linearisation method. This method enables the raw data to have proportional scaling to eliminate the influence of dimension and order of magnitude. Two-thirds of the samples were selected using the joint x-y distance (SPXY) method for modelling, and the remaining samples were held for the validation. The SPXY method can effectively cover multidimensional vector space. The spectral data variables and the S-ovalbumin content variable were both considered when calculating the sample spacing.[Citation19]
shows the statistics of the sample set divided by the SPXY algorithm. It showed that the maximum, average, and standard deviation of the calibration set and the validation set are only slightly different from the total samples, indicating that the selected samples for calibration and validation are well representatives. They could be used to substitute the total samples for modelling and validation.
Table 1. Sample set of S-ovalbumin content
Characteristic wavelength filtering algorithm
Successive projections algorithm (SPA) was used to select the important bands related to S-ovalbumin content and eliminate non-significant bands to simplify the model. SPA is a forward-loop-selecting method which can minimise vector space collinearity.[Citation20] Assuming that the spectral matrix is , where n is the number of samples, p is the number of wavelengths. In order to select the optimal bands, the value of kth column in spectral matrix of training set was assigned to
before the first iteration (n = 1). Suppose S is a set of all wavelength variables that are not selected.
The projection of the remaining column vector and the currently selected vector were calculated, the wavelength position with the largest projection norm is then recorded.
Let n equal to n + 1. If n is less than p, the loop calculation will restart to select the next wavelength vector. Variables in each subset were used to establish the multiple linear regression (MLR) model. The subset with the smallest root mean square error (RMSE) was selected followed by stepwise regression modelling was performed. Under the premise of not losing accuracy as much as possible, a set with fewer variables was obtained. Bands in this set were the optimal wavelengths finally selected.
Model establishment and evaluation
MATLAB2016a and SPSS12.0 software were used to perform the partial least squares regression (PLSR) and multiple linear regression (MLR) models. The main steps of PLS regression analysis include data dimensionality reduction, information synthesis, and screening,[Citation21] as well as avoiding multiple correlations between variables. Meanwhile, the MLR model accurately reflects the linear relationship between the spectral data and the S-ovalbumin content.[Citation22]
The correlation coefficient of cross validation (RC), RMSE of cross validation (RMSEC), correlation coefficient of prediction (RP), and RMSE of prediction (RMSEP) were used to evaluate performance of the model. The best prediction model had the highest correlation coefficients and the smallest RMSE, indicating greater model stability and degree of fit. In addition, residual predictive deviation (RPD) in the validation set were evaluated to compare the performance of the models. The RPD is the ratio of the standard deviation (SD) of the measured values over the RMSEP. The larger the RPD, the better the model. A RPD of less than 1.5 indicates the prediction ability of this model is very poor and the S-ovalbumin content cannot be estimated. A RPD between 1.5 and 2.0 illustrates the model can roughly estimates the S-ovalbumin content while a RPD of greater than 2.0 indicating the model can predict S-ovalbumin content very well.[Citation23]
Results and discussion
Changes in S-ovalbumin content during storage
The S-ovalbumin content of 108 eggs increased during storage (), corresponding to the reduction in egg freshness.[Citation24] Correlation analysis between S-ovalbumin content and storage time showed that they were significantly positive correlated (R2 = 0.954, p ≤ .01), natural ovalbumin (N-ovalbumin) was irreversibly converted to a thermostable form (S-ovalbumin) when the eggs are stored at room temperature. S-ovalbumin is a configurational isomer of N-ovalbumin, in the process of S-configuration transformation, its molecular properties and physical and chemical properties changed accordingly.[Citation4] Therefore, an increase in S-ovalbumin content indicates a decrease in egg freshness in long storage time.
Figure 2. The regularity of S-ovalbumin content change with day
Spectral pretreatment
There are too many modelling variables whether or not the raw spectrum is preprocessed, so the PLSR models were built based on the full spectrum. The spectral pretreatment methods such as savitzky-golay smoothing (SG), first derivatives (FD), second derivatives (SD), standard normal variate (SNV), multiple scattering correction (MSC), and min-max normalisation were investigated in order to gain the optimal conditions of the calibration model for S-ovalbumin content. It was found that min-max normalisation achieved best prediction ability with RPD of 2.224 (). The process of spectral pretreatment is significant because it reduces noise that can affect the physical properties such as the baseline drift.[Citation25]
Table 2. Modelling effect of S-ovalbumin protein content in different calibration models
Extraction of characteristic wavelengths
SPA was used to extract feature bands () by assessing the change of RMSE to select the optimal model. As indicated in , the RMSE value decreased rapidly when the number of variable was less than 12. The RMSE value stabilised with increasing number of bands afterwards since the insignificant bands in the model were constantly removed. Therefore, the number of characteristic band variables selected is 12 ().
Figure 3. SPA extraction of characteristic wavelengths: (a) changes in RMSE in the model and (b) optimal characteristic wavelength selected by SPA
The selected 12 bands as presented in were from the sensitive wavelengths between 620–760 nm and 900–1000 nm. These included the visible range wavelength in illustrating the eggs’ external qualities such as eggshell color, eggshell thickness, and size. Although previous studies had shown that egg shape parameter (long axis, short axis, parting dimension, and color component) have low correlation with S-ovalbumin content, they still contribute in building the prediction models as indicated in this study. The sensitive bands of egg freshness values (Haugh Unit) are concentrated on 620–760 nm.[Citation26] Haugh unit (HU) is calculated based on egg weight and albumen height. Our previous studies had shown that there was very low correlation between S-ovalbumin content with egg weight but very high correlation with albumin height.[Citation27] One of the reasons for the albumin height variation is the S-configuration of ovalbumin. The sensitive bands in the near infrared range are related to the frequency and multiple frequency of the C-H group and the frequency doubling of the O-H group.
Table 3. The optimal wavelength combinations based on the SPA method
Establishment and analysis of model
The selected 12 characteristic bands were served as the input variable (X) while S-ovalbumin content value was used as the output variable (Y) to build the model. showed the result output from the PLSR and MLR models. The MLR model had higher RC and RP values as well as lower RMSEC value than that of PLSR model, indicating MLR model performed better than PLSR model. Besides, the RPD value of MLR model was greater than 2, indicating it could estimate the S-ovalbumin content very well. Hence, MLR model was chosen as the prediction model () with the equation as below:
Table 4. Model effect of S-oval protein content based on characteristic wavelength
Figure 4. Correlation between measured and predicted values of S-ovalbumin content
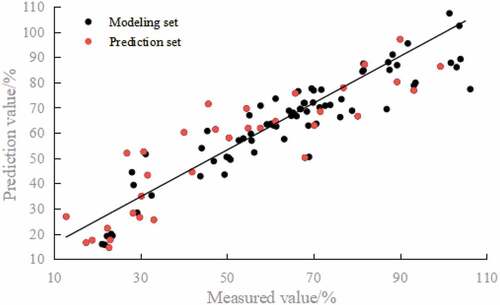
where Y represents the S-ovalbumin content value in egg white and λi represents the spectral transmittance corresponding to wavelength i. EquationEquation (5)(5) can be used to calculate the S-ovalbumin content value of each pixel of the egg hyper-spectral image. Pearson correlation analysis between the measured value and the predicted value of the S-ovalbumin content was performed using SPSS and demonstrated that they were significantly correlated (p ≤ .01).
Visualisation of S-ovalbumin content in egg white
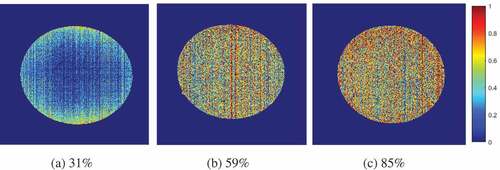
The original image in the validation set was subjected to the maximum and minimum normalisation processing using ENVI 4.7 and EquationEq. (5)(5) was used to compute each pixel of the image. A visual distribution image of egg S-ovalbumin content using pseudo colors was obtained using MATLAB 2016a software as demonstrated in . Three predicted egg samples were demonstrated with different average S-ovalbumin content: 31% (), 59% (), and 85% (). The color gradient from blue to red represents a gradual increase in S-ovalbumin content, with different colors represent different S-ovalbumin concentrations. The more bluish image indicating the lower S-ovalbumin content and therefore the fresher the egg. On the other hand, the more reddish image representing higher S-ovalbumin content and the less fresh the egg. These images would provide a quick visualisation to evaluate egg freshness and quality non-destructively.
Figure 5. Visualisation of S-ovalbumin content distribution in three egg samples
Conclusion
As a conclusion, visible-near-infrared (300–1100 nm) hyper-spectral imaging technology as proposed in this study is able to detect and visualise the S-ovalbumin content in egg whites rapidly and non-destructively. It provides an alternative method to solve the shortcomings of biochemical analysis. The results indicated that the content of S-ovalbumin increases with increasing storage time (R2 = 0.954, p ≤ .01), indicating the higher the S-ovalbumin content, the less fresh the egg. The MLR model using the characteristic wavelength extracted by the SPA performed better than PLSR model in estimating S-ovalbumin content with a higher accuracy. The MLR model had RP = .911 and RPD = 2.348 (higher than 2.0), suggesting that it was reliable in S-ovalbumin content prediction. The S-ovalbumin content value of each pixel on the egg image could be calculated using the MLR regression equation and the S-ovalbumin content distribution could be visualised using pseudo-color image. Some of the selected significant bands were in the range of 620–760 nm, which were used by Haugh Unit (HU), the common grading standard of eggs’ freshness. This indicated that our model has the potential to be an alternative grading standard of eggs’ freshness by estimating its S-ovalbumin content. The biochemical changes of S-ovalbumin content of different egg varieties are similar and hence, the growth rate of eggs in different varieties during storage were similar. This implies that our model and image visualisation are potential in predicting the protein content of other egg varieties in a quick and non-destructive way. More researches will be conducted in the future to verify this implication and improve the existing model.
Acknowledgments
The authors gratefully acknowledge the Program of the National Natural Science Foundation of China (31871863), the Special Scientific Research Fund of Agricultural Public Welfare Profession Project of China (201303084) and the National Science and Technology Major Project of the Ministry of Science and Technology of China during the 12th Five-year Plan Period (2015BAD19B05). Dandan Fu declares no conflict of interest. Qiaohua Wang declares no conflict of interest. Meihu Ma declares no conflict of interest. Yixiao Ma declares no conflict of interest.
Additional information
Funding
References
- Nematinia, E.; Mehdizadeh, S. A. Assessment of Egg Freshness by Prediction of Haugh Unit and Albumen pH Using an Artificial Neural Network. J. Food Meas. Charact. 2018, (3), 1–11.
- Abdel, N. N.; Ngadi, M.; Prasher, S.; Karimi, Y. Prediction of Egg Freshness and Albumen Quality Using Visible/Near Infrared Spectroscopy. Food Bioprocess Technol. 2011, 4(5), 731–736. DOI: 10.1007/s11947-009-0265-0.
- Fu, D. D.; Wang, Q. H. Predictive Models for the Detection of Egg Freshness, Acidity and Viscosity Using Hyper-Spectral Imaging. Food Sci. 2016, 37(22), 173–179.
- Huang, Q.; Qiu, N.; Ma, M. H.; Jin, Y. G.; Yang, H.; Geng, F.; Sun, S. G.; Sun, S. H. Estimation of Egg Freshness Using S-Ovalbumin as an Indicator. Poultr. Sci. 2012, 91(3), 739–743. DOI: 10.3382/ps.2011-01639.
- Sun, L.; Yuan, L. M.; Cai, J. R.; Lin, H.; Zhao, J.-W. Egg Freshness on-Line Estimation Using Machine Vision and Dynamic Weighing. Food Anal. Methods. 2015, 8(4), 922–928. DOI: 10.1007/s12161-014-9944-1.
- Duan, Y. F.; Wang, Q. H.; Ma, M. H. Study on Non-Destructive Detection Method for Egg Freshness Based on LLE-SVR and Visible/Near-Inf Rared Spectrum. Spectrosc. Spectral Anal. 2016, 36(4), 981–985.
- Wu X.H, Wu B, Sun J, Li, M., Du, H. Discrimination of Apples Using near Infrared Spectroscopy and Sorting Discriminant Analysis. Int. J. Food Prop. 2016, 19(5), 1016–1028.
- Rahman, A.; Faqeerzada, M. A.; Cho, B. K. Hyperspectral Imaging for Predicting the Allicin and Soluble Solid Content of Garlic with Variable Selection Algorithms and Chemometric Models. J. Sci. Food Agric. 2018, 98(12), 4715–4725. DOI: 10.1002/jsfa.9006.
- Li, X. L.; Wei, Y. Z.; Xu, J.; Feng, X.; Wu, F.; Zhou, R.; Jin, J.; Xu, K.; Yu, X.; He, Y. SSC and pH for Sweet Assessment and Maturity Classification of Harvested Cherry Fruit Based on NIR Hyperspectral Imaging Technology. Postharvest Biol. Technol. 2018, 143, 112–118. DOI: 10.1016/j.postharvbio.2018.05.003.
- Kaewkarn, P.; Te, M.; Tetsuya, I.; Tsuchikawa, S.; Terdwongworakul, A. Near-Infrared Hyperspectral Imaging for Classification of Mung Bean Seeds. Int. J. Food Prop. 2018, 21, 799–807. DOI: 10.1080/10942912.2018.1476378.
- Xu Y.C; Wang X.Y; Yin X; Hu Z.X; Yue R.C. Visualization Spatial Assessment of Potato Dry Matter. Trans. Chin. Soc. Agric. Mach. 2018, 2, 339–344.
- Sun, Y.; Liu, Y.; Yu, H.; Xie, A.; Li, X.; Yin, Y.; Duan, X. Non-Destructive Prediction of Moisture Content and Freezable Water Content of Purple-Fleshed Sweet Potato Slices during Drying Process Using Hyperspectral Imaging Technique. Food Anal. Methods. 2017, 10(5), 1535–1546. DOI: 10.1007/s12161-016-0722-0.
- Suktanarak, S.; Teerachaichayut, S. Non-Destructive Quality Assessment of Hens’ Eggs Using Hyperspectral Images. J. Food Eng. 2017, 215, 97–103. DOI: 10.1016/j.jfoodeng.2017.07.008.
- Zhan, B. S.; Zhang, H. L.; Yang, J. G. Visualization of the Water Content for Salmon Fish Fillets Based on Hyperspectral Imaging Technique. Spectrosc. Spectral Anal. 2017, 37(4), 1232–1236.
- Cao X.F; Ren H.R; Li X.Z; Yu K.Q. Discrimination of Winter Jujube’s Maturity Using Hyperspectral Technique Combined with Characteristic Wavelength and Spectral Indices. Spectrosc. Spectral Anal. 2018, 38(7), 2175–2182.
- Wu, J. H.; Huang, J. Non-Destructive Detection of Protein Content in Fresh Eggs by Visible/Near-Infrared Reflectance Spectroscopy. Mod. Food Sci. Technol. 2015, 31(5), 285–290.
- Zhu, Z. H.; Liu, T.; Ma, M. H. Hatching Eggs Nondestructive Detection Based on Hyperspectral-Imaging Information and RVM. Trans. Chin. Soc. Agric. Eng. 2015, 31(15), 285–292.
- Huang Q; Ma M.H; Jin Y.G; Qiu N; Sun S.G; Geng F. Effect of Storage Condition on S-Ovalbumin Formation in Albumen. Trans. Chin. Soc. Agric. Eng. 2012, 28(5), 288–292.
- Zhan, X. R.; Zhu, X. R.; Shi, X. Y.; Zhang, Z.-Y.; Qiao, Y.-J. Determination of Hesperidin in Spectroscopy with SPXY Algorithm Monte Carlo Cross Validation Tangerine Leaf by Near-Infrared for Sample Subset Partitioning. Spectrosc. Spectral Anal. 2009, 29(4), 964–968.
- Mesquita, D. P. P.; Gomes, J. P.; Rodrigues, L. R.; Oliveira, S. A. F.; Galvão, R. K. H. Building Selective Ensembles of Randomization Based Neural Networks with the Successive Projections Algorithm. Appl. Soft Comput. 2018, 70, 1135–1145. DOI: 10.1016/j.asoc.2017.08.007.
- Feng, C. H.; Makino, Y.; Yoshimura, M.; Rodríguez-Pulido, F. J. Estimation of Adenosine Triphosphate Content in Ready-To-Eat Sausages with Different Storage Days, Using Hyperspectral Imaging Coupled with R statistics. Food Chem. 2018, 264, 419–426. DOI: 10.1016/j.foodchem.2018.05.029.
- Sameer, A.; Ashok, K. K. Estimation of Re-Aeration Coefficient Using MLR for Modelling Water Quality of Rivers in Urban environment. Groundwater Sustainable Dev. 2018, 7, 430–435. DOI: 10.1016/j.gsd.2017.11.006.
- Askari, M. S.; Cui, J.; O’Rourke, S. M.; Holden, N. M. Evaluation of Soil Structural Quality Using VIS–NIR spectra. Soil Tillage Res. 2015, 146, 108–117. DOI: 10.1016/j.still.2014.03.006.
- Mikail, B.; Sibel, C.; Tugay, A.; Copur, G. Effects of Dietary Selenium Source, Storage Time, and Temperature on the Quality of Quail Eggs. Biol. Trace Elem. Res. 2011, 143(2), 957–964. DOI: 10.1007/s12011-010-8912-x.
- Sineenart, S.; Sontisuk, T. Non-Destructive Quality Assessment of Hens’ Eggs Using Hyperspectral Images. J. Food Eng. 2017, 215, 97–103.
- Zhang W, Pan L.Q, Tu S.C, Zhan, Ge, Tu, K. Non-Destructive Internal Quality Assessment of Eggs Using a Synthesis of Hyperspectral Imaging and Multivariate Analysis. J. Food Eng. 2015, 157, 41–48. DOI: 10.1016/j.jfoodeng.2015.02.013.
- Fu, D. D.; Wang, Q. H.; Ma, M. H.; Ma, Y. X.; Wang, B. Non-Destructive Prediction Modeling of S-Ovalbumin Content in Stored Eggs Based on Hyperspectral Fusion Information. J. Food Process Eng. 2019, 42(3), 1–10. DOI: 10.1111/jfpe.13015.