
ABSTRACT
The high sodium diet is harmful to the human body. In this study, beef was cured with some salt substitutes, namely SS, 39.7% NaCl, 51.3% KCl, 7% L-lysine and 2% L-histidine, in order to reduce the Na content for the final products, and salt substitute effects the physicochemical, lipolytic, and flavor characteristics of dry-cured beef by determining free fatty acids, lipase activity, volatile compounds, and water mobility. The results showed that the lipase activity and unsaturated fatty acids were significantly increased due to the present of L-lysine and L-histidine. In addition, the SS could also enhance the lipoxygenase activity and promoted the lipid oxidation and influenced volatile compounds. The changes of T21 and T22 showed that the water mobility in SS was higher (P < .05) than in the control group. Moreover, the cadaverine, histamine, and tyramine were detected in 57-day dry-cured beef, being below their toxic limits. The present study demonstrated that salt substitute by L-lysine and L-histidine alter the water distribution and mobility, improved the amounts and types of volatile compounds, while had no influence in the quality of product.
Introduction
Dry-cured meat products have good sensory properties due to their unique flavor.[Citation1] Salt, pH and fat composition could affect the physicochemical processes, such as lipolysis and lipid oxidation, and leading to the development of the typical flavor, moisture and sensory characteristics in dry-cured meat products.[Citation2–Citation4]
Since 1980, the reduction of sodium chloride (NaCl) content in meat products has been extensively studied as the risk of hypertension and cardiovascular diseases.[Citation5] Basically the food industry is responsible for daily sodium (Na) intake for consumers, so in this case, particularly, the meat processing industry tries to develop low-sodium meat products, with the aim of providing the right solution while meeting the basic rules of health recommendations.[Citation6] Various scientific approaches have been developed to achieve this goal, such as reducing the total amount of salt or the (partly) substitution of NaCl with potassium (KCl), magnesium (MgCl2) and calcium chloride (CaCl2).[Citation7,Citation8] These alternatives can replace the role of NaCl in the meat processing. A significant result of the simultaneous sodium substitution by potassium (K) plays an important role in increasing K intake. For example, KCl can dehydrate the meat products in the dry-curing process, stabilize the water retention of the meat products, inhibit microorganism and increase the solubility of the protein. It also has a certain degree of salty taste. However, when a high proportion of KCl replaces NaCl, the defects of bitterness are also clearly expressed. Therefore, the effective method to cover up the bitterness of KCl by using taste substances such as nucleotides and amino acids.
In recent years, supplementation with amino acids such as L-lysine and/or L-histidine, not only decreased the Na content[Citation9] but also reduced the sensory defects caused by inorganic salt in meat products.[Citation10,Citation11] Additionally, the introduction of L-lysine and/or L-histidine appeared to contribute to the volatile compounds, salty taste of NaCl and biogenic amines (BAs) in meat products.[Citation12,Citation13] The major BAs in meat were tryptamine (TRY), β-phenylethylamine (PHE), putrescine (PUT), cadaverine (CAD), histamine (HIS), tyramine (TYR), spermine (SPM) and spermidine (SPD).[Citation14] The most frequent foodborne intoxication caused by BAs involves histamine and tyramine.[Citation15] Hence, the introduction of L-lysine and/or L-histidine has been attracted many scientists in the meat industry.
NaCl is the primary additive that is usually used for preserving meat because it plays a prominent role in developing flavor. The development of flavor compounds is a very complex process in dry-cured meat products, and results from either enzymatic action or chemical reactions such as lipid oxidation.[Citation1] Some studies have found that salt substitution containing L-lysine and/or L-histidine inhibited lipid oxidation.[Citation16,Citation17] On the other hand, water mobility is well known as a crucial parameter of dry-cured meat products and plays an important role in defining the quality of dry-cured meat products throughout the processing.[Citation18] The water mobility has been investigated by low-field nuclear magnetic resonance (LF-NMR) in meat. The relaxation time (T2) of LF-NMR shows water mobility, and the area under curve expresses the amount of water within the component.[Citation19] As a result, LF-NMR is an essential indicator during the processing of meat products. Previous studies have not focused on the effect of salt substitute containing L-lysine and/or L-histidine on the flavor and water mobility.[Citation17]
Due to the high contribution of daily salt intake, the level of salt must be reduced from cured meat products, particularly in dry-cured beef. Nevertheless, to the best of our knowledge, no comprehensive investigation available in this regard, to demonstrate the positive effect of salt substitution of dry-cured beef that contains amino acid. Therefore, aim of this study was to investigate sodium reduction and salt substitute on the physicochemical, lipolytic, and volatile properties of dried cured beef products.
Materials and methods
Processing of dry-cured beef semitendinosus
Thirty-six, fresh beef semitendinosus (ST) from Limousin × Luxi steers, with a mean muscle weight of 2.29 ± 0.61 kg and pH value of 5.37 ± 0.12, were obtained from the 18 carcasses slaughtered at Shandong slaughterhouse (Binzhou, Shandong, China). Eighteen carcasses were chilled for 48 h and stored at 0–4°C after slaughter. Then, the left and right ST muscles of each carcass were separated, labeled, and vacuum-packed. The frozen ST muscles were thawed in a refrigerating chamber at 4°C for 5 days. The one on the right or left of ST muscles was selected for salt treatment (control) and the other was selected for salt substitute (SS) treatment. ST muscles were rubbed with salt (100% NaCl) or SS comprising 39.7% of NaCl, 51.3% of KCl and a mixture of 7% L-lysine and 2% L-histidine. L-Lysine and L-histidine were purchased from Hebei Huayang Biological Technology Co., Ltd. (Hebei, China), and then mix with NaCl and KCl at ratio. The rubbed salt or SS amount was 4% of the ST muscle weight. All the samples were done at 90% relative humidity (RH) and 4 ± 1°C for 5 days. After the salting, the ST muscles were placed in artificial casings and then kept at 12°C and 80% RH for 5 days. Subsequently, the ST muscles were placed in a chamber for ripening at 20°C and 70% RH for 17 days until reaching a 45% weight loss and then at 22.5°C for 30 days. The final-ripened meat products (with approximately 47% weight loss after a total of 57 days of ripening) were used as the dry-cured beef samples. The samples were then vacuum-packed and frozen at −40°C until assay. The dry-cured beef was evaluated at six processing time points (day 0, 10, 15, 20, 27, and 57). Each ST muscle was chopped into pieces (6 cm × 10 cm × 10 cm), and samples were vacuum-packaged and stored. At each time point, three cubes were analyzed.
Moisture, water activity, and pH
The moisture content was measured to constant weight by drying the sample at 103 ± 2°C for 24 h (AOAC, 2000). Water activity (aw) was evaluated at 23 ± 2°C with a portable water activity meter (Novasina, Switzerland) in 10 g sample kept at the meter’ measurement chamber. The pH of samples was measured according to Xie et al.[Citation14] in a homogenate of a mixture of 10 g sample and 100 mL distilled water in a homogenizer (IKA T25, Germany) using a portable pH-meter (PHB-4, REX) after 10 min maceration at 25°C.
Sodium and potassium analysis
The nitration and analysis of Na and K solution were done using the method of Tahergorabi et al.[Citation20] All of the glassware were soaked in a solution of 0.3 M HNO3 and washed with deionized distilled water prior to use. Ashed samples were dissolved in 2 mL of 7.7 mol/L nitric acid. The nitration of the samples was measured. The samples were cooled and diluted with 100 mL of deionized distilled water for the analysis. The Na and K contents in sample solutions were carried out using inductively coupled plasma optical emission spectroscopy (ICP-OES) (Optima 2100 DV, Perkin Elmer). The results were expressed as g/100 g.
Biogenic amine determination
Extraction and pretreatment of biogenic amine (BAs) in samples and the preparation of standard solutions were carried out using the method described by Lu et al.[Citation21] Subsequent quantification was carried using high-performance liquid chromatography techniques (Waters Alliance 2695). Separation was carried out on a C18 column (Agilent ZORBAX SB-C18, 4.6 × 250 mm2, 5 μm) at 30°C and peaks were detected at 254 nm. A gradient elution program was used with a mixture of ultra-pure water as solvent A and with acetonitrile as solvent B. The gradient elution procedure was 35% A + 65% B at 0 min, 30% A + 70% B at 5 min, 0% A + 100% B at 20 min, 0% A + 100% B at 24 min, 35% A + 65% B at 25 min and 35% A + 65% B at 30 min. Standard amines were purchased from Sigma (USA).
Free fatty acid analysis
The lipids were obtained from 5 g samples using a method derived from that described by Folch et al.[Citation22] using 25 mL chloroform: methanol (2:1) as a solvent. One hundred milligrams of the extracted lipids were taken for separation and isolation of free fatty acids (FFAs) using the method of Kaluzny et al.[Citation23] FFAs were eluted with 3.0 mL of 2% diethyl ether: acetic acid. The fatty acid (FA) composition of the isolated FFAs was measured by gas-liquid chromatography. Gas Chromatographic conditions were as described by Zhang et al.[Citation17] The analysis was measured by a gas chromatograph (Trace GC Ultra, Thermo Electron Corporation, Waltham, USA). Separation of FAME was carried out in a fused silica capillary column CP-Sil88 (50 m × 0.25 mm) (Chrompack Inc., Middleburg, Netherlands) using nitrogen as the carrier gas (flow rate = 1 mL/s). The oven temperature was kept at 90°C for 2 min, increased to 180°C at 10°C/min and kept for 5 min, then increased to 240°C at 5°C/min and kept for 12 min. The split ratio was 1:70. The detector and injector temperature were 240°C. FAs were identified by comparing their retention times with those of standards. The FFA was expressed as mg/g lipid.
Lipase activity analysis
The extraction and analysis of lipase enzyme solution were carried out by the method of Wang et al.[Citation24] Two hundred milligrams of minced ST muscles were homogenized on ice bath in 3 mL buffer including 5 × 10⁻³ M ethylene glycol-bis-(2-aminoethyl ether)- N, N, N’, N’- tetraacetic acid and 50 × 10−3 M phosphate salt (pH 7.5). The homogenate was then centrifuged at 12,000 g at 4°C for 20 min. The concentration of protein was analyzed by the biuret method. After normalization, the supernatant was chosen as a crude lipase for the lipase activity determinations. The analysis of lipase activities was done using a method described by Zhang et al.[Citation17] One unit (U) was defined as the enzyme amount hydrolyzing 1 μmol substrate per hour at 37°C. The lipase activity was expressed as units (U) per gram protein.
Lipoxygenase activity analysis
Lipoxygenase (LOX, EC 1.13.11.12) activity was carried out by the method of Wang et al.[Citation24] Two hundred milligrams of frozen samples from liquid nitrogen were homogenized by a homogenizer (IKA T25, Germany) on ice in 3 mL lyses buffer comprising of 50 × 10−3 M phosphate salt (pH 7.0), 1 × 10⁻³ M dithiothreitol, and 1 × 10⁻³ M ethylene-bis (oxyethylenenitrilo) tetraacetic acid. The homogenate was centrifuged at 12,000 g at 4°C for 30 min; then the supernatant was taken as crude LOX solution. The concentration of enzyme was detected by biuret method following the standard curve. The substrate solution for the assay of LOX activity was prepared as follows: 140 mg of linoleic acid was added to 5 mL of deoxygenated double-distilled water containing 180 mL Tween 20. The solution was adjusted at pH 9.0 by adding 2 M NaOH until all of linoleic acid was dissolved. The mixture was diluted with distilled water to 50 mL volumetric flask and kept under nitrogen atmosphere. LOX activity was assayed by measuring the increase in absorbance at 234 nm for 1 min at room temperature. The reaction mixture typically contained 40 mL substrate solution, 20 mL of enzymatic solution, and 380 mL of 50 × 10−3 M citrate buffer (pH 5.5). The blank sample contained 400 mL of 50 × 10−3 M citrate buffer (pH 5.5) and 40 mL substrate solution. After incubation at 37°C for 1 min, absorbance values at 234 nm were read before and after incubating in a 96-Well Plate Reader M200 (Tecan, Austria). One unit (U) was defined as an absorbance increment per minute per milligram protein at 234 nm.
Lipid oxidation
The lipid oxidation was measured as described by Harlina et al.[Citation25], with minor modifications. Five grams of ground meat were homogenized with 25 mL of 20% trichloroacetic acid (TCA) and 20 mL of deionized water using a homogenizer (IKA T25, Germany) at 3,000 rpm for 1 min in an ice bath. Butylated hydroxyanisole (BHA) was previously dissolved in ethanol and added prior to homogenization. After standing for 1 h, the sample was centrifuged at 2000 g for 10 min at 4°C. The supernatant was filtered through filter paper into 50 mL volumetric flask. Five milliliters of the filtrate were mixed with 5 mL of 0.02 M thiobarbituric acid (TBA) in distilled water in capped test tubes. Tubes were heated in boiling water for 30 min to develop color. After cooling to ambient temperature using running water, the absorbance of samples was determined at 532 nm against a blank containing 5 mL of the supernatant, 5 mL of 0.02 M TBA and 25 mL of 20% TCA, which was brought to a volume of 50 mL with deionized water. TBARS values were calculated from the standard curve and were expressed as mg of malondialdehyde (MDA) per kg of muscle.
Volatile compounds
Volatile compounds were measured as described by Hui et al.[Citation26] and Harlina et al.[Citation27] with minor adjustments, using headspace solid phase microextraction (HS-SPME). The SPME device (Supelco, Bellefonte, PA) contained 50/30 μm a carboxy/polydimethylsiloxane/divinylbe (CAR/PDMS/DVB) fiber. A 5 g sample was placed in a 20 mL headspace bottle. The CAR/PDMS/DVB fiber was heated in the gas chromatograph injection port at 250°C for 1 hour, inserted into the headspace bottle through the septum and then exposed to the headspace. The extraction was performed at 60°C for 30 min. When the extraction had finished, the fiber was transferred to the injection port of a gas chromatograph-mass spectrometer (SCION SQ 456-GC, BRUKER, USA) fit with a DB-WAX capillary column (30 m × 0.25 mm × 0.25 μm) to allow any volatile compounds on it to desorb in the injection port at 250°C for 3 min. The sample was injected in the splitless mode. Helium was used as the carrier gas with a linear velocity of 0.80 mL/min. The temperature program was held for 3 min at 40°C, raised to 90°C at a rate of 5°C/min, then raised further to 230°C at a rate of 10°C/min, and held constant again for 7 min. The injector temperature was set at 250°C. Compounds were identified by comparing their mass spectra with those contained in the NIST 2011 and WILLEY 7 library and/or by calculation of the retention index relative to a series of standard alkanes (C7–C26) and matching them with the data reported in the literature. The results are expressed as area units (AU) 106 per/g of dry matter and are composed of the mean of four replicates.
Low-field NMR relaxation time measurement
Relaxation measurement was conducted on an NMR Analyser (Model NiumagBenchtop Pulsed PQ001, Niumag Electric Corporation, Shanghai, China). The method was performed according to Xing et al.[Citation28] with minor adjustments. NMR measurements were carried out on the samples including raw beef, and dry-cured beef in SS and the control at different processing days. The experiment was performed at 23.2 MHz, 25°C. Approximately 2 g sample, obtained from the central portion of dry-cured beef, was placed into a chromatographic tube (2-mL volume) and the entire unit was placed in a cylindrical glass tube (18-mm length) and inserted in the NMR probe. The low-field NMR relaxation time was measured using the Carr-Purcell-Meiboom-Gill sequence (CPMG) with 4096 echoes, 16 scans repetitions, a TR (repetition delay) of 2000 ms and a τ value (time between 90° pulse and 180° pulse) of 150 μs.
Relaxation curves were fitted to a multi-exponential shape with MultiExpInv Analysis software (Niumag Electric Corporation, Shanghai, China). The following parameters were assessed: T2b1, T2b2, T22,, and T23, corresponding to a peak value of the different states of water, and P2b1, P2b2, P22, and P23, corresponding to the peak area.
Statistical analysis
Analyses were performed in triplicate, and data were expressed as means followed by the standard deviation. The data obtained on physicochemical properties (water activity, moisture, pH, FFA, lipase activity, T2, P2, TBARS and LOX activity) were analyzed statistically using the ANOVA from the Statistix 8.1 software package (Analytical Software, St Paul, MN, USA). Data were tested for Linear Models, and differences (P <.05) between the control group and SS group were compared using the Tukey test.
Results and discussion
Physicochemical parameters
Compared with the control, a significant (P <.05) reduction in Na content and increment in K content of SS were shown in . Na content of SS in 57-day aged dry-cured beef products decreased (P <.05) by 58.00%, compared to the control, while the K content increased by 76.50%. The 57-day dry-cured beef in SS contained 471.65 mg/100 g of K. Thus, the SS dry-cured beef improves K intake. The World Health Organization (WHO) suggests for adults a daily K intake from food (3.5 g K/day) to reduce the risk of cardiovascular diseases.[Citation29]
Figure 1. Changes of Na (A) and K (B) content in dry-cured beef during processing. Salt = dry-cured beef treated with salt; SS = dry-cured beef treated with salt substitute (39.7% of NaCl, 51.3% of KCl and a mixture of 7% L-lysine and 2% L-histidine). Different capital letters (A–D) indicate significant differences among the different times of salt (P < .05), and different lowercase letters (a–c) indicate significant differences among the different times of SS (P <.05). Different capital letters (X, Y) on the same day indicate significant differences among the different treatments (P < .05). Error bars represent the standard deviation of means (n = 3)
Compared with the control, the moisture contents in SS were lower (P <.05) at day 10, 20, 27 and 57 (). This result might be due to the higher osmotic pressure of salt and evaporation in SS during the processing.[Citation30] The aw in SS was lower (P <.05) than that in the control at day 10, 20, 27 and 57. This observation might result from the hydration degrees of KCl being less than NaCl, i. e. water molecules have weak interactions with the K ions and strong interactions with Na ions.[Citation17] The pH in SS was higher (P <.05) than that in the control at day 10, 15, 20 and 27. This result might be due to the introduction of L-lysine and L-histidine which are both basic amino acid and adjust the pH of dry-cured beef.[Citation31] Moreover, the changed pH value was ascribed to the generation of free fatty acids and amino acids by lipid and protein degradation, respectively.[Citation30]
Table 1. Changes in physicochemical composition during processing of dry-cured beef using salt and SS treatments
Biogenic amines
The concentration of biogenic amines (BAs) in SS and the control was shown in . An increasing concentration of SS and the control from day 0 to day 20 was confirmed, respectively. The concentration of total BAs in 20-day sample was over 22-fold higher than the initial concentration. This trend reversed afterward with the concentration at day 57 falling to almost a quarter the measured highest value. The 0-day dry-cured beef contained low concentration of BAs and only spermine (SPM) and spermidine (SPD) were detected. The amines initially present in greatest concentration were SPM with values of 4 mg/kg, and SPM levels were higher (P < .05) than those of SPD. It is due to the fact that beef is one of the main sources of SPM that together with SPD is involved in physiological processes of living animals, and SPM and SPD are naturally occurring amines in fresh beef.[Citation32,Citation33] Therefore, their presence in dry-cured beef may be due to the use of meat as raw material. However, tryptamine (TRY) and phenylethylamine (PHE) were not found in any of the samples of dry-cured beef. The putrescine (PUT) which was not detectable at day 0, 10 and 57 appeared at day 20 and 27. No differences in 15-day cadaverine (CAD) and 20- or 27-day SPD were observed between SS and the control, while differences were found on histamine (HIS) throughout the processing of dry-cured beef. Differences in 10- and 15-day HIS levels could be related to the fact that dry-cured beef were rubbed with SS containing L-histidine, which caused the eventual formation of HIS. The prevailing physicochemical conditions (pH, temperature and aw) could speed up proteolysis during the dry-curing process, being attributed to muscle proteinases, promoting amino acid accumulation and stimulating BAs formation.[Citation33] CAD in the control was the most concentrated BA at day 57 at 21.75 mg/kg, followed by tyramine (TYR), and HIS. These values in 57-day dry-cured beef were always below 50 mg/kg. The levels of 57-day total BAs were higher (P < .05) than those of 0-day dry-cured beef due to the drying-ripening process involved in the manufacture.[Citation33] Fifty-seven-day dry-cured beef in SS decreased (P < .05) TYR and CAD levels. However, the values were very low (9.49–21.75 mg/kg) compared with the limits of 100–800 mg/kg believed to be toxic.[Citation34] The level of HIS in SS was higher (P < .05) than that in the control, while the level of HIS in SS was very low (9.06 mg/kg) compared with its toxic limits (50–100 mg/kg). The limit of 200 mg/kg for the sum of BAs proposed by Eerola et al.[Citation35] as an indicative criterion for good hygienic conditions and manufacturing practices.
Table 2. Changes in BA concentration during processing of dry-cured beef using salt and SS treatments
Free fatty acid composition comparisons
The changes in FFA during dry-cured beef processing were shown in . Saturated fatty acid (SFA) had the highest percentage, followed by monounsaturated fatty acid (MUFA) and polyunsaturated fatty acid (PUFA). There were no differences (P > .05) in the SFA, MUFA and total FA contents between SS and the control during the whole processing period. However, compared with the control, the PUFA contents in SS decreased (P <.05) 16.40% and 10.19% at day 10 and 20, respectively. Simultaneously, the C20:4 in SS were lower (P < .05) than that in the control at day 10 and 20. The results were likely related to lipid oxidation because it is well known that PUFA is subject to oxidation and transformed to volatile compounds during the processing.[Citation30,Citation36] Lipoxygenase (LOX) activity in SS was higher (P <.05) than that in the control at day 10 and 20 (). Moreover, Buscailhon et al.[Citation37] found that the composition of free fatty acids was very close to that of phospholipids in green ham. However, Huang et al.[Citation30] reported that more free fatty acids were likely to be derived from triacylglycerols in green bacon. Thus, the composition of FFAs may be due to lipolysis of triacylglycerols and phospholipids during the early stage. The percentage of C18:3 in SS decrease at day 27, whereas increased at day 57. LOX activity in SS was higher (P < .05) than that in the control at day 27 (). The higher release of FFA in SS might be due to those lipolytic enzymes remain active at day 57 ().
Table 3. Changes in free fatty acids during processing of dry-cured beef using salt and SS treatments
Table 4. Changes in lipase activity during processing of dry-cured beef using salt and SS treatments
Lipase activity comparisons
Dry-cured beef contained different lipolytic enzymes, especially neutral lipase, acid lipase, and phospholipase activity, that play important roles in lipolysis during the dry-curing process. These lipase activities in SS and the control progressively diminished down to 80–88% and 80–97% of the 0-day activity by 57-day samples, respectively (). It is well known that the temperature increases and the water activity decreases inactivating enzyme activities during the whole processing.[Citation38]
The neutral lipase activity in SS was higher (P <.05) than that in the control at day 15 and 20, but there were no significant differences at other days. Similar trends were observed for the acid lipase activity. The phospholipase activity in SS was higher (P <.05) than that in the control at day 20. The result was in accordance with a study in dry-cured loin, showing that the phospholipase activity was affected by the introduction of L-lysine and L-histidine.[Citation17] Additionally, the higher activity of neutral lipase (pH optimum 7.0) in SS because of the higher (P <.05) pH than that in the control at day 15 and 20 (). The effect of pH on enzyme activity was due to either the conformational transitions of the enzyme or the dissociated state changes of pertinent groups.[Citation39]
TBARS and LOX activity comparisons
The rapid increase of TBARS values at 10 days was due to the severe reaction of lipid oxidation (). Then, decrease of TBARS values was due to the malondialdehyde can covalently bind to residues of proteins, resulting in protein oxidation, and malondialdehyde was further oxidized to other organic acids and alcohols.[Citation40,Citation41] The SS had lower TBARS value than the control at day 10, 15 and 20. This result was in accordance with a recent study in emulsion sausages, showing that L-lysine prevented lipid oxidation and inhibited formation of malondialdehyde.[Citation16] In addition, because the content of NaCl in SS was less than the control, the effect of promoting oxidation decreased. This reason also decreased in the formation of malondialdehyde.[Citation42] Compared with the control, the TBARS values in SS dry-cured beef decreased (P < .05) by 26.56%, 69.21% and 56.13% at day 10, 15 and 20, respectively. It has previously been shown that the use of L-histidine or L-lysine in SS dry-cured beef prevented lipid oxidation and inhibited TBARS formation.[Citation16,Citation17] Moreover, the reduction of Na content in SS reduced TBARS formation, having little pro-oxidant effect.[Citation42] However, the TBARS value in SS was higher (P < .05) than that in the control at day 57. This result was supported by the recent work of Xu et al.[Citation16], who found that L-lysine showed pro-oxidant effects during the final stage of storage.
Figure 2. Changes in TBARS values in dry-cured beef during processing. Salt = dry-cured beef treated with salt; SS = dry-cured beef treated with salt substitute (39.7% of NaCl, 51.3% of KCl and a mixture of 7% L-lysine and 2% L-histidine). Different capital letters (A–D) indicate significant differences among the different times of salt (P < .05), and different lowercase letters (a–e) indicate significant differences among the different times of SS (P <.05). Different capital letters (X, Y) on the same day indicate significant differences among the different treatments (P < .05). Error bars represent the standard deviation of means (n = 3)
The LOX activity in SS was higher (P <.05) than that in the control from day 15 to day 57 (). This result was in accordance with a study in bacon by Jin et al.[Citation43], they reported that the LOX activity gradually increased with pH value increased which was above 5.0 at room temperature, and the evolution in LOX activity resulted from the increase in the PUFA content at day 20 () since PUFA are substrates for LOX, including arachidonic (C20:4) acid. This was in view of the fact that LOX catalyzed the FA oxidation to form unstable hydroperoxides and caused the cleavage of the C-C bond next to hydroperoxy groups forming.[Citation39] Furthermore, LOX involved in different decomposition pathways and led to the formation of many different volatile compounds, such as aliphatic aldehydes, alcohols, ketones, and esters.[Citation43]
Figure 3. Changes of LOX activity in dry-cured beef during processing. Salt = dry-cured beef treated with salt; SS = dry-cured beef treated with salt substitute (39.7% of NaCl, 51.3% of KCl and a mixture of 7% L-lysine and 2% L-histidine). Different capital letters (A–D) indicate significant differences among the different times of salt (P < .05), and different lowercase letters (a–e) indicate significant differences among the different times of SS (P <.05). Different capital letters (X, Y) on the same day indicate significant differences among the different treatments (P < .05). Error bars represent the standard deviation of means (n = 3)
Volatile compounds
Altogether, there were 60 volatile compounds identified in SS and control group at day 57 (). The detected volatiles included 14 aldehydes, 12 esters, 11 alcohols, 11 hydrocarbons, 4 ketones, 4 acids, and 4 others. The total peak area of the SS treatment, compared with the control, increased by 805.14 AU × 106 (P <.05) from a base value of 964.21 (control).
Table 5. Volatile compounds identified in 57-day aged dry-cured beef using salt and SS treatments
Aldehydes were the most abundant volatiles released from dry-cured beef, comprising 73.20% and 58.23% of the total peak area of the volatiles detected in SS and control group, respectively (). Accordingly, aldehydes played an important role in the flavor developing of dry-cured meat because of their low flavor thresholds.[Citation44,Citation45] Furthermore, aldehydes could be further oxidized to produce shorter chain aldehydes or also react with other compounds to generate the flavors. The contents of hexanal and octanal in SS were higher (P < .05) than that in the control, being derived from Maillard reaction with L-lysine.[Citation13] Compared with the control, the higher (P < .05) heptanal in SS resulted from the higher C18:2 in SS at day 57 (). This was due to the fact that heptanal was derived from the auto-oxidation of oleic acid (C18:1) or C18:2.[Citation46] The SS treatments elevated the hexanal content, which was 4.47 times higher (P <.05) than the control. The hexanal was positively correlated with the TBARS () or the activity of LOX () at day 57 since the oxidation of C18:2 generated hexanal.[Citation47] This showed that the high content of hexanal represented the high lipid oxidation status in dry-cured meat.[Citation24] Additionally, acetaldehyde and 2-octenal were only found in SS. As a result of oxidation and degradation, acetaldehyde and 2-octenal reacted with the intermediates of Maillard reaction to produce meat flavor compounds.[Citation13] Both C18:2 and C20:4 were oxidized to unsaturated aldehydes, which played an important role in the flavor of the meat.[Citation48] C6–C9 aldehydes, such as hexanal, heptanal, octanal, and nonanal, contributed ‘grassy, fatty and rancid’ flavors.[Citation49]
Esters were the second major volatiles released from dry-cured beef, representing 13.84% and 16.27% of the total volatiles for SS and control group, respectively (). The total ester content was affected (P < .05) by the salt substitute containing L-lysine and L-histidine. The SS had significantly elevated total ester contents, which was 1.56 times higher (P < .05) than found in the control. This result was in view of the fact that the interaction of FFA and alcohols formed esters.[Citation46] In our study, the content of alcohols in SS was higher (P < .05) than that in the control.
Alcohols were the third most abundant volatiles released from dry-cured beef (). First, the content of 1-heptanol in SS was higher (P < .05) than that in the control, being the product of Maillard reactions related to L-lysine and L-histidine.[Citation13] Second, the content of 1-hexanol in SS was higher (P < .05) than that in the control. This was due to the fact that the lipid oxidation of palmitoleic acid (C16:1) is the main route of volatile 1-hexanol generation.[Citation26] Third, the contents of 1-octen-3-ol in SS were higher (P < .05) than that in the control. 1-Octen-3-ol with a potent mushroom aroma was a contributor to the overall aroma of dry-cured meat, because its low odor threshold (0.001 mg/kg).[Citation24] Moreover, the 1-pentanol was only presented in SS and from C18:2.[Citation50] Overall, the alcohols (3-methyl-1- butanol, 1-pentanol, 1-hexanol, 2-heptanol, 1-octen-3-ol, 1-octanol) contributed with ‘greenish, woody, fruity, ham-like and fatty’ sensory attributes. However, the limited influence of alcohols and aliphatic hydrocarbons on meat flavor resulted from their high odor threshold.[Citation49]
LF-NMR comparisons
LF-NMR provided information about water mobility in meat products.[Citation51] The distributed analysis of T2 in SS and the control are presented in . Four peaks were detected by the multi-exponential fitting of a T2 distribution used to measure the relaxation time of hydrogen protons. They are (1) T2b (0 to 10 ms), representing the tightly associated to protein and bound to macromolecules structures (two minor T2 populations, T2b1 and T2b2); (2) T21 (10 to 100 ms), a major component representing immobilized water (inside the myofibrillar network); and (3) T22 (100 to 1000 ms), representing free water (outside the myofibrillar structure). The predominant water component in dry-cured beef was the immobilized water fraction, corresponding to T21. Accordingly, T21 is related to the flavor and rheological properties of meat, and T22 contributes to potential drip loss in meat.[Citation52]
Figure 4. Distribution of T2 relaxation times for dry-cured beef during processing. Salt = dry-cured beef treated with salt; SS = dry-cured beef treated with salt substitute (39.7% of NaCl, 51.3% of KCl and a mixture of 7% L-lysine and 2% L-histidine)
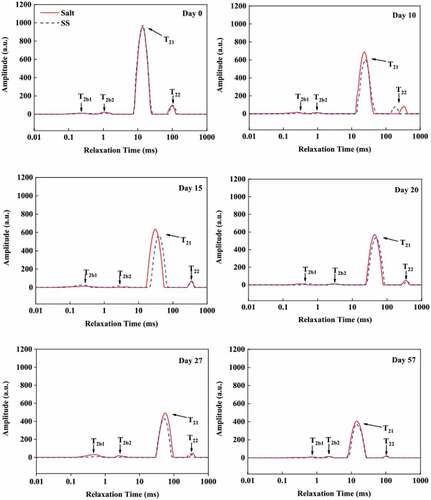
The T2 transversal relaxation time and corresponding relative populations identified by LF-NMR in dry-cured beef were shown in . The SS had a longer (P <.05) T21 relaxation time than the control at day 10, 15, 20 and 57, indicating that the water mobility was higher in SS than that in the control. The samples in SS had longer (P <.05) T2b1 relaxation time than that in the control from day 10 to 27. This result showed that part of the immobilized water might be converted into free water and evaporated, and the remaining might be bound to the tissue proteins, making the content of bound water increased. The association degree for the “new bound water” was lower than that for the original one, which lengthened the T2b1 relaxation time.[Citation53] The SS had a significantly lower (P <.05) T22 value than the control at day 10, indicating a lower mobility of extra-myofibrillar water and more restricted free water in SS.
Table 6. Transverse relaxation times (T2) and corresponding relative populations (P2) of dry-cured beef during processing
The P2b in SS was higher (P <.05) than that in the control at day 15 and 20 (). This result was because of the introduction of L-lysine and L-histidine which increased the pH of dry-cured beef (). The increase of pH in SS, as the result of changing the pH away from the isoelectric point (PI), and improved net charge, could be expected to improve the hydration shell around the proteins.[Citation52] The P22 in SS was lower (P <.05) than that in the control at day 57. Since the muscle water had stronger interactions with Na ions than that with K ions, a larger amount of water might have been kept in the extracellular space, leading to an increase in P22 of the control at day 57. Also, the increment in ionic strength increased the distance between thin and thick filaments, widened the spaces between myofilaments, prompted a swelling of the myofilament lattice, and increased water mobility into the muscle fibers.[Citation28] Therefore, compared with the control, the SS altered the water distribution and mobility in dry-cured beef. Moreover, the salt gradually diffuses into the interior of the muscle fiber during the processing. The diffusion rate of K is faster than Na due to its smaller hydrated ion radius.[Citation54] As a result, the salt substitute might require a shorter processing time to achieve a similar effect.
Conclusion
According to the results, the salt substitute (SS) containing L-lysine and L-histidine induced a marked reduction (58%) in the Na content and enhanced the lipase activity in dry-cured beef compared to the control group (100% NaCl treated samples). Simultaneously, slightly higher lipolysis was observed in the beef samples treated with the salt substitute. In addition, the value of TBARS and LOX activity was increased, resulting the increasing amount and types of total volatile compounds in SS group. T21 and T22 relaxation time in SS was longer than in the control group. As a result, the SS required a shorter processing time to achieve a similar effect. Consequently, it is suggested that the partial replacement of NaCl by L-lysine and L-histidine might be a possible approach to reduce the amount of sodium in dry-cured meat products.
Acknowledgments
Authors would like to thank Dr. Ron Tume for language help and Dr. Xing Chen and Dr Putri Widyanti Harlina for the help with manuscript modification. This research received no external funding. The authors declare no conflict of interest.
References
- Flores, M.;. Understanding the Implications of Current Health Trends on the Aroma of Wet and Dry Cured Meat Products. Meat Sci. 2018, 144, 53–61. DOI: 10.1016/j.meatsci.2018.04.016.
- Candek-Potokar, M.; Skrlep, M. Factors in Pig Production that Impact the Quality of Dry-cured Ham: A Review. Animal. 2012, 6(2), 327–338. DOI: 10.1017/S1751731111001625.
- Du, X. J.; Sun, Y. Y.; Pan, D. D.; Wang, Y.; Ou, C. R.; Cao, J. X. The Effect of Structural Change on the Digestibility of Sarcoplasmic Proteins in Nanjing Dry-cured Duck during Processing. Poultr. Sci. 2018, 97(12), 4450–4457. DOI: 10.3382/ps/pey316.
- Du, X.; Sun, Y.; Pan, D.; Wang, Y.; Ou, C.; Cao, J. Change of the Structure and the Digestibility of Myofibrillar Proteins in Nanjing Dry-cured Duck during Processing. J. Sci. Food Agric. 2018, 98(8), 3140–3147. DOI: 10.1002/jsfa.8815.
- Inguglia, E. S.; Zhang, Z.; Tiwari, B. K.; Kerry, J. P.; Burgess, C. M. Salt Reduction Strategies in Processed Meat Products – A Review. Trends Food Sci. Technol. 2017, 59, 70–78. DOI: 10.1016/j.tifs.2016.10.016.
- Fellendorf, S.; Kerry, J. P.; Hamill, R. M.; O’Sullivan, M. G. Impact on the Physicochemical and Sensory Properties of Salt Reduced Corned Beef Formulated with and without the Use of Salt Replacers. LWT. 2018, 92, 584–592. DOI: 10.1016/j.lwt.2018.03.001.
- Armenteros, M.; Aristoy, M.-C.; Barat, J. M.; Toldrá, F. Biochemical and Sensory Changes in Dry-cured Ham Salted with Partial Replacements of NaCl by Other Chloride Salts. Meat Sci. 2012, 90(2), 361–367. DOI: 10.1016/j.meatsci.2011.07.023.
- Zhou, C. Y.; Wang, Y.; Cao, J. X.; Chen, Y. J.; Liu, Y.; Liu, Y.; Sun, Y. Y.; Pan, D. D.; Ou, C. R. The Effect of Dry-cured Salt Contents on Accumulation of Non-volatile Compounds during Dry-cured Goose Processing. Poultr. Sci. 2016, 95(9), 2160–2166. DOI: 10.3382/ps/pew128.
- Zhang, Y. W.; Cheng, Q. F.; Yao, Y.; Guo, X. Y.; Wang, R. R.; Peng, Z. Q. A Preliminary Study: Saltiness and Sodium Content of Aqueous Extracts from Plants and Marine Animal Shells. Eur. Food Res. Technol. 2014, 238(4), 565–571. DOI: 10.1007/s00217-013-2136-1.
- Campagnol, P. C. B.; Santos, B. A. D.; Morgano, M. A.; Terra, N. N. Application of Lysine, Taurine, Disodium Inosinate and Disodium Guanylate in Fermented Cooked Sausages with 50% Replacement of NaCl by KCl. Meat Sci. 2011, 87(3), 239–243. DOI: 10.1016/j.meatsci.2010.10.018.
- Campagnol, P. C. B.; Santos, B. A. D.; Terra, N. N.; Pollonio, M. A. R. Lysine, Disodium Guanylate and Disodium Inosinate as Flavor Enhancers in Low-sodium Fermented Sausages. Meat Sci. 2012, 91(3), 334–338. DOI: 10.1016/j.meatsci.2012.02.012.
- Dos Santos Alves, L. A. A.; Lorenzo, J. M.; Gonçalves, C. A. A.; Dos Santos, B. A.; Heck, R. T.; Cichoski, A. J.; Campagnol, P. C. B. Impact of Lysine and Liquid Smoke as Flavor Enhancers on the Quality of Low-fat Bologna-type Sausages with 50% Replacement of NaCl by KCl. Meat Sci. 2017, 123(Supplement C), 50–56. DOI: 10.1016/j.meatsci.2016.09.001.
- Zhu, C. Z.; Zhao, J. L.; Tian, W.; Liu, Y. X.; Li, M.; Zhao, G. M. Contribution of Histidine and Lysine to the Generation of Volatile Compounds in Jinhua Ham Exposed to Ripening Conditions via Maillard Reaction. J. Food Sci. 2018, 83(1), 46–52. DOI: 10.1111/1750-3841.13996.
- Xie, C.; Wang, -H.-H.; Nie, X.-K.; Chen, L.; Deng, S.-L.; Xu, X.-L. Reduction of Biogenic Amine Concentration in Fermented Sausage by Selected Starter Cultures. CyTA - J. Food. 2015, 13(4), 491–497. DOI: 10.1080/19476337.2015.1005027.
- Anastasio, A.; Draisci, R.; Pepe, T.; Mercogliano, R.; Quadri, F. D.; Luppi, G.; Cortesi, M. L. Development of Biogenic Amines during the Ripening of Italian Dry Sausages. J. Food Prot. 2010, 73(1), 114–118. DOI: 10.4315/0362-028X-73.1.114.
- Xu, P.; Zheng, Y.; Zhu, X.; Li, S.; L-lysine, Z. C. And L-arginine Inhibit the Oxidation of Lipids and Proteins of Emulsion Sausage by Chelating Iron Ion and Scavenging Radical. Asian-australas. J. Anim. Sci. 2018, 31(6), 905–913. DOI: 10.5713/ajas.17.0617.
- Zhang, Y. W.; Zhang, L.; Hui, T.; Guo, X. Y.; Peng, Z. Q. Influence of Partial Replacement of NaCl by KCl, L-histidine and L-lysine on the Lipase Activity and Lipid Oxidation in Dry-cured Loin Process. LWT - Food Sci. Technol. 2015, 64(2), 966–973. DOI: 10.1016/j.lwt.2015.06.073.
- Li, W. M.; Wang, P.; Xu, X. L.; Xing, T.; Zhou, G. H. Use of Low-field Nuclear Magnetic Resonance to Characterize Water Properties in Frozen Chicken Breasts Thawed under High Pressure. Eur. Food Res. Technol. 2014, 239(2), 183–188. DOI: 10.1007/s00217-014-2189-9.
- McDonnell, C. K.; Allen, P.; Duggan, E.; Arimi, J. M.; Casey, E.; Duane, G.; Lyng, J. G. The Effect of Salt and Fibre Direction on Water Dynamics, Distribution and Mobility in Pork Muscle: A Low Field NMR Study. Meat Sci. 2013, 95(1), 51–58. DOI: 10.1016/j.meatsci.2013.04.012.
- Tahergorabi, R.; Beamer, S. K.; Matak, K. E.; Jaczynski, J. Salt Substitution in Surimi Seafood and Its Effects on Instrumental Quality Attributes. LWT - Food Sci. Technol. 2012, 48(2), 175–181. DOI: 10.1016/j.lwt.2012.03.004.
- Lu, S.; Xu, X.; Zhou, G.; Zhu, Z.; Meng, Y.; Sun, Y. Effect of Starter Cultures on Microbial Ecosystem and Biogenic Amines in Fermented Sausage. Food Control. 2010, 21(4), 444–449. DOI: 10.1016/j.foodcont.2009.07.008.
- Folch, J.; Lees, M.; Sloane-Stanley, G. A Simple Method for the Isolation and Purification of Total Lipids from Animal Tissues. J. Biol. Chem. 1957, 226(1), 497–509.
- Kaluzny, M.; Duncan, L.; Merritt, M.; Epps, D. Rapid Separation of Lipid Classes in High Yield and Purity Using Bonded Phase Columns. J. Lipid Res. 1985, 26(1), 135–140. DOI: 10.1089/jir.1985.5.651.
- Wang, Y.; Jiang, Y. T.; Cao, J. X.; Chen, Y. J.; Sun, Y. Y.; Zeng, X. Q.; Pan, D. D.; Ou, C. R.; Gan, N. Study on Lipolysis-oxidation and Volatile Flavour Compounds of Dry-cured Goose with Different Curing Salt Content during Production. Food Chem. 2016, 190, 33–40. DOI: 10.1016/j.foodchem.2015.05.048.
- Harlina, P. W.; Shahzad, R.; Ma, M.; Geng, F.; Wang, Q.; He, L.; Ding, S.; Qiu, N. Effect of Garlic Oil on Lipid Oxidation, Fatty Acid Profiles and Microstructure of Salted Duck Eggs. J. Food Process. Preserv. 2015, 39(6), 2897–2911. DOI: 10.1111/jfpp.12541.
- Hui, T.; Zhang, Y. W.; Jamali, M. A.; Peng, Z. Q. Incorporation of Pig Back Fat in Restructured Dry Cured Ham to Facilitate the Release of Unsaturated Fatty Acids and Generation of Volatile Compounds. Eur. J. Lipid Sci. Technol. 2017, 119(2), 1600025. DOI: 10.1002/ejlt.201600025.
- Harlina, P. W.; Ma, M.; Shahzad, R.; Gouda, M. M.; Qiu, N. Effect of Clove Extract on Lipid Oxidation, Antioxidant Activity, Volatile Compounds and Fatty Acid Composition of Salted Duck Eggs. J. Food Sci. Technol. 2018, 55(12), 4719–4734. DOI: 10.1007/s13197-018-3367-8.
- Xing, T.; Zhao, X.; Han, M. Y.; Cai, L. L.; Deng, S. L.; Zhou, G. H.; Xu, X. L. A Comparative Study of Functional Properties of Normal and Wooden Breast Broiler Chicken Meat with NaCl Addition. Poultr. Sci. 2017, 96(9), 3473. DOI: 10.3382/ps/pex116.
- Mokrini, F.; Waeyenberge, L.; Viaene, N.; Moens, M. WHO Guideline: Potassium intake for adults and children. 2012.
- Huang, Y. C.; Li, H. J.; Huang, T.; Li, F.; Sun, J. Lipolysis and Lipid Oxidation during Processing of Chinese Traditional Smoke-cured Bacon. Food Chem. 2014, 149(15), 31–39. DOI: 10.1016/j.foodchem.2013.10.081.
- Li, S.; Zheng, Y.; Xu, P.; Zhu, X.; Zhou, C. l-Lysine and L-arginine Inhibit Myosin Aggregation and Interact with Acidic Amino Acid Residues of Myosin: The Role in Increasing Myosin Solubility. Food Chem. 2018, 242, 22–28. DOI: 10.1016/j.foodchem.2017.09.033.
- Bardócz, S.;. Polyamines in Food and Their Consequences for Food Quality and Human Health. Trends Food Sci. Technol. 1995, 6(10), 341–346. DOI: 10.1016/S0924-2244(00)89169-4.
- Hernández-Jover, T.; Izquierdo-Pulido, M.; Veciana-Nogués, M. T.; Mariné-Font, A.; Vidal-Carou, M. C. Biogenic Amine and Polyamine Contents in Meat and Meat Products. J. Agric. Food Chem. 1997, 45(6), 2098–2102. DOI: 10.1021/jf960790p.
- Ten Brink, B.; Damink, C.; Joosten, H. M. L. J.; Huis in ‘t Veld, J. H. J. Occurrence and Formation of Biologically Active Amines in Foods. Int. J. Food Microbiol. 1990, 11(1), 73–84. DOI: 10.1016/0168-1605(90)90040-C.
- Eerola, S.; Maijala, R.; Sagués, A.-X. R.; Salminen, M.; Hirvi, T. Biogenic Amines in Dry Sausages as Affected by Starter Culture and Contaminant Amine-Positive Lactobacillus. J. Food Sci. 1996, 61(6), 1243–1246. DOI: 10.1111/j.1365-2621.1996.tb10970.x.
- Yang, Y.; Sun, Y.; Pan, D.; Wang, Y.; Cao, J. Effects of High Pressure Treatment on Lipolysis-oxidation and Volatiles of Marinated Pork Meat in Soy Sauce. Meat Sci. 2018, 145, 186–194. DOI: 10.1016/j.meatsci.2018.06.036.
- Buscailhon, S.; Gandemer, G.; Monin, G. Time-related Changes in Intramuscular Lipids of French Dry-cured Ham. Meat Sci. 1994, 37(2), 245. DOI: 10.1016/0309-1740(94)90084-1.
- Ripollés, S.; Campagnol, P. C. B.; Armenteros, M.; Aristoy, M. C.; Toldrá, F. Influence of Partial Replacement of NaCl with KCl, CaCl2 and MgCl2 on Lipolysis and Lipid Oxidation in Dry-cured Ham. Meat Sci. 2011, 89(1), 58–64. DOI: 10.1016/j.meatsci.2011.03.021.
- Jin, G.; Zhang, J.; Yu, X.; Lei, Y.; Wang, J. Crude Lipoxygenase from Pig Muscle: Partial Characterization and Interactions of Temperature, NaCl and pH on Its Activity. Meat Sci. 2011, 87(3), 257–263. DOI: 10.1016/j.meatsci.2010.09.012.
- Liu, D. C.; Wu, S. W.; Tan, F. J. Effects of Addition of Anka Rice on the Qualities of Low-nitrite Chinese Sausages. Food Chem. 2010, 118(2), 245–250. DOI: 10.1016/j.foodchem.2009.04.114.
- Zhang, W.; Xiao, S.; Ahn, D. U. Protein Oxidation: Basic Principles and Implications for Meat Quality. Crit. Rev. Food Sci. Nutr. 2013, 53(11), 1191–1201. DOI: 10.1080/10408398.2011.577540.
- Lorenzo, J. M.; Cittadini, A.; Bermúdez, R.; Munekata, P. E.; Domínguez, R. Influence of Partial Replacement of NaCl with KCl, CaCl2 and MgCl2 on Proteolysis, Lipolysis and Sensory Properties during the Manufacture of Dry-cured Lacòn. Food Control. 2015, 55, 90–96. DOI: 10.1016/j.foodcont.2015.02.035.
- Jin, G. F.; Zhang, J. H.; Yu, X.; Zhang, Y. P.; Lei, Y. X.; Wang, J. M. Lipolysis and Lipid Oxidation in Bacon during Curing and Drying–Ripening. Food Chem. 2010, 123(2), 465–471. DOI: 10.1016/j.foodchem.2010.05.031.
- García-González, D. L.; Aparicio, R.; Aparicio-Ruiz, R. Volatile and Amino Acid Profiling of Dry Cured Hams from Different Swine Breeds and Processing Methods. Molecules. 2013, 18(4), 3927–3947. DOI: 10.3390/molecules18043927.
- Yang, Y.; Zhang, X.; Wang, Y.; Pan, D.; Sun, Y.; Cao, J. Study on the Volatile Compounds Generated from Lipid Oxidation of Chinese Bacon (unsmoked) during Processing. Eur. J. Lipid Sci. Technol. 2017, 119(10), 1600512. DOI: 10.1002/ejlt.201600512.
- Muriel, E.; Antequera, T.; Petrón, M. J.; Andrés, A. I.; Ruiz, J. Volatile Compounds in Iberian Dry-cured Loin. Meat Sci. 2004, 68(3), 391–400. DOI: 10.1016/j.meatsci.2004.04.006.
- Purriños, L.; Franco, D.; Carballo, J.; Lorenzo, J. M. Influence of the Salting Time on Volatile Compounds during the Manufacture of Dry-cured Pork Shoulder “lacón”. Meat Sci. 2012, 92(4), 627–634. DOI: 10.1016/j.meatsci.2012.06.010.
- Barbosa, P. T.; Santos, I. C. V.; Ferreira, V. C. S.; Fragoso, S. P.; Araújo, Í. B. S.; Costa, A. C. V.; Araújo, L. C.; Silva, F. A. P. Physicochemical Properties of Low Sodium Goat Kafta. LWT - Food Sci. Technol. 2017, 76, 314–319. DOI: 10.1016/j.lwt.2016.06.071.
- García-González, D. L.; Tena, N.; Aparicio-Ruiz, R.; Morales, M. T. Relationship between Sensory Attributes and Volatile Compounds Qualifying Dry-cured Hams. Meat Sci. 2008, 80(2), 315–325. DOI: 10.1016/j.meatsci.2007.12.015.
- Ghita Studsgaard, N.; Lone Melchior, L.; Leif, P. Formation of Volatile Compounds in Model Experiments with Crude Leek (allium Ampeloprasum Var. Lancelot) Enzyme Extract and Linoleic Acid or Linolenic Acid. J. Agric. Food Chem. 2004, 52(8), 2315–2321. DOI: 10.1021/jf030600s.
- Marcone, M. F.; Wang, S.; Albabish, W.; Nie, S.; Somnarain, D.; Hill, A. Diverse Food-based Applications of Nuclear Magnetic Resonance (NMR) Technology. Food Res. Int. 2013, 51(2), 729–747. DOI: 10.1016/j.foodres.2012.12.046.
- Bertram, H. C.; Karlsson, A. H.; Andersen, H. J. The Significance of Cooling Rate on Water Dynamics in Porcine Muscle from Heterozygote Carriers and Non-carriers of the Halothane Gene—A Low-field NMR Relaxation Study. Meat Sci. 2003, 65(4), 1281–1291. DOI: 10.1016/s0309-1740(03)00038-x.
- Li, X.; Ma, L. Z.; Tao, Y.; Kong, B. H.; Li, P. J. Low field-NMR in Measuring Water Mobility and Distribution in Beef Granules during Drying Process. Adv. Mater. Res. 2012, 550, 3406–3410. DOI: 10.4028/www.scientific.net/AMR.550-553.3406.
- Volkov, A. G.; Paula, S.; Deamer, D. W. Two Mechanisms of Permeation of Small Neutral Molecules and Hydrated Ions across Phospholipid Bilayers. Bioelectrochem. Bioenerg. 1997, 42(2), 153–160. DOI: 10.1016/S0302-4598(96)05097-0.