
 ?Mathematical formulae have been encoded as MathML and are displayed in this HTML version using MathJax in order to improve their display. Uncheck the box to turn MathJax off. This feature requires Javascript. Click on a formula to zoom.
ABSTRACT
Bamboo shoots quality determination method using EN and M.O.S sensor array optimization was studied in this paper. EN responses to winter bamboo shoots samples under different storage time were measured. Sensor loading analysis results demonstrated that sensor array optimization improved principal component analysis discrimination degree of shoots samples in different quality. Non-linear stochastic resonance was utilized for optimized EN measurement data analysis. SR signal-to-noise ratio quantitatively discriminated all samples. Winter bamboo shoots quality determination model was developed by linear fitting regression of SR signal-to-noise ratio eigen values. Validating experiments results indicated that the developed model presented a quality-predicting accuracy of 83.3% for shoots samples.
Introduction
Bamboo, a kind plant of Poaceae subfamily of Bambusoideae plants, is an evergreen perennial herbaceous plant. It is widely planted in many countries over the world, especially in the Asian countries, such as China.[Citation1,Citation2] Bamboo shoot is the young bamboo plant emerging from the ground with a height of 20–40 cm. The bamboo shoot is of abundant nutrition, and it is a kind of pollution-free food with good flavor and taste. The shoots contain rich proteins and fibers but low in fat.[Citation1,Citation3] Meanwhile, the growing environment of most bamboo shoots is natural and without any pesticides. The bamboo shoots can be also processed to canned food, fermented food, and soft drinks.[Citation4] Bamboo shoot is also a kind of traditional Chinese medicine due to their unique factors such as hypolipidemic effect, anti-diabetic activity, and anti-aging activity.[Citation5,Citation6] However, the composition and the biological functions of polysaccharides extracted from the bamboo shoot shells are far from being understood. The bamboo shoots also contribute to produce active polysaccharides that could have anti-diabetic effects similar to that of some herbal medicine.[Citation7]
So far, many methods have been studied for food quality detection, such as physical/chemical examination, human sensory evaluation, and instrumentation analysis.[Citation8–Citation10] Physical/chemical examination (molds counts, pH, and total variable counts, etc.) objectively characterizes sample’s quality according to relevant standards and protocols. But these methods present some inherent drawbacks including fuzzy operation, severe damages, and time-consuming.[Citation11,Citation12] Human sensory evaluation can also judge food quality information from the aspect of sensory profiles. This method realizes the goal of non-destructive assessment, but the results are often lack of reproducibility and stability due to the interference of human factors.[Citation13,Citation14] Moreover, instrumentation analysis, performed by skilled operators under laboratory conditions, depends on costly equipments.[Citation15,Citation16] Therefore, traditional analysis methods are not suitable for food quality rapid analysis due to their drawbacks.
EN technique has attracted much interest of researchers in food aroma analysis.[Citation17,Citation18] This technique utilizes certain sensor array to imitates human olfactory senses for sample identification or quantitative analysis. Since the analyzing object of EN system is the gases volatilized by test sample, no damage occurs towards the test samples during the whole measurement.[Citation19,Citation20] EN takes unique advantages over traditional methods, such as rapid responses, and easy operation. EN is usually combined some data dimension reduction or pattern recognition methods (such as principal component analysis (PCA), partial least squares (PLS), artificial neural networks (ANN), Linear Discriminant Analysis (LDA), and cluster analysis (CA)) has played an important role for food quality rapid measurement.[Citation21–Citation23] The use of PCA successfully discriminated all samples according to their differences in variety and flavor.[Citation24] Tian et al. realized the goal for pork adulteration rapid classification using a PEN2 equipment. Results suggested that improved LDA was the most effective method for feature extraction, and multiple linear regression (MLR), PLS and BPNN methods precisely predicted the pork content in minced mutton.[Citation25] Huo et al. developed a utilized artificial nose and tongue combined with colorimetric sensor arrays for Chinese green tea variety and grade level discrimination. The application of PCA and hierarchical CA provided important technological supports for signal processing.[Citation26] Wei et al. put forward peanuts storage quality rapid predictive method by using EN response combined with physicochemical examination. Samples with different quality levels were clearly grouped by CA and PCA. In addition, storage time and physicochemical indexes of peanuts (unshelled samples and peanut kernels) were predicted by PLSR with high forecasting accuracy.[Citation27] However, most of these methods just provide a qualitative discrimination approach and cannot realize the goal for quantitative discrimination.[Citation28] So, further researches are particularly needed to overcome this problem. To our knowledge, there is little information reported yet about the application of non-destructive EN technique combined with SR algorithm in quantitatively discrimination of Chinese herbal medicines according to the species and quality level.
In this research, EN technique was applied for winter bamboo shoots quality rapid discrimination. EN responses to shoots were measured. PCA and SR were utilized for EN measurement data analysis. Sensor array optimization was conducted to improve EN discrimination ability. Bamboo shoots quality detecting model was developed based on SNR eigen values. Validating experiments were also conducted to evaluate the detecting accuracy of the developed model.
Materials and methods
Raw materials and reagents
Fresh bamboo shoots were collected from an agricultural market in Hangzhou. The samples were selected in near weight, size, and harvest time. After transporting to the laboratory, 20 parallel samples were prepared. Each sample weighed 150 g ± 5 g. The samples were packaged by polythene bag. Then, all samples were stored at 90% relative humidity (RH) and 30°C to simulate moldy procedure.
Weight loss
Bamboo shoots samples were weighted by Mettler Toledo AL104 electronic balance. Weight loss was calculated as the percentage of weight reduction with respect to the initial weight in the first day.
Microbial examination
25 g bamboo shoots were aseptically weighed and homogenized with 225 ml 0.1% sterile physiological saline for 1 min. Then, serial dilution was performed by diluting the homogenized sample with 9 ml sterile saline. TVC was determined by the spread plate method.[Citation29]
Sensory evaluation
Sensory evaluation towards bamboo shoots samples was performed by six experienced panelists (see ). Voting number is set at k, k∈(1,10). The samples’ quality is divided into m levels, and the score of a specific level is set at, j∈(1,m). Shoots’ attributes are divided into n elements, and a specific element is set at ui, i∈(1,n). The contributory weight is determined by pairwise comparison of contribution weight of attributes is set at xi (∑xi= 1). If there is a specific relationship between two objects of
and ui, the relation set (matrix) of f is calculated as follows:
Table 1. Sensory scheme for evaluating the quality of winter bamboo shoots samples
Thus, the overall acceptability is calculated by the weight grade method as follows:
EN system
In this work, EN is designed for the experiments. It consists of three fundamental parts including data acquisition unit (U1), sensor array unit (U2), and power supply unit (U3) (see ). The sensor array is composed of eight metal oxide semiconductor (M.O.S) sensors with different chemical compositions and thickness to provide selectivity toward different gases. The selectivity towards volatile compound classes of M.O.S sensors is indicated by the supplier: S1 (MQ-2, propane), S2 (MQ-3, ethanol), S3 (MQ-4, methane), S4 (MQ-5, propane, butane), S5 (MQ-6, butane), S6 (MQ-7, carbon monoxide), S7 (MQ-8, hydrogen), S8 (MQ-9, methane, carbon monoxide). Each sensor is distributed in an independent sensor chamber. The sensor responses are measured as sampling voltage (V). The sensors rely on changes in conductivity induced by the adsorption of molecules in the gas phase and on subsequent surface reactions. They consist of ceramic substrate coated by metal oxide semiconducting film, and heated by wire resistor. Due to the high temperature (250–500°C), the volatiles transferred to the surface of the sensors are totally combusted to carbon dioxide and water, leading to a change in the resistance. The high temperature avoids water interference and provides sensors fast response and rapid recovery time. Polytetrafluorethylene (PTFE) material is utilized to fabricate the chamber. Each sensor room is separated, which helps to avoid the cross-influence of the gas flow.
Figure 1. Schematic diagram of EN system structure
EN measurement
EN measurement was performed under room temperature. Before EN measurement, the samples were placed in a 250 mL of erlenmeyer flask and sealed with sealing membrane for EN analysis. All samples were equilibrated for 30 min at room temperature. After turning on EN power, washing pump and valve 2 started. The sampling pump and valve 1 remained off. The air was filtered by active carbon to obtain zero gas. Sensor array was recovered by zero gas. When sensors’ responses returned to the baseline, washing pump and valve 2 were shut off. Then, sampling pump and valve 1 were turned on. The gases in sample’s headspace were inhaled into gas sensor chambers by sampling pump at a flux speed of 400 mL/min for 40 s. EN measurement interval was 0.05 s. EN real-time responses to samples were recorded. When measurement was over, gas sensors were recovered by zero gas at a flux speed of 1000 mL/min for 600 s, waiting for the next measurement.
Sensor array loading analysis
EN has multiple gas sensors, and each sensor has its specific response to the gases emitted by Chinese medicine samples. In medicine quality examination experiments, the influences of gas sensor array optimization to Chinese medicine quality discrimination have been carefully considered. The loading analysis of each gas sensor has been conducted. Only one of the sensors with similar loading values is kept. Therefore, the newly built gas sensor array is utilized in PCA to improve the discrimination accuracy.
Loading analysis is frequently used in variable (EN measurement data) classification. EN gas sensors can be classified according to loading analysis results, which provides the basis for the sensor optimization operations. Here, coefficient of variation method is applied.
In EquationEq. (1(1)
(1) ),
is the measurement data of a certain gas sensor, and
is the mean value of the measurement data of this sensor.
is the length of the sensor data. If the variance coefficient of some sensors is close, then any one of these sensors can be selected as the representative to conduct the array optimization. In this work, MATLAB R2009a software is used to conduct the sensor loading analysis.
Stochastic resonance
SR is a counter-intuitive phenomenon, and it plays a positive role in a non-linear system, and has inclusive applications in the fields of signal processing.[Citation30–Citation32] SR phenomenon has three elements: a bistable system, an input signal and an external noise source. Usually, overdamped Brownian motion particles driven by periodic power in a bistable potential well are used to describe the characteristics of SR system.
where A is periodical signal intensity, is signal frequency,
is noise intensity,
is a real parameter,
is a Gaussian white noise, its autocorrelation function is
, and
is a nonlinear symmetric potential function with constants m and n.
So EquationEquation (2)(2)
(2) can be rewritten as follows:
Nowadays, SNR is commonly applied to describe the characteristics of SR system. And here we define SNR as[Citation33]:
where is the power spectral density, and
is the noise intensity in signal frequency range. EN measurement data analyzing procedures by SR method are displayed in . In practical analysis, the parameters of periodic signal (
、
、
) remain unchanged. And the value range of the noise intensity
is [0,300]. Bistable parameter
. And the value range of
is[Citation1,Citation11] with a stepping of 0.1. At the same time, system output is well monitored. The value of
can be determined when the system output SNR curve reaches its eigen maximal value. At present, the parameters of the bistable system are in their optimized values. The output SNR values are calculated to obtain SNR eigen values under the optimized condition.
Figure 2. Schematic diagram of stochastic resonance data analysis
Statistical analysis
Each test was performed by triplicate and the result was reported by means with standard deviation. Data were subjected to one-way ANOVA analysis. The significant level was set to p< .05.
Results and discussion
Weight loss
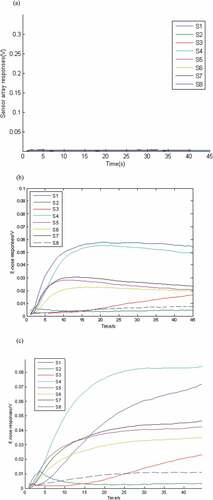
) shows weight loss index during storage. The index increased with the increase of storage time. Results indicated that moisture loss was the key factor in agro-product quality degradation. In day5, an obvious increase in weight loss was observed, indicating that the quality of the samples changes obviously in this day. Bamboo shoots texture profiles change rapidly after harvest, resulting in the decrease of water-holding ability and increase of weight loss.
Figure 3. Physical/chemical examination results: (a) weight loss; (b) microbial examination; (c) sensory evaluation
Microbial examination
TVC value of shoots samples was 1 × 10⁵ CFU/g in day 0 (see )). In day 4, the samples presented a TVC value of 5 × 10⁵ CFU/g. Microbial index reached about 5 × 10⁶ CFU/g in day5 (higher than 6 × 10⁶ CFU/g), and thereby was considered not fresh.
Sensory evaluation
Sensory evaluation results are shown in ). All samples had a score of 5 on Day 0, suggesting that samples were very fresh. In day 2, the preference score was about 3.8. Score 2 was set as the accepting threshold value for bamboo shoots samples. After 5 days’ storage, the preference score was about 1.9, and became non-fresh. Texture properties of bamboo shoot changed continuously after harvest, such as reduction in hardness and resilience. These changes destroyed the connection between shoot meat and inside fibers, and thereby reduced the water-holding capacity of the shoot. Color index was closely associated with the inside nutrition contents. These factors were easily influenced by the storage time and the sensory index.
EN original responses and PCA results
Gas sensors are subjected to baseline drift. So, stability characterization of EN sensor array is particularly important in this research. EN responses to blank samples (zero gas) are measured during the whole experiment. Zero gas, obtained by filtering air through active carbon, is utilized as blank sample. EN measurement is performed with the formula detailed in Section 2.2. ) displays the examining results on blank sample. EN gas sensors make relatively low responses towards zero gas throughout the experiment. Therefore, baseline drift effect has no significant impact on gas sensors’ responses and EN system presents high stability in this research.
Figure 4. EN sensor array original responses: (a) blank sample; (b) non-moldy shoots sample; (c) moldy shoots sample
EN sensor array original responses to bamboo shoots samples are displayed in and , respectively. The gases existing in the headspace of the sample are inhaled into EN gas chamber and then sensed by the functional chemical materials on the surface of sensors. The specific absorption for specific gas species induces chemical material’s change in their electrical characteristics. Gas sensors have different sensing species. Therefore, signals induced by electrical changes can be used to characterize gas concentrations.
In ), the initiative responses of the sensors are close to zero, suggesting that sensor array is in a clean state. With the increase of sampling time, their responses gradually grow and finally reach stable values. Sensor S1 presents the maximal stable value about 0.055 V. The stable value of S4 is about 0.049 V. S3, S5, S6, and S7 are similar, and their stable values are much lower than S1 and S4’s. While the rest two sensors (S2 and S8) present relatively weak responses. In ), EN original responses to moldy bamboo shoots differ a lot from the responses of non-moldy sample, especially for S4, S1, S2, S5, S6, and S3. S4 presents the maximum stable value (about 0.084 V), followed by S1 (about 0.072 V). By comparing the samples stored at different conditions, obvious mildew occurrence can be observed on the surface of samples stored at 85% RH. Although some antifungal components can inhibit fungal invasion to some extent, the mildew occurrence continuously intensifies with the increase of storage under the condition of high humidity and warm temperature.[Citation34–Citation38] During moldy procedure, effective nutritional components are decomposed and thereby some volatile gases generate, such as alkanes, alcohols, and carbon monoxide.[Citation37,Citation39–Citation41] These biochemical reactions lead to the differences of volatile gas components in herbal medicines directly. EN sensor array forms different responding signals, which constructs the analysis basis of EN.
Sensor array optimization
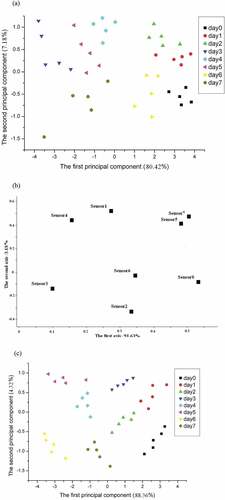
Loading analysis is the frequently used method for sensor contribution evaluation. It helps to recognize the contribution difference of each sensor. The larger loading value of a certain sensor, the more informative contribution of this sensor for detection. PCA results using eight gas sensors are displayed in ). The contributing rate of the first principal component is 80.42%, and the contributing rate of the second axis is 7.18%. The total contributing rate of two axes is 87.6%. We can see that shoots samples from 1 day overlap with the samples from another day. Therefore, it is difficult to discriminate all shoots samples stored for different days. Loading analysis results are displayed in ). The lateral axis is the first axis, and the vertical axis is the second axis. The contributing rate of the first axis is 91.63%, and the contributing rate of the second axis is 3.18%. The total contributing rate of two axes is 94.81%. According to coordinate positions of eight M.O.S gas sensors, sensor 1, sensor 2, sensor 3, sensor 4, sensor 6, and sensor 8 have better contributing rate for pattern recognition. Sensor 5 and sensor 7 present the similar properties. In order to increase the discrimination degree, signals of sensor 5 are removed from the sensor array responses. A new sensor array containing sensor 1, sensor 2, sensor 3, sensor 4, sensor 6, sensor 7, and sensor 8 is utilized for shoots quality analysis. ) displays the PCA results after sensor array optimization. The contributing rate of the first principal component is 88.36%, and the contributing rate of the second axis is 4.32%. The total contributing rate of two axes is 92.68%. All shoots samples under different storage time can be clearly discriminated. Results demonstrate that sensor array optimization helps to reduce the dispersion degree of the same samples, and improve the discriminating degree of different samples. This method is effective for shoots sample discrimination.
Figure 5. PCA results of bamboo shoots samples stored for 8 days: (a) PCA results of raw EN measurement data; (b) sensor array optimization results; (c) PCA results of optimized EN measurement data
Shoots quality discrimination
EN SNR data as function of measurement time are displayed in ). With the increase of measurement time, SNR of shoots samples increases gradually, and reaches the eigen peak (maximal values). After that, SNR curves rapidly decrease. SNR curves totally discriminate all the samples under storage time.
Figure 6. Winter bamboo shoots freshness determination model development: (a) stochastic resonance output SNR curve; (b) Shoots freshness determination model based on linear fitting regression of SNR eigen values
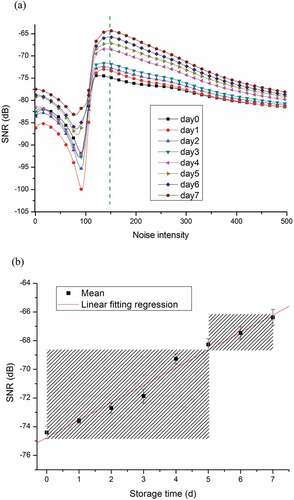
In ), the eigen peak values (SNRmax values) are selected to develop the shoots quality determination model. The SNRmax values increase with the increase of storage time. The linear fitting regression results are displayed in ) and Equation 6. In Equation 6, x denotes the storage time of shoots samples, and y denotes SNRmax value. After one step transform, EquationEquation 7(7)
(7) is used as the bamboo shoots quality analytical model.
(R2 = 0.98893) (6)
In order to judge actual quality of stored shoots samples, human sensory evaluation has been conducted to give a reference for EN analysis results. According to human sensory evaluation results, the samples in day4 present off-flavor odors, and the color is slightly dark. The taste is obviously not pleasant. Therefore, day 4 is the threshold time for shoots samples, as shown in .
Validating experiments
In order to evaluate the predicting accuracy of the developed model, validating experiments were conducted. Twelve shoots samples with unknown storage time were measured by EN. EquationEquation (7)(7)
(7) was used to compute the predicting value. Results are displayed in . The predicting accuracy of this model is 83.3%. The developed model predicts shoots quality with a high accuracy.
Table 2. Validating experiments results (√ = right; × = wrong; / = not calculated)
From the aspect of non-destructive analysis, EN technique is successfully introduced for winter bamboo shoots quality determination. EN generates different responding signals towards the samples. Sensor array optimization improves the sample discrimination level. The optimized sensor responses are input into SR model for SNR calculation. This method realizes the goal of shoots quality quantitative determination. The method proposed in this paper avoids some disadvantages against traditional detection method, such as time-consuming, fuzzy operation, and poor accuracy, etc. In the near future, we are carrying out a long-term plan to investigate the application of this method in quality evaluation for other Chinese herbal medicines.
Conclusion
In this paper, winter bamboo shoots quality determination using EN and sensor array optimization method were investigated. EN responses to shoots samples under different storage time were measured. A new sensor array containing sensor 1, sensor 2, sensor 3, sensor 4, sensor 6, sensor 7, and sensor 8 was utilized for shoots quality analysis. Sensor loading analysis results demonstrated that sensor array optimization helped to reduce the dispersion degree of the same samples, and improved the PCA discriminating degree of different samples. Non-linear SR was used for the optimized EN measurement data analysis. SR SNR eigen values quantitatively discriminated all samples. Bamboo shoots quality determination model (R2 = 0.98893) was developed by linear fitting regression of SNRmax values. Validating experiments results indicated that the developed model presented a quality-predicting accuracy of 83.3% for shoots samples discrimination. The proposed method provides a new way for bamboo shoot quality rapid evaluation, and is promising in agriculture quality rapid detection.
Acknowledgments
This work is financially supported by Scientific Research Project of National Natural Science Foundation of China (No. U1709212), Scientific Research Project of Zhejiang Province (Grant No. 2019C02075, LGG18F030012, LGG19F010012), Natural Science Foundation of Zhejiang Province (Grant No. LY19F030023), and College Student Research Programme of Zhejiang Province. Xiaoguo Ying has received research grant from Scientific Research Project of Zhejiang Province (Grant No. 2019C02075). Xiaomei Yi has received research grant from Scientific Research Project of Zhejiang Province (Grant No. LGG19F010012). Jian Li has received research grant from Scientific Research Project of Zhejiang Province (Grant No. LGG18F030012). Yuanyuan Gao has received research grant from Natural Science Foundation of Zhejiang Province (Grant No. LY19F030023). Xiaoguo Ying declares that he has no conflict of interest. Shanggui Deng declares that he has no conflict of interest. Xiaomei Yi declares that she has no conflict of interest. Jian Li declares that he has no conflict of interest. Chenning Shao declares that she has no conflict of interest. Xiaomei Yi declares that she has no conflict of interest. Yuanyuan Gao declares that she has no conflict of interest. Guohua Hui declares that he has no conflict of interest. All applicable international, national, and/or institutional guidelines for the care and use of animals were followed.
Additional information
Funding
References
- Nirmala, C.; Bisht, M. S.; Laishram, M. Bioactive Compounds in Bamboo Shoots: Health Benefits and Prospects for Developing Functional Foods. Int. J. Food Sci. Technol. 2014, 49, 1425–1431. DOI: 10.1111/ijfs.2014.49.issue-6.
- Yang, Q.; Duan, Z. B.; Wang, Z. L.; Kai-Hong, H. E.; Sun, Q. X.; Peng, Z. H. Bamboo Resources, Utilization and Ex-situ Conservation in Xishuangbanna, South-eastern China. J. For. Res. 2008, 19, 79–83. DOI: 10.1007/s11676-008-0015-6.
- Singhal, P.; Bal, L. M.; Satya, S.; Sudhakar, P.; Naik, S. N. Bamboo Shoots: A Novel Source of Nutrition and Medicine. Crit. Rev. Food Sci. Nutr. 2013, 53, 517–534. DOI: 10.1080/10408398.2010.531488.
- Satya, S.; Bal, L. M.; Singhal, P.; Naik, S. N. Bamboo Shoot Processing: Food Quality and Safety Aspect (a Review). Trends Food Sci. Technol. 2010, 21, 181–189. DOI: 10.1016/j.tifs.2009.11.002.
- Boonyuen, N.; Manoch, L.; Luangsa-ard, J. J.; Piasai, O.; Chamswarng, C.; Chuaseeharonnachai, C.; Ueapattanakit, J.; Arnthong, J.; Sri-indrasutdhi, V. Decomposition of Sugarcane Bagasse with Lignocellulose-derived Thermotolerant and Thermoresistant Penicillia and Aspergilli. Int. Biodeterior. Biodegrad. 2014, 92, 86–100. DOI: 10.1016/j.ibiod.2014.04.013.
- Hong, P.; Mengyang, Z.; Ziping, Y.; Jinsheng, Z.; Roger, R.; Yiqin W.; Yuhuan, Liu. Fractionation and Characterization of Hemicelluloses from Young Bamboo (phyllostachys Pubescens Mazel) Leaves. Carbohydr. Polym. 2013, 95, 262–271. DOI: 10.1016/j.carbpol.2013.03.007.
- Zhang, Y.; Ren, C.; Lu, G.; Cui, W.; Mu, Z.; Gao, H.; Wang, Y. Purification, Characterization and Anti-diabetic Activity of a Polysaccharide from Mulberry Leaf. Regul. Toxicol. Pharmacol. 2014, 70, 687–695. DOI: 10.1016/j.yrtph.2014.10.006.
- Vázquez-Araújo, L.; Chambers, E.; Funk, D. B. References for “musty” odor notes in sensory analysis of grain sorghum. J. Cereal Sci. 2011, 54, 460–466. DOI: 10.1016/j.jcs.2011.08.012.
- Olsson, J.; Börjesson, T.; Lundstedt, T.; Schnürer, J. Volatiles for mycological quality grading of barley grains: determinations using gas chromatography–mass spectrometry and electronic nose. Int. J. Food Microbiol. 2000, 59, 167–178.
- Kaya-Celiker, H.; Kumar Mallikarjunan, P.; Schmale, D. G.; Christie, M. E. Discrimination of moldy peanuts with reference to aflatoxin using FTIR-ATR system. Food Control. 2014, 44, 64–71. DOI: 10.1016/j.foodcont.2014.03.045.
- Jin, J. J.; Deng, S. G.; Ying, X. G.; Ye, X.; Lu, T. T.; Hui, G. H. Study of Herbal Tea Beverage Discrimination Method Using Electronic Nose. Food Meas. 2015, 9, 52–60. DOI: 10.1007/s11694-014-9209-0.
- Ye, X.; Jin, J. J.; Hui, G. H.; Yin, F. X.; Wang, M. M.; Huang, J.; Ying, X. G.; Deng, S. G. Determination of the Freshness of Beef Strip Loins (M. Longissimus Lumborum) Using Electronic Nose. Food Anal. Methods. 2014, 7, 1612–1618. DOI: 10.1007/s12161-014-9796-8.
- Liu, W.; Hui, G. H. Kiwi Fruit (actinidia Chinensis) Quality Determination Based on Surface Acoustic Wave Resonator Combined with Electronic Nose. Bioengineered. 2015, 6, 53–61. DOI: 10.4161/21655979.2014.979702.
- Berna, A. Z.; Lammertyn, J.; Saevels, S.; Natale, C. D.; Nicolaï, B. M. Electronic Nose Systems to Study Shelf Life and Cultivar Effect on Tomato Aroma Profile. Sens. Actuators B Chem. 2004, 97, 324–333. DOI: 10.1016/j.snb.2003.09.020.
- Jin, J. J.; Tang, X. X.; Cai, Y. P.; Han, Y. Y.; Wang, M. M.; Zheng, H. X.; Hui, G. H. Optimization of Eigenvalue Selection in Chinese Liquors Discrimination Based on Electronic Nose. Food Meas. 2014, 8, 270–276. DOI: 10.1007/s11694-014-9185-4.
- Jin, J. J.; Zheng, G. Y.; Ge, Y. Y.; Deng, S. G.; Liu, W.; Hui, G. H. A Non-enzyme Electrochemical Qualitative and Quantitative Analyzing Method for Glucose, D-fructose, and Sucrose Utilizing Cu Foam Material. Electrochim. Acta. 2015, 153, 594–601. DOI: 10.1016/j.electacta.2014.11.194.
- Torri, L.; Sinelli, N.; Limbo, S. Shelf Life Evaluation of Fresh-cut Pineapple by Using an Electronic Nose. Postharvest. Biol. Technol. 2010, 56, 239–245. DOI: 10.1016/j.postharvbio.2010.01.012.
- Natale, C. D.; Macagnano, A.; Martinelli, E.; Paolesse, R.; Proirtti, E.; D’Amico, A. The Evaluation of Quality of Post-harvest Oranges and Apples by Means of an Electronic Nose. Sens. Actuators B Chem. 2001, 78, 26–31. DOI: 10.1016/S0925-4005(01)00787-0.
- Hui, G. H.; Wang, L. Y.; Mo, Y. H.; Zhang, L. X. Study of Grass Carp (ctenopharyngodon Idellus) Quality Predictive Model Based on Electronic Nose. Sens. Actuators B Chem. 2012, 166-167, 301–308. DOI: 10.1016/j.snb.2012.02.066.
- Hui, G. H.; Wu, Y. L.; Ye, D. D.; Ding, W. W.; Zhu, L. S.; Wang, L. Y. Study of Peach Freshness Predictive Method Based on Electronic Nose. Food Control. 2012, 28, 25–32. DOI: 10.1016/j.foodcont.2012.04.025.
- Zhang, L.; Tian, F. C. A New Kernel Discriminant Analysis Framework for Electronic Nose Recognition. Anal. Chim. Acta. 2014, 816, 8–17. DOI: 10.1016/j.aca.2014.01.049.
- Dang, L. J.; Tian, F. C.; Zhang, L.; Kadri, C.; Yin, X.; Peng, X. W.; Liu, S. Q. A novel classifier ensemble for recognition of multiple indoor air contaminants by an electronic nose. Sens. Actuators A Phys. 2014, 207, 67–74. DOI: 10.1016/j.sna.2013.12.029.
- Guan, B. B.; Zhao, J. W.; Lin, H.; Zou, X. B. Characterization of Volatile Organic Compounds of Vinegars with Novel Electronic Nose System Combined with Multivariate Analysis. Food Anal. Methods. 2014, 7, 1073–1082. DOI: 10.1007/s12161-013-9715-4.
- Yin, Y.; Yu, H. C.; Chu, B.; Xiao, Y. J. A Sensor Array Optimization Method of Electronic Nose Based on Elimination Transform of Wilks Statistic for Discrimination of Three Kinds of Vinegars. J. Food Eng. 2014, 127, 43–48. DOI: 10.1016/j.jfoodeng.2013.11.017.
- Tian, X. J.; Wang, J.; Cui, S. Q. Analysis of Pork Adulteration in Minced Mutton Using Electronic Nose of Metal Oxide Sensors. J. Food Eng. 2013, 119, 744–749. DOI: 10.1016/j.jfoodeng.2013.07.004.
- Huo, D. Q.; Wu, Y.; Yang, M.; Fa, H. B.; Luo, X. G.; Hou, C. J. Discrimination of Chinese green tea according to varieties and grade levels using artificial nose and tongue based on colorimetric sensor arrays. Food Chem. 2014, 145, 639–645. DOI: 10.1016/j.foodchem.2013.07.142.
- Wei, Z. B.; Wang, J.; Zhang, W. L. Detecting Internal Quality of Peanuts during Storage Using Electronic Nose Responses Combined with Physicochemical Methods. Food Chem. 2015, 177, 89–96. DOI: 10.1016/j.foodchem.2014.11.064.
- Hui, G. H.; Jin, J. J.; Deng, S. G.; Ye, X.; Zhao, M. T.; Wang, M. M.; Ye, D. D. Winter Jujube (zizyphus Jujuba Mill.) Quality Forecasting Method Based on Electronic Nose. Food Chem. 2015, 170, 484–491. DOI: 10.1016/j.foodchem.2014.08.009.
- AOAC. Official Methods of Analysis, 17th ed.; Association of Official Analytical Chemists: Washington, 2002.
- Hui, G. H.; Mi, S. S.; Deng, S. P. Sweet and bitter tastants specific detection by the taste cell-based sensor. Biosens. Bioelectron. 2012, 35, 429–438. DOI: 10.1016/j.bios.2012.02.028.
- Hui, G. H.; Mi, S. S.; Chen, Q. Q.; Chen, X. Sweet and Bitter Tastant Discrimination from Complex Chemical Mixtures Using Taste Cell-based Sensor. Sens. Actuators B Chem. 2014, 192, 361–368. DOI: 10.1016/j.snb.2013.10.119.
- Hui, G. H.; Ji, P.; Mi, S. S.; Deng, S. P. Electrochemical Impedance Spectrum Frequency Optimization of Bitter Taste Cell-based Sensors. Biosens. Bioelectron. 2013, 47, 164–170. DOI: 10.1016/j.bios.2013.03.018.
- Wang, T. H.; Hui, G. H.; Deng, S. P. A Novel Sweet Taste Cell-based Sensor. Biosens. Bioelectron. 2010, 26, 929–934. DOI: 10.1016/j.bios.2010.06.049.
- Tian, Q.; Wang, W.; Miao, C.; Peng, H.; Liu, B.; Leng, F. W.; Dai, L.; Chen, F.; Bao, J. K. Purification, characterization and molecular cloning of a novel mannose-binding lectin from rhizomes of Ophiopogon japonicus with antiviral and antifungal activities. Plant Sci. 2008, 175, 877–884. DOI: 10.1016/j.plantsci.2008.09.008.
- Kopparapu, N. K.; Liu, Z. Q.; Fei, F.; Yan, Q. J.; Jiang, Z. Q. Purification and Characterization of a Chitinase (samc) with Antifungal Activity from Seeds of Astragalus Membranaceus. Process Biochem. 2011, 46, 1370–1374. DOI: 10.1016/j.procbio.2011.02.015.
- Yan, Q. J.; Jiang, Z. Q.; Yang, S. Q.; Deng, W.; Han, L. J. A Novel Homodimeric Lectin from Astragalus Mongholicus with Antifungal Activity. Arch. Biochem. Biophys. 2005, 442, 72–81. DOI: 10.1016/j.abb.2005.07.019.
- Monzote, L.; García, M.; Pastor, J.; Gil, L.; Scull, R.; Maes, L.; Cos, P.; Gille, L. Essential Oil from Chenopodium Ambrosioides and Main Components: Activity against Leishmania, Their Mitochondria and Other Microorganisms. Exp. Parasitol. 2014, 136, 20–26. DOI: 10.1016/j.exppara.2013.10.007.
- Kumar, R.; Mishra, A. K.; Dubey, N. K.; Tripathi, Y. B. Evaluation of Chenopodium Ambrosioides Oil as a Potential Source of Antifungal, Antiaflatoxigenic and Antioxidant Activity. Int. J. Food Microbiol. 2007, 115, 159–164. DOI: 10.1016/j.ijfoodmicro.2006.10.017.
- Yang, M.; Sun, J. H.; Lu, Z. Q.; Chen, G. T.; Guan, S. H.; Liu, X.; Jiang, B. H.; Ye, M.; Guo, D. A. Phytochemical Analysis of Traditional Chinese Medicine Using Liquid Chromatography Coupled with Mass Spectrometry. J. Chromatogr. A. 2009, 1216, 2045–2062. DOI: 10.1016/j.chroma.2008.12.003.
- Zhang, W. H.; Huang, Z.; He, L. Y.; Sheng, X. F. Assessment of bacterial communities and characterization of lead-resistant bacteria in the rhizosphere soils of metal-tolerant Chenopodium ambrosioides grown on lead–zinc mine tailings. Chemosphere. 2012, 87, 1171–1178. DOI: 10.1016/j.chemosphere.2012.02.036.
- Turgay, O. C.; G?Rmez, A.; Bilen, S. Isolation and Characterization of Metal Resistant-tolerant Rhizosphere Bacteria from the Serpentine Soils in Turkey. Environ. Monit. Assess. 2012, 184(1), 515–526. DOI: 10.1007/s10661-011-1984-z.