
 ?Mathematical formulae have been encoded as MathML and are displayed in this HTML version using MathJax in order to improve their display. Uncheck the box to turn MathJax off. This feature requires Javascript. Click on a formula to zoom.
ABSTRACT
During harvesting and storage, slight bruises on apple surface caused by impact, compression, vibration, or abrasion are inevitable. To find an appropriate method to identify the bruised apples at five stages (1 min, 1 day, 2 days, 3 days and 4 days after bruising), 108 Fuji apples were collected as samples. Hyperspectral images of apples covering the wavelength between 400 and 1000 nm were acquired by the SOC710-VP hyperspectral imaging system. The standard normal variate (SNV) method was utilized for smoothing and denoising of the original hyperspectral data. Classification models, including Extreme Learning Machine (ELM), Partial Least Squares Linear Discriminant Analysis (PLS-DA) and Classification and Regression Tree (CART), coupled with a variable selection method named Minimum Redundancy Maximum Relevance (mRMR), were built to identify the bruised apples. The results showed that the ELM models exhibited the best classification capability, with the mean correct classification rate of 95.97%. The bruised samples are easier to be identified over time. Minimum noise fraction (MNF) method was implemented to classify the bruised region of apples based on the selected wavelengths. The overall classification accuracy of MNF is 92.9%, which indicates that MNF is an effective method for identifying bruised regions of apples.
Introduction
During harvesting and storage, slight bruises on apple surface caused by impact, compression, vibration, or abrasion are inevitable[Citation1], which are similar to the color and texture of healthy apples and hard to be recognized with the naked eyes for a moment. Over time, the bruised tissues become darkened, soften, and dry. Damages on apple surface not only affect the appearance and taste, but also may infect other normal fruit, causing great economic losses.[Citation2] At present, manual sorting is the main method of fruit quality detection. It is time-consuming and greatly influenced by the subjective factors. In the manual sorting system, bruise is the primary reason why apples are classified as inferior. Hence, it is necessary to develop fast, nondestructive and efficient bruising detection methods.
In the past two decades, a range of nondestructive techniques, such as electrical impedance[Citation3], X-rays[Citation4], thermal imaging[Citation5], have been applied for bruise detection. However, these methods acquire data from a small area on a sample, which may lead to incorrect recognition. Machine vision[Citation6] is a branch of artificial intelligence (AI) and developing rapidly. It has the advantages of accurate detection of appearance features of samples including size, color, shape, and texture. More and more scholars and experts work at the domain of machine vision, yet there are still some challenges in terms of the detection of minor injuries, which cannot be found easily. Hyperspectral imaging[Citation7] is an emerging technology in recent years, which has the ability of providing both spatial and spectral information. It is advanced and efficient to not only detect non-obvious bruise of samples but also assess internal attributes of fruits such as soluble solid content, firmness, pH value. ‘Golden Delicious’ and ‘Pink lady’ apples were used by Ferrari et al.[Citation8] to detected early bruise. The spectral range is 400–1000 nm, and the modeling results equal to 92.42% and 94.04%, respectively. The detection of the number of days after bruising of apples using hyperspectral images (400–2500 nm) and linear logistic regression neural network models was researched by Baranowski et al.[Citation9] After pretreated by the second derivative method, the prediction accuracies higher than 90% were achieved. ElMasry et al.[Citation10] used PLS and stepwise discrimination analysis to select characteristic wavelengths, then the damaged areas were segmented by the image processing method. In addition to apples, other agricultural products such as white mushroom[Citation11], sliced potato[Citation12] and strawberry[Citation13] are also tested using hyperspectral technology.
From the above-mentioned works, it is obvious that there was very little attention on apple bruise at different damage time. The major objective of this study is to find an appropriate method to identify the bruised apples at five stages (1 min, 1 day, 2 days, 3 days, and 4 days after bruising). The research was conducted through:
Acquire hyperspectral images of sound apples and bruised apples at different time after bruising by hyperspectral image system covering the wavelength between 400 and 1000 nm.
Select characteristic wavelengths applying Minimum Redundancy Maximum Relevance (mRMR) method.
Develop Extreme Learning Machine (ELM), Partial Least Squares Discriminant Analysis algorithm (PLS-DA) and Classification and Regression Tree (CART) models based on full wavelengths and characteristic wavelengths, respectively, to classify bruised samples and sound samples.
Visualize the bruised area of apples based on Minimum noise fraction (MNF).
Materials and methods
Apple samples
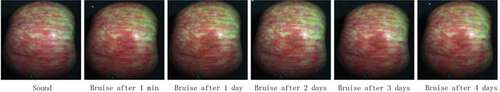
One hundred and eight Fuji apples with an equatorial diameter of approximately 9 cm and no obvious rottenness were purchased from a Fruit Wholesale Market in Wuxi China in July 2017. From the sample set, 54 samples were bruised in the middle area between stem and calyx artificially, and the rest were sound samples. Jiang et al.[Citation14] studied wavelength selection methods for detection of slight bruise on Korla pear based on hyperspectral imaging. Referring to their experiments, the apple was dropped from a height of 40 cm to a horizontal iron plate, and the slight bruise was made near the equatorial position of apple. The texture and color of the controlled early bruised areas were similar to those of the sound areas, which was difficult to recognize by naked eyes (). After being bruised, all samples were numbered and stored until the experiment was conducted. The temperature of the air-conditioned laboratory was controlled at 22°C and the relative humidity was 75%. Hyperspectral images at 1 min, 1 day, 2 days, 3 days, and 4 days after damaging were acquired for simulating the bruise cases at different times.
Figure 1. Sound and bruised samples of apples
Hyperspectral image acquisition system
depicts the schematic of the hyperspectral imaging system and hyperspectral 3D spectral image. The hyperspectral imaging system composed by the following three parts: (1) Imaging unit. A SOC710-VP portable visible light/near-infrared hyperspectral imager, adopting holographic diffraction technology and owning both unique built-in scanning and single lens dual CCD design, was used to collect hyperspectral images of samples. (2) Light source unit. Four halogen lamps (150 W) were fixed on four inner sides of the box to provide enough light for the experimental samples. (3) Transport unit. The height of the platform can be adjusted manually to get clear hyperspectral images. Furthermore, a computer with data acquisition software HyperScanner2.0 was indispensable. To reduce the interference from outside, hyperspectral image acquisition experiments were carried out in a light-lock chamber.
Figure 2. Schematic of the hyperspectral imaging system and hyperspectral 3D spectral image
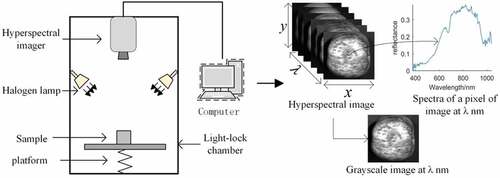
Hyperspectral images are stored in computers in the form of three-dimensional data (). Spatial location of a pixel is determined by (x,y), and λ represents the wavelength. From the perspective of images, hyperspectral image is composed of a set of gray-scale images. Each wavelength represents a 2D image. Based on the analysis of spectroscopy, every pixel is reflected as a continuous spectral response curve.
The hyperspectral imaging system collected spectral images of apples covering the wavelength between 400 and 1000 nm, and the spectral resolution is approximately 4.68 nm. Thus, each spectral image possesses 128 bands. A grayscale image at a given wavelength has 1392 × 1040 pixels. After adjustment, the exposure time of the camera and the scanning speed of the spectrograph were set at 25 ms and 30 lines per second, respectively.
Hyperspectral image calibration
For lowering the impact of dark current noise and inhomogeneity illumination intensity of the hyperspectral imaging system, relative reflectance of the original hyperspectral image was acquired using white and dark images based on Formula (1).
The R0(λ) and R(λ) in Formula (1) were the original uncorrected hyperspectral data and the calibrated hyperspectral data at λ wavelength, respectively. Rd was the full dark image (with 0% reflectance) obtained with the camera lens covered. Rw was the monochrome image with a reflectance of 99%.
Data processing and analysis
Data extraction and preprocessing: After the hyperspectral images were corrected, we used ENVI 5.3 software to extract spectral data. The grayscale images at the wavelength of 811 nm were used for the data extraction, which showed the optimal contrast visually. For sound samples, a rectangle around 100 pixels at the equator of the apples was selected as an ROI.[15] For bruised samples, the damage area is more than 100 pixels. Thus, a rectangle with an area of 100 pixels in the bruised region was selected as an ROI. For each band, the spectral reflectance of each pixel from ROI was extracted and averaged. Eventually, we got five datasets, named as Bruise_1min, Bruise_1day, Bruise_2days, Bruise_3days, and Bruise_4days. Every dataset contains 54 sound samples and 54 bruised samples. In addition to the essential information of apples, spectral noise is unavoidable, for instance, the effect of the instrument, operation, and the environment. Eliminating interference information is critical to improve the performance of the model. In this paper, standard normal variate (SNV) method[16] was used as a pretreatment for correcting spectral errors triggered by solid particle size and surface astigmatism.
Characteristic wavelength selection by mRMR: In the above sections, the average spectrum of apples was extracted and analyzed. Hyperspectral image combines traditional image with spectrum, which can provide a lot of information. The hyperspectral image used in our experiments covers the wavelength between 400 and 1000 nm and possesses 128 bands. However, many of these wavelengths are highly correlated. In order to reduce the amount of calculation and improve the accuracy of classification, characteristic wavelength selection is indispensable. Many methods for characteristic wavelength selection have been proposed, such as PLS, stepwise discrimination analysis[Citation10], correlation-based feature selection (CFS), mRMR[Citation17], combined competitive adaptive reweighted sampling (CARS)[Citation18], successive projection algorithm (SPA)[Citation19], uninformative variable elimination (UVE).[Citation20]
Minimum Redundancy Maximum Relevance is a filtering feature selection method that takes mutual information (MI) to define the relevance between the features.[Citation21] Peng et al. have proved that mRMR is an effective feature selection method.[Citation22] Given the features xi and the classification variable c, the mutual information of xi and c is computed according to the Formula (2):
where p(xi), p(c) are the marginal probabilities and p(xi,c) is the joint probability distribution of xi and c. However, the combination of features which provides large dependency on the target class does not increase the performance of the classifier. It is possible that the selected features are highly correlated, which leads to redundancy and affects the performance of the classifier.
The key idea of mRMR is to maximize the correlation between features and classification variables and minimize the correlation between features.[Citation23] Suppose that n-1 features have been selected and put into a set , the nth feature from the set
is defined as via MI:
where MI(xi;c) is the relevance of the individual feature xi to the class c alone, is the redundancy between two features
and xi.
Classification algorithm for sound and damaged apples: In this paper, ELM, PLS-DA, and CART were tested to determine which classification method provides the best performance. ELM[Citation24,Citation25] is a feedforward neural network with a single hidden layer. In the learning process, there is no need to adjust hidden layer nodes. PLS-DA[Citation26] is a multivariate statistical analysis method, and it can reduce the influence of multicollinearity among variables. CART is a binary decision tree, which produces only two sub-nodes after each feature segmentation operation. The performance of the model was evaluated with accuracy.
MNF for discrimination between bruised and sound tissue: MNF[Citation27] is a statistical analysis method designed to de-correlate and segregate any apparent noise in the noise-contained data based on noise covariance estimation. The principal components after MNF are sorted in descending order according to the signal-to-noise ratio, which overcomes the influence of noise on image quality. Baranowski et al.[Citation5] suggested MNF transform can get better segmentation effect and its components are suitable for image segmentation.
Results and discussion
Overview of spectra and images
The average spectral reflectance curves of sound apples and bruised apples at five stages (10 min, 1day, 2days, 3days and 4days after bruising) are shown in the left part of . It is noted that the trend of spectral reflectance curves of damaged samples is similar to that of sound samples. In general, the longer the sample is damaged, the lower the spectral reflectance is. In this spectral region (680–740 nm) the change of spectral reflectance is obvious, which is due to the red effect of plants. There is an absorption peak at 680 nm, this might be ascribed to the absorption of chlorophyll on the surface of the apple. 970 nm is a typical water absorption band, which is caused by the water content of the apple samples.[Citation28]
Figure 3. Average spectra reflectance and grayscale images at 811 nm of sound and bruised apples
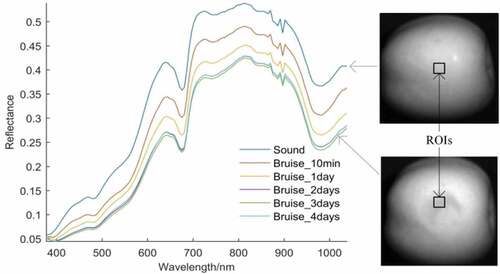
The right part in shows the grayscale images at 811nm of sound and bruised apples. The grayscale images at 811nm provided clear visual contrast between apple and background, because the difference between the reflectance of apples and that of background is the largest. In these two images, it can be found that the color of the bruise region is darker slightly than the sound region. Therefore, it is feasible to segment the damaged and sound areas of apples with a few image processing methods.
Optimal wavelength selected by the mRMR algorithm
Each pixel in a hyperspectral image has 128 values, representing reflectance at different wavelengths, which provides a wealth of information for the classification of the damaged apples. Nevertheless, the spectral wavelengths are relatively continuous and there is a remarkable resemblance between adjacent wavelengths. The duplicate data will not only cause redundancy but also affect the timeliness and accuracy of the multivariate analysis.
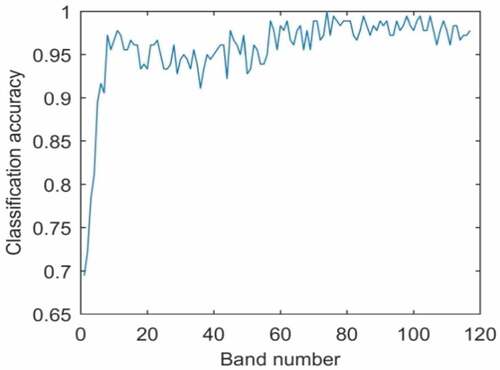
After preprocessing, we made use of the mRMR algorithm to obtain optimal wavelengths. mRMR selects those features with the highest relevance to the target class, and at the same time, they are also maximally dissimilar to the rest of the classes.[Citation21] Cen et al.[Citation23] detected internal defects of pickling cucumbers based mRMR waveband selection and the classification performance is well. In practice, ELM with strong generalization ability was used to build the classification model to determine the optimal wavelength subset. indicates the changing trend of the classification performance of the test set with the increase of selected bands. It can be seen from that, with the increase of the number of selected bands, there is a sharp rise in classification accuracy at first, then declines moderately, and finally increases slowly and tends to be stable. When the band number is 11, the classification accuracy of the test set is 97.78%. Although the classification accuracy is higher when the number of bands is 74, more calculations are needed. The selected wavelengths by mRMR are: 421.9, 481.8, 491.8, 603.3, 634.1, 639.2, 644.4, 649.5 659.9, 696.1, and 945.2 nm.
Figure 4. Classification performance vs. number of bands selected by mRMR
Classification by ELM, PLS-DA, and CART algorithm
We first divided the 108 samples into the training set and test set via Kennard-Stone (KS) method in a proportion of 2 to 1. Then the ELM, PLS-DA, and CART were applied to establish models to distinguish between the damaged apples and the sound apples. In practice, there are 20 neurons in the hidden layer, and we used the Sigmoid function as activation function. Besides, we used the genetic algorithm (GA) to optimize parameters to get better classification results. The number of latent variables (LVs) in PLS-DA models was determined by Monte Carlo Cross-validation (MCCV) method.
The classification results on full wavelengths are given in . ELM can get higher accuracy, and the mean correctly identified accuracy of the test set is 95.97%. Other two classifiers have slightly lower performance and give more than 90% of the overall accuracy. We note that even in the early stage of damage, the ELM model can achieve better classification accuracy. In addition, there is little difference in classification accuracy between different data sets when ELM was used as a modeling method. shows the classification accuracy on the optimum wavelengths by ELM, PLS-DA, and CART, and the mean accuracy of the test set is 95.94%, 93.33%, and 81.67%, respectively. Comparing with the results in , the mean accuracy of the ELM model and PLS-DA model fluctuated slightly. For Beuise_1min dataset, the accuracy of ELM increased from 94.86% to 95.69 while that of PLS-DA model is from 83.33% to 86.11%, raised by about 3%. CART models using full wavelengths showed higher precision than using optimum wavelengths. The average recognition accuracy of CART, modeling with optimum wavelengths, is 81.67%. It proves that CART is not good at dealing with bruised apple identification. Among the models based on five datasets, the ELM models exhibited the best classification capability. Mean accuracy of training set and test set of ELM models are 97.82% and 95.94%, respectively.
Table 1. Classification of samples based on ELM, PLS-DA and CART models using full wavelengths
Table 2. Classification of samples based on ELM, PLS-DA and CART models using optimum wavelengths
From both and we can find that the majority of models did not perform very well for classifying the samples just bruised. The results are in agreement with the conclusions of many researchers.[29] The chemical composition of apple with early bruise showed a slight change, in the meanwhile, the spectral reflectance had no noticeable change. With time going by, the content of reducing vitamin C, total sugar and sugar steadily decreased, which contributed to the change on spectral reflectance.[29] Hence, the bruised samples are easier to be identified over time.
Visualization of bruised area based on MNF
depicts the key steps for the whole experimental procedure. First, the hyperspectral images were collected by hyperspectral imaging system and calibrated using white and dark images based on Formula (1). Then we extracted the spectral data from ROIs. Nevertheless, the spectral wavelengths are relatively continuous and there is a remarkable resemblance between adjacent wavelengths. Therefore, the mRMR method was used to obtain optimal wavelengths, which contained most of the information provided by all wavelengths. Eleven wavelengths were selected, and the modeling results showed that they were efficient for apple bruise discrimination. The next operation was to apply the MNF method to classify the bruised region of apples based on the optimal wavelengths. The grayscale images at 811nm, which gave a clear visual contrast between apple and background, can be used to build a mask to eliminate the information of background. After that, a total of 11 characteristic images without background information were analyzed by the MNF method.
Figure 5. Flow diagram of the experimental procedure
shows the first three principal component images (denoted by MNF1 to MNF3) of the bruised sample after MNF transformation and the bruised area extracted from MNF3. MNF1 images of Sample 1 and Sample 2 clearly show the outline of the sample. And we note that the color of the middle area of the sample is different from that of the surrounding area, which is caused by the illumination inhomogeneity. Therefore, MNF1 images mainly described the outline information and uneven illumination distribution. MNF2 illustrated the appearance features, such as spots and textures. Compared with the sound region, the grayscale values of the damaged region are lower. However, there are a lot of grayscale values similar to it. Thus, it is difficult to segment the damaged area using MNF2. From MNF3 images can clearly distinguish the bruised tissues from sound tissues, which were used to segment bruised region.[30] Then, we applied OSTU to MNF3 images, the bruised area was extracted. Overall, the classification accuracy of MNF is 92.9%, which indicates MNF is an efficient method to identify the bruised regions of apples. Zhang et al.[Citation31] have studied the early detection rottenness in the apples by MNF, and the identification accuracy is 97.7%.
Figure 6. The first three principal component images (MNF1 to MNF3) gained using MNF
Conclusion
In this study, we find an appropriate method to identify the bruised apples at five stages (1 min, 1 day, 2 days, 3 days and 4 days after bruising). One hundred and eight Fuji apples were collected as samples. Hyperspectral images of both sound and damaged apples covering the wavelength between 400 and 1000 nm were acquired by the SOC710-VP hyperspectral imaging system. SNV was utilized for smoothing and denoising of the original hyperspectral data. For reducing data redundancy and computation overhead, mRMR was applied to selected characteristic wavelengths. After that, three different algorithms, ELM, PLS-DA, and CART, were tested to determine which classification method achieves the best performance. Among the models based on five datasets, the ELM models exhibited the best classification capability with the accuracy of 95.97% on the full wavelengths and 95.94% on the optimal wavelengths, respectively. Our experimental results are in agreement with many researchers’ viewpoints. It is that with the prolongation of damaging time, the classification accuracy increases gradually. To visualize the bruised area of apples, MNF and other traditional image processing methods were used. We found that MNF3 images can clearly distinguish the damaged area from the healthy area, offering high visual contrast. The overall classification accuracy of MNF is 92.9%, which indicates that MNF is an effective method for identifying bruised regions of apples. Overall, it is feasible to classify slight bruise on apples using hyperspectral images. In the research, we learned that the degree of apple bruise is an important indicator of apple quality evaluation. We will consider the degree of bruise as the research content in the follow-up experiments.
Disclosure statement
The authors declare no conflict of interest.
Additional information
Funding
References
- Leemans, V.; Magein, H.; Destain, M. F. On-line Fruit Grading according to Their External Quality Using Machine Vision. Biosyst. Eng. 2002, 83, 397–404.
- Dong, J.; Guo, W. Nondestructive Determination of Apple Internal Qualities Using Near-Infrared Hyperspectral Reflectance Imaging. Food Anal. Method. 2015, 8, 2635–2646.
- Cox, M.; Zhang, M. I.; Willison, J. H. Apple Bruise Assessment through Electrical Impedance Measurements. J. Hortic. Sci.. 1993, 68, 393–398.
- Kotwaliwale, N.; Weckler, P. R.; Brusewitz, G. H.; Kranzler, G. A.; Maness, N. O. Non-destructive Quality Determination of Pecans Using Soft X-rays. Postharvest Biol. Technol. 2007, 45, 372–380.
- Baranowski, P.; Mazurek, W.; Wozniak, J.; Majewska, U. Detection of Early Bruises in Apples Using Hyperspectral Data and Thermal Imaging. J. Food Eng. 2012, 110, 345–355.
- Zwiggelaar, R.; Yang, Q.; Garcia-Pardo, E.; Bull, C. R. R. Use of Spectral Information and Machine Vision for Bruise Detection on Peaches and Apricots. J. Agric. Eng. Res. 1996, 63, 323–331.
- Mehl, P. M.; Chen, Y.; Kim, M. S.; Chan, D. E. Development of Hyperspectral Imaging Technique for the Detection of Apple Surface Defects and Contaminations. J. Food Eng. 2004, 61, 67–81.
- Ferrari, C.; Foca, G.; Calvini, R.; Ulrici, A. Fast Exploration and Classification of Large Hyperspectral Image Datasets for Early Bruise Detection on Apples. Chemom. Intell. Lab. 2015, 146, 108–119.
- Baranowski, P.; Mazurek, W.; Pastuszka-Woźniak, J. Supervised Classification of Bruised Apples with respect to the Time after Bruising on the Basis of Hyperspectral Imaging Data. Postharvest Biol. Technol. 2013, 86, 249–258.
- ElMasry, G.; Wang, N.; Vigneault, C.; Qiao, J.; ElSayed, A. Early Detection of Apple Bruises on Different Background Colors Using Hyperspectral Imaging. LWT - Food Sci. Technol. 2008, 41, 337–345.
- Gowen, A. A.; O’Donnell, C. P.; Taghizadeh, M.; Cullen, P. J.; Frias, J. M.; Downey, G. Hyperspectral Imaging Combined with Principal Component Analysis for Bruise Damage Detection on White Mushrooms (agaricus Bisporus). J. Chemom. 2008, 22, 259–267.
- Su, W.; Sun, D. Potential of Hyperspectral Imaging for Visual Authentication of Sliced Organic Potatoes from Potato and Sweet Potato Tubers and Rapid Grading of the Tubers according to Moisture Proportion. Comput. Electron. Agric. 2016, 125, 113–124.
- Siedliska, A.; Baranowski, P.; Zubik, M.; Mazurek, W.; Sosnowska, B. Detection of Fungal Infections in Strawberry Fruit by Vnir/swir Hyperspectral Imaging. Postharvest Biol. Technol. 2018, 139, 115–126.
- Jiang, H.; Zhang, C.; He, Y.; Chen, X.; Liu, F.; Liu, Y. Wavelength Selection for Detection of Slight Bruises on Pears Based on Hyperspectral Imaging. Appl. Sci. 2016, 6(12), 450–458(9).
- Zhang, B.; Li, J.; Fan, S.; Huang, W.; Zhao, C.; Liu, C.; Huang, D. Hyperspectral Imaging Combined with Multivariate Analysis and Band Math for Detection of Common Defects on Peaches (Prunus persica). Comput. Electron. Agric. 2015, 114, 14–24.
- Barnes, R. J.; Dhanoa, M. S.; Lister, S. J. Standard Normal Variate Transformation and De-Trending of Near-Infrared Diffuse Reflectance Spectra. Appl. Spectrosc. 1989, 43, 772–777.
- Rivera, N. V.; Gómez-Sanchis, J.; Chanona-Pérez, J.; Carrasco, J. J.; Millán-Giraldo, M.; Lorente, L.; Cubero, S.; Blasco, J. Early Detection of Mechanical Damage in Mango Using Nir Hyperspectral Images and Machine Learning. Biosyst. Eng. 2014, 122, 91–98.
- Yu, K. Q.; Zhao, Y. R.; Liu, Z. Y.; Li, X. L.; Liu, F.; He, Y. Application of Visible and Near-infrared Hyperspectral Imaging for Detection of Defective Features in Loquat. Food Bioprocess. Technol. 2014, 7(11), 3077–3087.
- Fan, S.; Huang, W.; Guo, Z.; Zhang, B.; Zhao, C. Prediction of Soluble Solids Content and Firmness of Pears Using Hyperspectral Reflectance Imaging. Food Anal. Methods. 2015, 8, 1936–1946.
- Pu, Y. Y.; Feng, Y. Z.; Sun, D. W. Recent Progress of Hyperspectral Imaging on Quality and Safety Inspection of Fruits and Vegetables: A Review. Compr. Rev. Food Sci. Food Saf. 2015a, 14(2), 176–188.
- Wu, B.; Chen, C.; Kechadi, T. M.; Sun, L. A Comparative Evaluation of Filter-based Feature Selection Methods for Hyper-spectral Band Selection. Int. J. Remote Sens. 2013, 34, 7974–7990.
- Peng, H.; Long, F.; Ding, C. Feature Selection Based on Mutual Information: Criteria of Max-dependency, Max-relevance, and Min-redundancy. IEEE Trans. Pattern Anal. Mach. Intell. 2005, 27(8), 1226–1238.
- Cen, H.; Lu, R.; Ariana, D. P.; Mendoza, F. Hyperspectral Imaging-Based Classification and Wavebands Selection for Internal Defect Detection of Pickling Cucumbers. Food Bioprocess. Tech. 2014, 7, 1689–1700.
- Huang, G.; Zhu, Q.; Siew, C. Extreme Learning Machine: Theory and Applications. Neurocomputing. 2006, 70, 489–501.
- Li, W.; Chen, C.; Su, H.; Du, Q. Local Binary Patterns and Extreme Learning Machine for Hyperspectral Imagery Classification. IEEE Trans. Geosci. Remote 2015, 53, 3681–3693.
- Rozenstein, O.; Paz-Kagan, T.; Salbach, C.; Karnieli, A. Comparing the Effect of Preprocessing Transformations on Methods of Land-Use Classification Derived from Spectral Soil Measurements. IEEE J.-STARS 2015, 8, 2393–2404.
- Dadon, A.; Ben-Dor, E.; Karnieli, A. Use of Derivative Calculations and Minimum Noise Fraction Transform for Detecting and Correcting the Spectral Curvature Effect (smile) in Hyperion Images. IEEE Trans. Geosci. Remote 2010, 48, 2603–2612.
- Zheng, Y.; Lai, X.; Bruun, S. W.; Ipsen, H.; Larsen, J. N.; Løwenstein, H.; Søndergaard, I.; Jacobsen, S. Determination of Moisture Content of Lyophilized Allergen Vaccines by NIR Spectroscopy. J. Pharm. Biomed. 2008, 46, 592–596.
- Che, W.; Sun, L.; Zhang, Q.; Tan, W.; Ye, D.; Zhang, D.; Liu, Y. Pixel Based Bruise Region Extraction of Apple Using Vis-NIR Hyperspectral Imaging. Comput. Electron. Agric. 2018, 146, 12–21.
- Zhang, B.; Fan, S.; Li, J.; Huang, W.; Zhao, C.; Qian, M.; Zheng, L. Detection of Early Rottenness on Apples by Using Hyperspectral Imaging Combined with Spectral Analysis and Image Processing. Food Anal. Method. 2015, 8, 2075–2086.
- Zhang, B.; Huang, W.; Li, J.; Zhao, C.; Liu, C.; Huang, D. Detecting of Early Rottenness in Apples Using Hyperspectral Machine Vision with Effective Wavebands. Sens. Lett.. 2014, 12(3), 932-937(6). DOI: 10.1166/sl.2014.3135.