
 ?Mathematical formulae have been encoded as MathML and are displayed in this HTML version using MathJax in order to improve their display. Uncheck the box to turn MathJax off. This feature requires Javascript. Click on a formula to zoom.
ABSTRACT
Isoelectric precipitation was used to produce protein isolates (>90% protein contents) from three edible vegetable leaves. Amaranth (ALI), eggplant (ELI) and fluted pumpkin (FLI) leaf protein were isolated to study their conformational structures. Intrinsic fluorescence indicated a loose structural conformation for ELI at all the pH values, whereas FLI and ALI had more compact structures at pH 3.0 and pH 9.0. The surface hydrophobicity showed a greater distribution of hydrophobic amino acid groups of the protein isolates at the basic than the acidic regions. The SDS-PAGE results showed that the leaf isolates had similar polypeptide bonds characterized by 20, 25, 40 and 200 kDa and some distinct bands above 200 kDa. The ELI formed emulsions with significantly (p < .05) smallest oil droplet sizes (<3.3 µm) when compared to FLI and ALI. However, foaming capacity was mostly pH-dependent with significantly (p < .05) higher values at pH 7.0 and 9.0. The leaf protein isolates may be considered as potential functional food ingredients.
Introduction
Leafy vegetables have recently been acknowledged as low-cost sources of proteins, due to their ability to readily synthesize amino acids by utilizing sources such as sunlight, carbon dioxide and atmospheric nitrogen.[Citation1] Leafy vegetables such as amaranth (Amaranthus viridis) eggplant (Solanum macrocarpon), and fluted pumpkin (Telfaria occidentalis) are known cultivated specifically for food and are widely consumed as key sources of nutrients in most African diets because of their high fiber, mineral and vitamin contents.[Citation2] Due to the recognized nutritional and economic importance of these leafy vegetables, there has been a recent increase in their cultivation. The increased cultivation of these vegetables usually leads to yearly post-harvest losses because utilization of the leaves is limited to the preparation of household dishes that use freshly harvested leaves. Coupled with the absence of adequate storage facilities and lack of large-scale industrial utilization, these vegetable leaves are currently underutilized.[Citation3]
The leaf protein contents (dry weight basis) of amaranth (23.64%), eggplant (24.90%) and fluted pumpkin (32.82%) have been previously reported.[Citation4] The relatively high protein contents of these leafy vegetables suggest their potentials as sources of protein for the food industry. However, proteins to be adequately utilized in food systems, an understanding of their structural and functional properties is required. This is because protein functionality such as solubility, water or oil absorption capacity, as well as emulsifying, foaming or gelation properties will determine specific uses in food formulation. Likewise, the structural conformations of these proteins are important in determining their behavior in various food matrices. Several important structure-function properties responsible for the utilization of food proteins have been reported. These properties depend on environmental factors such as their ionic strength, solute-solvent concentrations and temperature .[Citation5–Citation7] An understanding of the structure and function of proteins will provide information on how to manipulate a protein of interest to suit the right purpose in the desired food system. Previous works have reported the functional properties of dried alfalfa leaf protein, alfalfa leaf soluble proteins, and the sonicated and non-sonicated functional properties of Diplazium esculentum leaf protein concentrate.[Citation8–Citation11] In contrast, knowledge of the structure and functionality of amaranth, fluted pumpkin and eggplant leaves is still limited. Therefore, the aim of this study was to isolate proteins from the dried leaves of amaranth, fluted pumpkin and eggplant. The isolated proteins were then evaluated for some functional and structural properties.
Materials and methods
Materials
Fresh fluted pumpkin, amaranth and eggplant leaves were obtained from the Teaching and Research Farms of Obafemi Awolowo University, Ile-Ife, Nigeria. The leaves were authenticated by the Department of Crop Production and Protection of the Faculty of Agriculture, Obafemi Awolowo University, Ile-Ife, Osun State, Nigeria. All chemicals used for the research were of analytical grade and purchased from Fischer Scientific (Oakville, ON, Canada).
Preparation of dried leaf powders
Vegetable leaf powders were prepared following the method described by [Citation8] Fresh vegetable leaves were sorted, de-stalked and rinsed with water, and dried using a hot air oven (Uniscope SM9053 Laboratory Oven, Singerfried, England) at 55 ± 2°C for 8 h. The dried leaves were milled to powder using a laboratory blender (VLC sapphire grinder, IS-4930, England). In order to remove chlorophylls and the other polyphenolic compounds, the leaf powders were extracted with acetone at a ratio of 1:10 (leaf power to acetone), stirred continuously for 2 h, before filtering using a muslin cloth. The acetone extraction was repeated using the residue collected and the final residue obtained was air-dried in a fume hood at room temperature for 48 h, packaged as the vegetable powder and stored at −20°C.
Preparation of leaf protein isolates
The leaf protein isolates were prepared using the combined methods described by [Citation8,Citation12] with modifications. A 5% (w/v) suspension of each leaf powder in deionized water was continuously stirred for 1 h at 37°C and pH 10.0. The solution was then centrifuged at 3500 x g for 30 min at 4°C. The supernatant was collected and adjusted to pH 4.5 (based on a preliminary experiment that indicated the least solubility at this pH value) using 2 M HCl and stirred for 20 min. The precipitate obtained after centrifugation was washed twice with distilled water to remove salt, re-dispersed in deionized water and freeze-dried to obtain amaranth leaf isolate (ALI), eggplant leaf isolate (ELI) and fluted pumpkin leaf isolate (FLI). The total protein content was determined using the modified Lowry method with bovine serum albumin as the standard. The total protein content was determined using the modified Lowry method with bovine serum albumin as the standard[Citation13]. The gross and protein yields were calculated as follows:
Amino acid composition analyzes
Protein isolates were hydrolyzed for 24 h with 6 M HCl solution, the digest filtered through 0.2 µm discs followed by HPLC Pico-Tag determination of each amino acid in the filtrate.[Citation14] Samples were separately digested with performic acid prior to HPLC analysis to determine sulfur-containing amino acids.[Citation15] Tryptophan contents were estimated by the HPLC method after alkaline hydrolysis of the samples.[Citation16]
Intrinsic fluorescence emission
The intrinsic fluorescence spectra of the protein isolates were determined as described by [Citation17] on a Jasco FP-6300 spectrofluorometer (Jasco Inc., Tokyo, Japan) at 25°C using a 1 cm path length cuvette. Sample stock solutions (10 mg protein/mL) were prepared with appropriate buffers (pH 3.0, 5.0, 7.0 and 9.0), centrifuged (18000 x g for 30 min at room temperature) and the supernatant analyzed for protein content. Each supernatant was diluted to 0.002% (w/v) and the fluorescence spectrum measured at 280 nm excitation wavelength and 290–500 nm emission range. Final spectra were obtained after subtraction of the buffer blanks from those of the respective samples.
Surface hydrophobicity
Surface hydrophobicity was determined by a hydrophobicity fluorescence probe, using the 1-anilino-8-nephtalene sulfate (ANS) method as described by[Citation18] with some modifications. Briefly, protein isolates were serially diluted to a final concentration of 50–250 µg/ml in appropriate buffers at different pH values (3, 5, 7 and 9). 20 µL of ANS (8.0 mmol/L) in 0.01 M phosphate buffer, pH 7.0 was added to 4.0 ml of each dilution and fluorescence intensity (FI) was measured with a fluorescence-spectrophotometer (JASCO-FP-6300) at excitation and emission wavelengths of 390 nm and 470 nm, respectively. The slope of the FI versus protein isolate concentration plots was calculated by the linear regression and used as an index of surface aromatic hydrophobicity of the protein isolates.
Sodium dodecyl sulfate-polyacrylamide gel electrophoresis (SDS-PAGE)
SDS-PAGE (reducing and non-reducing condition) was carried out according to the method described by[Citation19]. Protein samples were each dispersed (10 mg protein/ml) in Tris/HCl buffer, pH 8.0 containing 10% (w/v) SDS only (non-reducing buffer) or SDS + 10% (v/v) β-mercaptoethanol (reducing buffer), and heated at 95°C for 10 min, cooled and centrifuged (10000 x g, 15 min). After centrifugation, 10 µl of the supernatants were loaded onto an 8–25% gradient gel and electrophoresis was performed using the Phastsystem Separation and Development units according to the manufacturer’s instructions (GE Healthcare, Montreal, PQ, Canada). A mixture of protein standards (10–200 kDa) was used as the molecular weight marker and the gels were stained with Coomassie brilliant blue. The dry gels were imaged and annotated using a calibrated Labscan and image TL software coupled to a GEhealth scanner.
Circular dichroism (CD)
Secondary and tertiary structures were measured by CD at 25°C in a J-810 spectropolarimeter (Jasco Inc., Tokyo, Japan) using the spectral range of 190–240 nm (far-UV) and 250–320 nm (near-UV), respectively.[Citation20] Protein stock solutions (10 mg/mL) were obtained by mixing in the respective buffers, centrifuged and supernatant protein concentration estimated by the modified Lowry method.[Citation13] The supernatants were then diluted with the buffer to give 2 and 4 mg/mL protein concentrations for far-UV (0.05 mm cuvette path length) and near-UV (1 mm cuvette path length). Each final CD spectrum represents the mean of triplicate scans from which the buffer spectra have been subtracted.
Protein solubility (PS)
The method described by [Citation21] was used to determine PS of the samples. Samples (10 mg, protein weight basis) were prepared in 1 mL of buffer solutions at different pH values (3.0, 5.0, 7.0 and 9.0) and mixed properly by vortexing for 1 min followed by centrifugation (10000 × g; 20 min; room temp). The supernatant was collected and analyzed for protein content according to the modified Lowry method.[Citation13] In order to determine total protein content, samples were dissolved in 0.1 M NaOH solution and used for Lowry analysis. PS was calculated as percentage ratio of protein contents at different pH values to the total protein content.
Emulsifying capacity and stability
Oil-in-water emulsions were prepared according to the method described by[Citation22] with slight modifications. Samples were dispersed in appropriate buffers (pH 3.0, 5.0, 7.0 and 9.0) on protein weight basis (5, 10, 20 mg/mL) and 20% pure canola oil added followed by homogenization at 20000 rpm for 2 min, using the 20 mm shaft on a Polytron PT 3100 homogenizer. Oil droplet size distribution of the emulsions was measured with a Mastersizer 2000 (Malvern Instruments Ltd., Malvern, U.K.) using distilled water as dispersant. Under constant shearing, the emulsion to about 100 mL of water contained in the wet sample dispersion unit (Hydro 2000 S) to obtain the required obscuration level. Triplicate determinations of the surface weighted mean (d3,2) of oil droplet sizes were performed for each emulsion to estimate emulsifying capacity (EC). To determine emulsion stability (ES), samples were stored at room temperature for 30 min without agitation followed by measurement of the oil droplet size.
Foaming properties
The method of [Citation22] was adopted to estimate foaming properties. Samples (10, 20, or 30 mg/mL, protein weight basis) were prepared in 50 mL graduated centrifuge tubes containing appropriate buffers (pH 3.0, 5.0, 7.0, and 9.0), followed by homogenization (20000 rpm for 1 min) using a 20 mm foaming shaft on the Polytron PT 3100 homogenizer (Kinematica AG, Lucerne, Switzerland). Foaming capacity (FC) was then calculated using the following equation:
The foams were left to stand at room temperature for 30 and the foam volume measured again and expressed as a percentage of the original foam volume to give the foam stability (FS).
Statistical analysis
Analyzes were carried out in triplicates and data presented as means ± standard deviation. The two-way analysis of variance post hoc test was carried out with the Duncan’s Multiple Range test at (p < .05) using a Statistical Analysis Software (SAS version 9.1) software.
Results and discussion
Protein contents, gross and protein yields of the isolates
There were no significant differences (p > .05) between the protein contents (96.63%, 96.85%, and 95.81%) or protein yields (17.11%, 18.26%, and 15.85%) of the isolates for ALI, ELI and FLI, respectively. However, the protein contents are higher than the 59.6% reported for dried alfalfa leaf isolate[Citation8] and 89.5% for hawk tea leaf isolate.[Citation23] The high protein contents indicate the efficiency of the use of acetone as a pre-treatment step to remove chlorophylls. Moreover, multiple washing of the precipitated protein isolate to remove soluble contaminants and phenolic remnants could also have contributed to the high protein contents. The low yield (<20%) of the protein isolates could be due to the high hydrophobic character of leaf proteins[Citation24] which could encourage protein-aggregation that leads to reduced solubility in aqueous solutions. Another reason for the low yield could be the difficulty in releasing proteins from intact leaf cells. This is because it has been suggested that pre-treatment of leaves with maceration could enhance cell rupture and promote increased recovery of the proteins.[Citation23]
Amino acid composition
Amino acids are the building blocks for proteins and are important in determining protein quality. The essential amino acids (EAA) are required in the diet because they cannot be synthesized in the human body. As shown in , the EAA of the protein isolates were 42.92%, 41.27% and 44.25% respectively, for ALI, ELI and FLI, making them high-quality sources of proteins. The composition of valine, leucine, tyrosine, histidine and lysine of the leaf isolates presented in percentages is higher than the [Citation25] daily recommended levels for adults and children. The tryptophan contents of all the leaf isolates are also higher than the 1.2% reported for alfalfa leaf protein concentrate[Citation8] but comparable to 1.65% for wonderful cola protein.[Citation22]The glutamic + glutamine contents ranged between 11.08% and 12.42% and are comparable with values reported for alfalfa[Citation8] and wonderful cola[Citation22] protein concentrates. The hydrophobic amino acids (HAA) have been found to be very crucial to the structural behaviors of amino acids and therefore, crucial to the structural properties of proteins.[Citation26–Citation28] The HAA obtained for ALI, ELI and FLI are 45.33%, 45.38% and 46.64% respectively, which are similar to that of cashew nut protein isolate[Citation9] and higher than those of rapeseed protein isolates.[Citation7] This could be a contributing factor to the functionality of the leaf isolates.
Table 1. Amino acid composition (%) of vegetable leaf protein isolates
SDS-PAGE
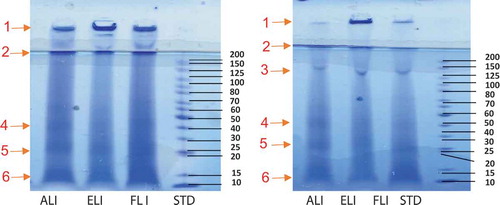
The non-reducing and reducing SDS-PAGE electrophoresis gels of the leaf protein isolates are shown in ,, respectively. The polypeptide composition of the three leaf isolates (ALI, ELI and FLI) was similar and characterized by highly stained diffused bands, which could be attributed to low solubility of the proteins in the electrophoresis buffer. The reduced staining intensity might also be due to the highly hydrophobic nature of leaf proteins, which would limit interactions with the charged sulfonic groups of the Coomassie blue dye. This characteristic of low protein solubility also was observed during gel electrophoresis characterization of dried alfalfa leaf proteins.[Citation8] Four main polypeptide bands; 20, 25, 40 and >200 kDa (labeled as bands 4, 5, 6, and 2, respectively) were observed in the non-reducing gel of the protein isolates (). The high hydrophobic character of the leaf proteins may also have led to a high degree of polymerization, which was reflected as the high molecular weight protein band #1 that could not enter the gel. In contrast, the reducing (with β-mercaptoethanol) SDS-PAGE gel had an extra distinct band at ~130 kDa (band #3), which could be attributed to the breaking up of the disulfide bonds from the high molecular weight (>200 kDa) proteins (). This is supported by the decreased intensity of the >200 kDa bands in the reducing gel.
Figure 1. Non-reduced (a) and reduced (b) SDS-PAGE of amaranth (ALI), eggplant (ELI) and fluted pumpkin (FLI) leaf protein isolates.
Intrinsic fluorescence emission
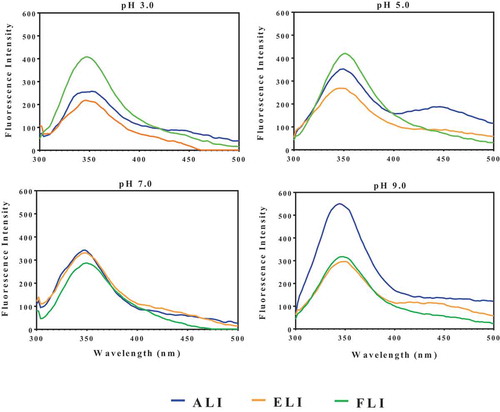
The intrinsic fluorescence spectra of proteins provide useful information on structural conformation of proteins in solutions and may be used to determine the three-dimensional folding pattern.[Citation29] As shown in , FI was dependent on pH values, which reflects the environmental influence on protein structural conformation. FI was highest for ALI at pH 9.0, while ELI and FLI had highest values at pH 7–9 and pH 3.0, respectively. Therefore, the results suggest ALI and ELI had more compact structural arrangements in neutral and alkaline environments than in acidic environments. In contrast, the FLI was more compact with least environment-induced fluorescence quenching at acidic pH values. For ALI, there was a blue shift in wavelength of maximum FI λmax from 352 nm at pH 3.0 to 344 nm at pH 9.0, which indicates gradual movement of the hydrophobic residues into the protein interior and away from the hydrophilic environment as acidity decreased. In contrast, a red shift (346 to 350 nm) occurred for ELI when the environment changed from pH 3.0 to pH 9.0, respectively. The behavior of FLI was slightly different with a λmax of 348 nm at pH 3.0, which increased to 352 nm at pH 5.0 followed by decreases to 350 and 348 nm at pH 7.0 and 9.0, respectively. Overall, the ALI experienced the widest environment-induced λmax changes (structural rearrangements), which is also reflected in the large variation in FI (258–550) when compared to 219–297 for ELI and 318–420 for FLI. The λmax values indicate that tryptophan fluorescence was the major contributor to the observed FI, which is consistent with previous reports for other plant proteins.[Citation22,Citation30]
Figure 2. Fluorescence intensity of amaranth (ALI), eggplant (ELI) and fluted pumpkin (FLI) leaf protein isolates.
Secondary and tertiary structures
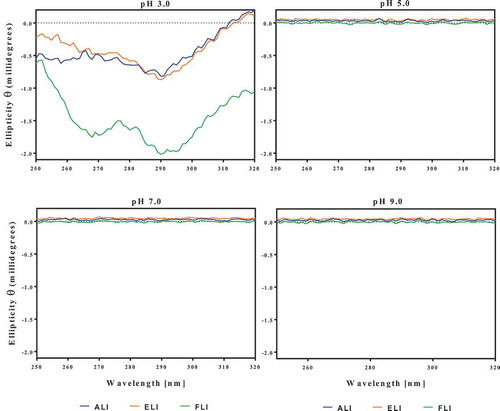
The CD data indicate that the leaf proteins lacked defined secondary structures at pH 3.0, which was ameliorated as the pH increased (). At pH 5.0, the ellipticity at 190–195 nm indicates the presence of some β-sheet structure while the 200–220 nm indicates α-helix strands.[Citation29] At pH 7.0 and 9.0, the intensity of the 190–195 nm and 200–220 bands increased substantially, which indicates increases in the β-sheet and α-helix strands. In contrast, the leaf proteins had discernible tertiary structures only at pH 3.0 as shown by the absence of ellipticity when pH increased to 5.0, 7.0, and 9.0 (). Increases in protein concentration did not change the spectra. Therefore, the results suggest that the FLI in particular contained aromatic residues (especially tyrosine and tryptophan) located within nonpolar environments at pH 3.0. Increases in pH led to the destabilization of the protein structure such that the aromatic groups were shifted to polar or non-chiral regions of the molecules.[Citation29]
Figure 3. Far-UV circular dichroism spectra of amaranth (ALI), eggplant (ELI) and fluted pumpkin (FLI) leaf protein isolates.
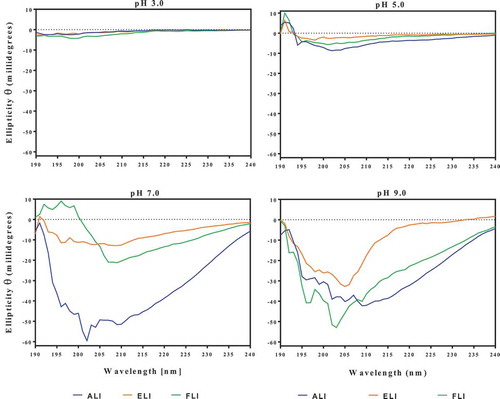
Figure 4. Near-UV circular dichroism spectra of amaranth (ALI), eggplant (ELI) and fluted pumpkin (FLI) leaf protein isolates pH-dependent solubility profiles of amaranth leaf protein isolate (ALI), eggplant leaf protein isolate (ELI) and fluted pumpkin leaf isolate (FLI).
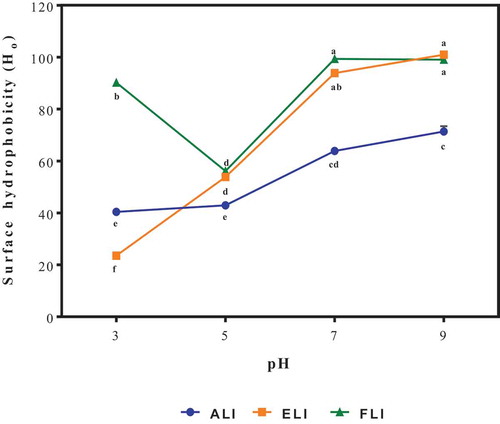
Surface hydrophobicity (Ho)
The surface hydrophobicity (Ho) of proteins is an important surface-related parameter that predicts functional behaviors such as solubility (hydrophobic or hydrophilic), emulsifying and foaming properties in food systems.[Citation31] The Ho of the protein isolates at different pH values (3.0, 5.0, 7.0 & 9.0) is shown in . The Ho values for ALI and ELI were significantly increased with increasing pH (3.0–9.0) while the FLI had its lowest Ho at pH 5.0 and the Ho at pH 7.0 and 9.0 was higher than pH 3.0. [Citation31] also observed that Ho of commercial canola proteins mixed with guar gum was higher at the basic region than at the acidic region. These might be due to the higher solubility and hence unfolding of the protein globular structures in a high pH environment. The decrease in the Ho of FLI at pH 5.0 could be because pH 5.0 was the region of highest protein aggregation for FLI and hence the interaction with ANS was the least at this pH due to decreased exposure of hydrophobic groups. The results obtained in this study show that the three leaf protein isolates had similar polypeptide composition, which was not affected by the species of the leaves.
Figure 5. Surface hydrophobicity of amaranth (ALI), eggplant (ELI) and fluted pumpkin (FLI) leaf protein isolates.
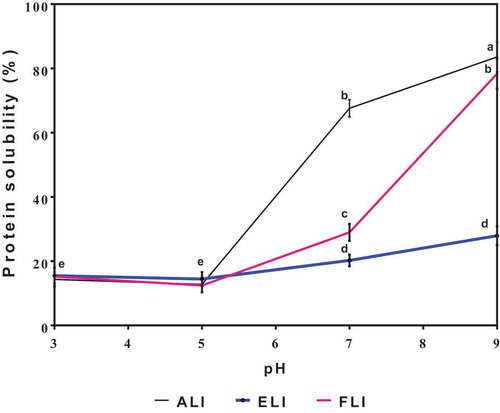
Protein solubility (PS)
shows that the leaf proteins were least soluble at pH 3.0–5.0, while significant (p < .05) increases occurred at pH 7.0–9.0. A previous work also reported that alfalfa proteins had <20% PS at pH 3.0 and 4.0 with increased values at pH >6.0[Citation8] which is similar to the results obtained in this work. The PS pattern is different from the usual ‘U’ shaped profile that has been associated with several plant proteins. At pH 7.0 and 9.0, ALI and FLI had significantly (p < .05) higher PS than ELI, which indicates differences in the conformation of the leaf sample proteins. Specifically, the low PS of ELI suggests stronger protein aggregation that was not remedied by the increases in pH of the environment. Protein aggregation in the acidic region affects the protein solubility of proteins around their isoelectric points due to increased protein–protein interactions and reduced protein–water interactions. However, below or above the isoelectric point, the solubility should increase due to the increased net charge that facilitates protein-unfolding, reduction in protein–protein interactions and increased protein–water interactions[Citation32] In this work, there was a significant benefit to PS when pH was above the isoelectric point but not when the pH was reduced.
Figure 6. pH-dependent solubility profile of amaranth (ALI), eggplant (ELI) and fluted pumpkin (FLI) leaf protein isolates.
Emulsion properties
shows the ability of the protein isolates at different concentrations to form emulsions (oil droplet size) and stabilize them against creaming (emulsion stability). Therefore, smaller oil droplet sizes are indicators of good emulsion formation capacity.[Citation12] The oil droplet size of the emulsions was 3.69–26.90 µm, 2.36–23.85 µm and 3.64–14.32 µm for ALI, ELI and FLI, respectively, across the different pH and protein concentration values. The smallest oil droplet sizes observed for ALI (3.80 µm), ELI (2.36 µm) and FLI (3.64 µm) were all formed at 20 mg/mL, which indicates the importance of protein concentration during emulsion formation. Unlike the other two protein isolates, ELI had a consistent pattern whereby emulsion oil droplet size decreased as pH value increased. The positive influence of pH increase on the quality of ELI emulsions may be due to the low PS () coupled with the poor structural conformations at pH 3.0 and 5.0 (). Therefore, at pH 7.0 and 9.0, where the net charge is likely to be slightly negative, protein-protein repulsions may have enhanced the formation of loose and flexible polypeptides with better oil droplet encapsulation capacity than at pH 3.0 and 5.0 where the polypeptides are more likely to be less flexible. In contrast, the ALI and FLI have higher protein solubility properties at pH 7.0 and 9.0 where the increased net charges may have limited interfacial film formation; hence, the alkaline environment had no positive effect relative to the acidic environment.
Figure 7. Effect of pH and protein concentration on oil droplet size (d3,2) and emulsion stability (%) of amaranth (ALI), eggplant (ELI) and fluted pumpkin (FLI) leaf protein isolates.
The influence of leaf protein concentrations at different pH values on emulsion stability (ES) over a 30-min time period is also presented in . ES values ranged between 1.50% and 96.91%, 6.55% and 98.74%, and 13.14% and 87.99%, respectively, for ALI, ELI and FLI across all pH values and sample protein concentrations. On the average, the highest emulsion stability was obtained at 20 mg/mL for ALI (96.91%) and at 5 mg/mL for ELI (98.74%) and FLI (88.61%). FLI had good emulsion stability at pH 9.0 (79.66–96.91%) at all the protein concentrations tested. However, the ELI-stabilized emulsions had least solubility at acidic pH irrespective of the protein concentration, which suggests reduced capacity to form thick interfacial films or absence of sufficient electronic repulsive forces to prevent oil droplet coalescence when compared to pH 7.0 and 9.0 emulsions. All the emulsions formed at acidic pH with 5 mg/mL protein concentration had higher ES than those produced with higher concentrations. The results suggest that the poor solubility at pH 3.0 and 5.0 may have led to increased protein aggregation at higher concentrations, which prevented the formation of strong interfacial films. The oil droplet sizes also played a role in the stability of the emulsions. Generally, the smaller the oil droplet size, the higher the percentage stability except for FLI especially 10 mg/mL at pH 9.0 and the 20 mg/mL emulsions at pH 3.0–7.0, which could be attributed to aggregation of protein at the oil–water interface, leading to a breakdown of the emulsion equilibrium.
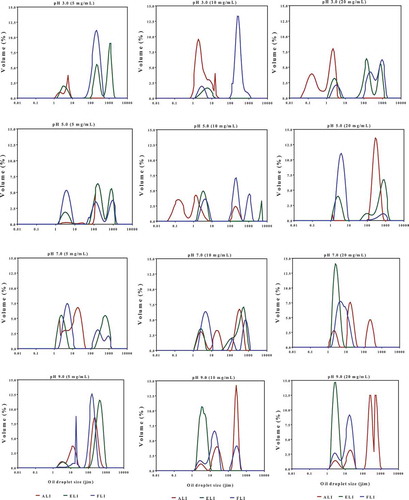
The oil droplet size distribution provides information on the range of emulsified particles and can be used to estimate emulsion quality. At all the pH values used in this work, increase in protein concentration resulted in higher volume of large oil droplets with changes from mono or bimodal to trimodal distribution for some of the emulsions (). This influence of protein concentration on the increased formation of big oil droplet sizes was most notable for ALI-stabilized emulsions. In contrast, at each protein concentration, increase in pH produced different changes in the oil droplet size distribution, which are consistent with the observed mean values of the emulsified particle sizes.
Figure 8. Oil droplet size distributions of emulsions formed with amaranth (ALI), eggplant (ELI) and fluted pumpkin (FLI) leaf protein isolates.
Foam capacity and foam stability
The foaming capacities (FC) and foam stabilities (FS) of the leaf protein isolates as functions of the sample protein concentrations and pH values are presented in . For all samples, the FC values are higher at pH 7.0 and 9.0 than at acidic pH. The results are consistent with increased net charge at neutral and alkaline pH, which would increase protein-protein repulsions and lead to increased protein flexibility. As the proteins become more flexible, there is increased capacity to encapsulate air bubbles, hence the positive effect of increased pH on FC of the protein isolates. The results are similar to those reported for the foaming capacities of walnut protein isolates and Fenugreek protein concentrate[Citation26,Citation33] which were attributed to the presence of more charges at the higher pH values and leading to increased solubility.
Foam stability is the ability of the foam to maintain its shape and volume over a period of time, which is a desirable property in some beverages and food products such as beers, craft coffees, and baked goods. The foam stability (FS) values of the leaf protein isolates are presented in . The FS ranged from 49.74% to 96.44%, 49.75% to 91.11% and 12.90% to 100%, respectively, for ALI, ELI and FLI. There were differences in FS according to pH and protein concentration as well as the protein isolates type. For example, ELI at 10 mg/mL and FLI at 30 mg/mL formed foams with the least stability at pH 3.0 but the values increased at pH 5.0–9.0. Such a pattern suggests the formation of strong interfacial membranes or increased charged on the membranes, which prevented coalescence of the foam particles. In contrast, an opposite pattern was observed for FLI at 10 and 20 mg/mL and ELI at 30 mg/mL, which indicates the formation of weak interfacial membranes as pH increased.
Conclusion
This study reported the production and potential functionality of protein isolates from three leafy vegetables. The low protein yield reflected the high hydrophobic and aggregation propensity of leaf proteins, which reduces solubility during aqueous extraction. The presence of high levels of branched-chain amino acids suggested potential contributions of the leaf isolates to healthy human body development and tissue maintenance. Intrinsic fluorescence data suggested that the protein conformation was highly pH-dependent but the ELI had the least rigidity, which was consistent with reduced solubility at pH 7.0 and 9.0 when compared to FLI and ALI. The FLI had high structural rigidity at acidic pH, which reduced at pH 7.0 and 9.0 while ALI showed the most rigid structure at pH 9.0. The surface hydrophobicity data showed a greater distribution of hydrophobic amino acid groups of the protein isolates at the basic than the acidic regions. The polypeptide composition of the three leaf isolates (ALI, ELI and FLI) was similar and characterized by highly stained diffused bands. The diffused bands may be attributed to the proteins being insoluble in the electrophoresis buffer. The three protein isolates had poor solubility at acidic pH values, which suggested aggregation; this was ameliorated at pH 7.0 and 9.0. Emulsion quality, which was measured as oil droplet size and stability, was improved at pH 7.0 and 9.0, especially for the ELI, which is consistent with the contributions of increased solubility to enhanced structural flexibility and charge density. Foaming capacity was also positively influenced by pH increases whereas foam stability was also dependent on protein type and concentration. The ability of the leaf protein isolates to form emulsions and foams demonstrates their potentials to act as functional ingredients in food systems, which could enhance their incorporation into traditional or novel foods.
Figure 9. Effect of pH and protein concentration on the foaming capacity and foam stability of amaranth (ALI), eggplant (ELI) and fluted pumpkin (FLI) leaf protein isolates.
Acknowledgments
This research was supported by International Development Research Centre and Global Affairs Canada through the Canadian International Food Security Research Fund, Project 107983 on synergizing indigenous vegetables and fertilizer micro-dosing innovations among West African farmers.
Additional information
Funding
References
- Aletor, O.; Oshodi, A. A.; Ipinmoroti, K. Chemical Composition of Common Leafy Vegetables and Functional Properties of Their Leaf Protein Concentrates. J. Food Chem. 2002, 78, 63–68. DOI: 10.1016/S0308-8146(01)00376-4.
- Smith, F.; Eyzaguirre, P. African Leafy Vegetables: Their Role in the World Health Organization’s Global Fruit and Vegetables Initiative. Afr. J. Food Agric. Nutr. Dev. 2007, 7, 1–9.
- Odhav, B.; Beekrum, S.; Akula, U.; Baijnath, H. Preliminary Assessment of Nutritional Value of Traditional Leafy Vegetables in KwaZulu-Natal, South Africa. J. Food Compost. Anal. 2007, 20, 430–435. DOI: 10.1016/j.jfca.2006.04.015.
- Udousoro, I.; Ekanem, P. Assessment of Proximate Compositions of Twelve Edible Vegetables in Nigeria. Int. J. Mod. Chem. 2013, 4, 79–89.
- Ogunwolu, S. O.; Henshaw, F. O.; Mock, H.; Santros, A.; Awonorin, S. O. Functional Properties of Protein Concentrate and Isolates Produced from Cashew (Anacardium Occidentale L.) Nut. Food Chem. 2009, 115, 852–858. DOI: 10.1016/j.foodchem.2009.01.011.
- Lizarazo, C. I.; Lampi, A.-M.; Liu, J.; Sontag-Strohm, T.; Piironen, V.; Stoddard, F. L. Nutritive Quality and Protein Production from Grain Legumes in a Boreal Climate. J. Sci. Food Agric. 2015, 95, 2053–2064. DOI: 10.1002/jsfa.6920.
- Yoshie-Stark, Y.; Wada, Y.; Wäsche, A. Chemical Composition, Functional Properties, and Bioactivities of Rapeseed Protein Isolates. Food Chem. 2008, 107, 32–39. DOI: 10.1016/j.foodchem.2007.07.061.
- Hojilla-Evangelista, M. P.; Selling, G.; Hatfield, R. D.; Matthew, A. G. Extraction, Composition, and Functional Properties of Dried Alfalfa (Medicago Sativa L.) Leaf Protein. J. Sci. Food Agric. 2016, 97, 882–888. DOI: 10.1002/jsfa.7810.
- Barbin, D. F.; Natsch, A.; Müller, R. K. Improvement of Functional Properties of Rapeseed Protein Concentrates Produced via Alcoholic Processes by Thermal and Mechanical Treatments. J. Food Process. Preserv. 2011, 35, 369–375. DOI: 10.1111/j.1745-4549.2009.00476.x.
- Lamsal, B. P.; Koegel, R. G.; Gunasekaran, S. Some Physicochemical and Functional Properties of Alfalfa Soluble Leaf Proteins. LWT- Food Sci. Technol. 2006, 40, 1520–1526. DOI: 10.1016/j.lwt.2006.11.010.
- Jayabrata, S.; Sankar, C. D. Functional Properties of Sonicated and Non-sonicated Extracted Leaf Protein Concentrate from Diplazium Esculentum. Int. J. Food Prop. 2017, 20, 1051–1061. DOI: 10.1080/10942912.2016.1199034.
- Malomo, S. A.; He, R.; Aluko, R. E. Structural and Functional Properties of Hemp Seed Protein Products. J. Food Sci. 2014, 79, 1512–1521. D2OI: 10.1111/1750-3841.12537.
- Markwell, M. A. C.; Haas, S. M.; Biebar, L. L.; Tolbert, N. E. A Modification of the Lowry Procedure to Simplify Protein Determination in Membrane and in Protein Samples. Anal. Biochem. 1978, 87, 206–211. DOI: 10.1016/0003-2697(78)90586-9.
- Bidlingmeyer, B. A.; Cohen, S. A.; Tarvin, T. L. Rapid Analysis of Amino Acids Using Pre-column Derivatization. J. Chromatogr. 1984, 336, 93–104. DOI: 10.1016/S0378-4347(00)85133-6.
- Gehrke, C. W.; Wall, L. L.; Absheer, J. S.; Kaiser, F. E.; Zumwalt, R. W. Sample Preparation for Chromatography of Amino Acids: Acid Hydrolysis of Proteins. J. Assoc. Off. Anal. Chem. 1985, 68, 811–821.
- Landry, J.; Delhaye, S. Simplified Procedure for the Determination of Tryptophan of Foods and Feedstuffs from Barytic Hydrolysis. J. Agric. Food Chem. 1992, 40, 776–779. DOI: 10.1021/jf00017a014.
- Li, H.; Aluko, R. E. Structural Modulation of Calmodulin and Calmodulin Dependent Protein Kinase II by Pea Protein Hydrolysates. Int. J. Food Sci. Nutr. 2006, 57, 178–189. DOI: 10.1080/09637480600659144.
- Hayakawa, S.; Nakai, S. Relationships of Hydrophobicity and Net Charge to the Solubility of Milk and Soy Proteins. J. Food Sci. 1985, 50, 486–491. DOI: 10.1111/j.1365-2621.1985.tb13433.x.
- Aluko, R. E.; McIntosh, T. Polypeptide Profile and Functional Properties of Defatted Meals and Protein Isolates of Canola Seeds. J. Sci. Food Agri. 2004, 81, 391–396. DOI: 10.1002/1097-0010(200103)81:4<391::AID-JSFA823>3.0.CO;2-S.
- Aderinola, T. A.; Alashi, A. M.; Nwachukwu, I. D.; Fagbemi, T. N.; Enujiugha, V. N.; Aluko, R. E. In-vitro Digestibility, Structural and Functional Properties of Seed Moringa Oleifera Proteins. J. Food Hydrocholl. 2020. DOI: 10.1016/j.foodhyd.2019.105574.
- Adebiyi, A. P.; Aluko, R. E. Functional Properties of Protein Fractions Obtained from Commercial Yellow Field Pea (Pisum Sativum L.) Seed Protein Isolate. Food Chem. 2011, 128, 902–908. DOI: 10.1016/j.foodchem.2011.03.116.
- Ijarotimi, O. S.; Malomo, S. A.; Fagbemi, T. N.; Osundahunsi, O. F.; Aluko, R. E. Structural and Functional Properties of Buchholzia Coriacea Seed Flour and Protein Concentrate at Different pH and Protein Concentrations. Food Hydrocolloids. 2018, 74, 275–288. DOI: 10.1016/j.foodhyd.2017.08.018.
- Jia, X.; Ding, C.; Dong, L.; Yuan, S.; Zhang, Z.; Chen, Y.; Yuan, M. Comparison the Chemical and Functional Properties of Protein Hydrolysates from Different Mature Degree Hawk Teas. J. Food Nutr. Res. 2013, 1, 138–144.
- Prigent, S. V. E.; Voragen, A. G. J.; Visser, A. J. W. G.; Van Koningsveld, G. A.; Gruppen, H. Covalent Interactions between Proteins and Oxidation Products of Caffeoylquinic Acid (Chlorogenic Acid). J. Sci. Food Agric. 2007, 87, 2502–2510. DOI: 10.1002/jsfa.3011.
- World Health Organization/Food and Agricultural Organization. (2007). Protein and Amino Acid Requirement in Human Nutrition; Report of a Joint WHO/FAO/UNU Expert consultation, WHO technical report and series no. 935; World Health Organization: Geneva, Switzerland.
- Mao, X.; Hua, Y. Composition, Structure and Functional Properties of Protein Concentrates and Isolates Produced from Walnut (Juglans Regia L.). Int. J. Mol. Sci. 2012, 13, 1561–1581. DOI: 10.3390/ijms13021561.
- Molina Ortiz, S. E.; Puppo, M. C.; Wagner, J. R. Relationship between Structural Changes and Functional Properties of Soy Protein Isolates—carrageenan Systems. Food Hydrocolloids. 2004, 18, 1045–1053. DOI: 10.1016/j.foodhyd.2004.04.011.
- Zhu, K.-X.; Sun, X.; Chen, Z.-C.; Peng, W.; Qian, H.-F.; Zhou, H.-M. Comparison of Functional Properties and Secondary Structures of Defatted Wheat Germ Proteins Separated by Reverse Micelles and Alkaline Extraction and Isoelectric Precipitation. Food Chem. 2010, 123, 1163–1169. DOI: 10.1016/j.foodchem.2010.05.081.
- Schmid, F. X.;. Spectra Methods of Characterizing Protein Conformation and Conformational Changes. In Protein Structure: A Practical Approach; Creighton, T. E., Ed.; Springer Publishing Co: New York City, NY, USA, 1989; pp 251–285.
- Tan, S. H.; Mailer, R. J.; Blanchard, C. L.; Agboola, S. O. Emulsifying Properties of Proteins Extracted from Australian Canola Meal. LWT - Food Sci. Technol. 2014, 57, 376–382. DOI: 10.1016/j.lwt.2013.12.040.
- Uruakpa, F. O.; Arntfield, S. Emulsifying Characteristics of Commercial Canolaprotein-hydrocolloid Systems. Food Res. Int. 2005, 38, 659–672. DOI: 10.1016/j.foodres.2005.01.004.
- Tang, C. H.; Ten, Z.; Wang, X. S.; Yang, X. Q. Physicochemical and Functional Properties of Hemp (Cannabis Sativa L.) Protein Isolate. J. Agric. Food Chem. 2006, 54, 8945–8950. DOI: 10.1021/jf0619176.
- Nasri, N. A. E.; Tinay, A. H. E. Functional Properties of Fenugreek (Trigonella Foenum-graecum) Protein Concentrate. Food Chem. 2007, 103, 82–589. DOI: 10.1016/j.foodchem.2006.09.003.