
 ?Mathematical formulae have been encoded as MathML and are displayed in this HTML version using MathJax in order to improve their display. Uncheck the box to turn MathJax off. This feature requires Javascript. Click on a formula to zoom.
ABSTRACT
In this paper, an electrochemical sensor array utilizing metal materials was designed, and its applications in sugar content analysis from mixtures were conducted. The system adopts the conventional three-electrode system. Cyclic Voltammetry (CV) and Amperometric i-t Curve (i-t) were utilized as testing methods. The curve of the relationship between current and time could be obtained by i-t scanning. The relationship between the sugar concentration and the current density of the sensor was developed. The data was analyzed using multiple linear regression (MLR). The sugar mixtures were automatically measured by using this instrument. CV and i-t methods were utilized to carry out the experiments. Different scan rates CV results showed that it was a typical diffusion controlled electrochemical process. Different sugars CV results showed that different electrodes for CV experiments with different sugars produced different anode peak potential and current. Control experiments showed that neither Na2CO3 nor NaCl had any effect on the experimental results. The developed system has good stability and repeatability. I-t fitting results indicated that there was a good linear relationship between system responses and sugar concentrations. The linear range was between 0.14 mM and 4.76 mM. A python-based MLR model was developed for sugar content determination. Results were obtained by solving the system of equations, indicating that this method presented content determination abilities for sugar mixtures. The method proposed in this paper had the advantages of easy operation, low cost, rapid analysis, and low detection limit. It provided a new idea for sugar quantitative determination in solution.
Introduction
Carbohydrate is an organic compound which can be hydrolyzed to form polyhydroxy aldehyde or polyhydroxy ketone. According to the molecular structure, sugar can be divided into monosaccharides, disaccharides, and polysaccharides. Carbohydrate is one of the most widely distributed organic compounds in nature. Among these carbohydrates, glucose, fructose, and sucrose are the most common. For example, the sugar content of fruits is around 10% on average, and mainly exists in these three forms [Citation1]. Diabetes is a major public health problem in which glucose plays a key role [Citation2]. Fructose has been identified as a risk factor for obesity and metabolic syndrome [Citation3]. Sucrose has a significant effect on both obesity and heart tissue [Citation4]. Therefore, the reliable and simple methods for sugar content analysis are urgently required, helping to control energy intake and prevent specific diseases.
Many researchers studied electrochemical sensors for various sugars analysis. Xue et al. implanted glucose oxidase (GOD) in situ into chitosan-gold nanoparticle hybrid membrane and constructed an improved ampere-glucose biosensor on a Prussian blue (PB) modified electrode [Citation5]. Nie et al. prepared a non-enzymatic electrochemical sensor for glucose detection using NiNPs/ SMWNTs nanocomplexes synthesized by in situ precipitation [Citation6]. Li et al. reported a new graphene-gold nanohybrid with excellent electro-catalytic performance, which can be used for electrochemical detection of glucose [Citation7]. Seung et al. proposed a novel electrospinning approach that the fabrication of copper (Cu)-nanoflower decorated gold nanoparticles (AuNPs)-graphene oxide (GO) nanofiber (NF) as an electrochemical biosensor for the glucose detection [Citation8]. Compared with the oxidase sensor, the non-enzyme electrochemical sensor has the advantages of convenient storage and shorter response time. Starting with the sensor materials, the electrode materials with better catalytic properties were gradually discovered and prepared. Alam et al. prepared ZnO/CdO/SnO2 nanocomposite (NCs) by alkali wet chemical co-precipitation method at low temperature, and prepared glass carbon electrode (GCE) by nafion binder (5% Nafion suspended in ethanol) using NCs ethanol slurry as raw material, and prepared D-fructose sensor by electrochemical method under indoor conditions. The linear relationship between current and D-fructose concentration was plotted and the calibration curve of d-fructose sensor was established [Citation9]. Riccarda et al. investigated and introduced the development and performance of the first fructose biosensor based on a silkscreen printed graphene electrode (SPGE) [Citation10].
Electrochemical methods for sugar detection develop rapidly in recent years, but these methods usually characterize a specific sugar from a certain solution under a small interference environment. Little information on multiple sugar analysis from mixtures are reported till now. Yu et al. proposed a fuzzy quantitative detection model based on contour extraction and elliptic fitting to solve the difficult problem of mixture detection. The experimental results show that compared with the traditional light intensity model and the abstract texture feature model, the elliptical fitting model has better performance in terms of more reasonable interpretation, better stability, less computation, clearer visualization, and lower requirements on data acquisition process [Citation11]. They provided a development trend for content analysis of mixed solutions. However, this method has many disadvantages such as complicated operation, complex sample pretreatment and high cost. Supakorn et al. studied real-time monitoring of sucrose, sorbitol, D-glucose, and D-fructose concentrations at microwave frequencies using magnetic induction, and the results showed that the system had unique results for each solution type and concentration [Citation12]. Nikolaos et al. developed a rapid method for the measurement of glucose, fructose and sucrose in plant tissues using a modern high-performance liquid chromatography system coupled with a high sensitivity, high resolution and high precision mass spectrometer [Citation13]. Other researchers also studied the relative data treatment methods [Citation14].
In spite of the good results obtained by electronic and bioelectronic tongues, the usage of liquid electrochemical cells and heavy potentiostats and the high cost of the sensors and the need for periodic calibration limit the applications out of laboratory. In recent years, much work focused on electrochemical sensor array technique. Kutyła-Olesiuk et al. investigated a hybrid electronic tongue based on a variety of electrochemical sensors that could be used to monitor the fermentation process of wine [Citation15]. Wen et al. introduced the preparation and absorption properties of Ni(OH)2/Ni using nano TiO2 nanotube array (TNAs) as binder-free electrodes [Citation16]. However, previous studies focused on one single sugar analysis in solution, little information on the quantitative detection of multiple sugars in mixture was reported.
In this paper, an electrochemical sensor array utilizing metal materials was designed, and pioneer applications in sugar content anlaysis from mixtures were conducted. One conventional three-electrode system (Ag/AgCl (3 M KCl) electrode as the reference electrode, Pt sheet electrode as the counter electrode, and Ni foam, Cu film and Cu sheet as the working electrode) was utilized. The measurement data was used to develop the sugar content determination model. MLR was studied for content prediction. Control experiments were conducted to investigate the specificity. Also, reproducibility and stability of the proposed system were discussed.
Materials and methods
Reagents and materials
NaOH was purchased from Sinopharm Chemical Reagent Co., Ltd. (Shanghai, China). Glucose was obtained from Guanghua Chemical Reagent Co., Ltd. (Guangdong, China). Fructose was obtained from Zhiyuan Chemical Reagent Co., Ltd. (Tianjin, China). Sucrose was purchased from Guangfu Science and Technology Development Co., Ltd. (Tianjin, China). KCl and NaCl were purchased from Kelong Chemical Reagent Co., Ltd. (Chengdu, China). Na2CO3 was purchased from Beilian fine chemicals development Co., Ltd. (Tianjin, China). CHI-614E electrochemical workstation was purchased from Chenhua Instrument Co., Ltd. (Shanghai, China). Model 85–2A automatic agitator was purchased from Xinrui Instrument Co., Ltd. (Jiangsu, China). Pipette was purchased from Dalong Xingchuang Experimental Instrument Co., Ltd. (Beijing, China). All the reagents were analytical grade, and deionized water was accepted.
System design
Experiments were conducted using CHI-614E electrochemical workstation (Chenhua instrument, Shanghai, China). A conventional three-electrode electrochemical system (Pt sheet electrode as counter electrode and Ag/AgCl electrode as reference electrode) was utilized. Ni foam, Cu film, and Cu sheet electrodes were used as working electrodes to form an electrochemical sensor array. ) is flow chart of detection system. ) is the physical picture of the system. ) displays the Ni foam, Cu film, and Cu sheet electrodes. The detecting platform has other components, such as stepping motor, beaker wheel, steering engine, and magnetic stirrer. The automatic control of the system is realized through STM32. The STM32 is a 32-bit microcontroller based on the ARM Cortex-M kernel. It has the advantages of high performance, low cost and low power consumption. It controls the rotation of the detection platform, the lifting of the electrode and the automatic pipetting device. The real-time transmission of data can be carried out by connecting the computer through serial port. The sugar samples are automatically measured in turn. Compared with manual operation, the stability and continuity of automatic examination are increased. The sensor is connected with the electrochemical station to obtain electrical signals. The electrochemical workstation communicates with the computer through serial port. Experimental parameters of the electrochemical workstation could be set on computer software interface. The measurement data could be displayed in real time on the screen and stored in computer for further analysis.
Figure 1. System workflow diagram: (a) flow chart of detection system; (b) physical picture of detection platform; (c) Ni foam, Cu film and Cu sheet; (d) schematic diagram of experimental mechanism
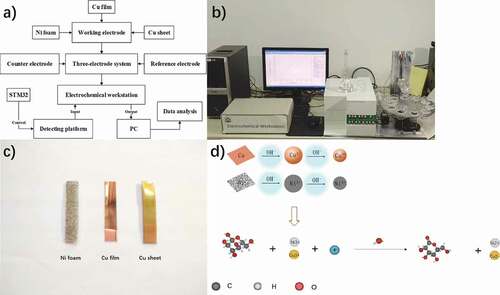
Polyurethane foam was washed with ethanol solution for 3 min and then put into 4% NaOH solution. After 5 min treatment under temperature of 45°C, the oil stains were removed, and the roughness of the material surface was increased. A mixture of 3 g/L CrO3 and 4 ml/L H2SO4 was used to thicken the polyurethane foam for 5 min at 37°C. SnCl2•2H2O with 36% hydrochloric acid were mixed as sensitized solution. Tin was added and sensitized at 45°C for 6 min. The foam material was placed into the chemical bath under ultrasonic conditions and added to PdCl2 solution at 37°C for 6 min. Then, the material was taken out and cleaned with deionized water, then put into a drying oven. The porous foam was fixed as the cathode and the simple nickel as the anode. Electroplating was carried out in a solution of 80 g/L nickel sulfate, 24 g/L sodium hyposite, 12 g/L sodium acetate, 8 g/L boric acid and 6 g/L ammonium chloride. Ni was deposited on the treated material, and then removed after treatment, washed with deionized water and dried in a constant temperature drying oven for later use.
The Cu film electrode is prepared by winding and sputtering equipment. The inert gas Ar is filled in the 1.3 × 10⁻³ Pa vacuum state. Add a high voltage direct current between the PET (anode) and Cu (cathode), because electrons from the glow discharge excite the inert gas, creating a plasma that blasts the Cu atoms out and deposits them on the PET film. The thickness uniformity error of the Cu film produced by this equipment is less than 5%, and the edge drawing accuracy is less than 2 mm. The Cu film used in this paper is a flexible thin-film material formed by splashing a layer of copper with a thickness of 75 μm on the PET base material with a thickness of 0.14 mm.
SEM
The Ni foam material was characterized by German Carl Zeiss SUPRA 55 SAPPHIRE instrument (Carl Zeiss Microscopy 73447 oberkochen GmbH, Germany), voltage is 5 kV.
CV measurements
CV measurements were used for detection and carried in the quiescent electrolyte solution of 0.1 M NaOH which contains 1 mM glucose, fructose and sucrose. CV measurements were registered from +0.2 V to +0.8 V (the scan started at +0.2 V) for Ni foam electrode, at a sweep rate of 0.05 V/s. CV measurements were registered from −0.8 V to −0.2 V (the scan started at −0.8 V) for Cu film electrode, at a sweep rate of 0.05 V/s. CV measurements were registered from −0.5 V to +0.6 V (the scan started at −0.5 V) for Cu sheet electrode, at a sweep rate of 0.05 V/s. CV measurements will be beginning after pushing the “CV start” button. System determines detection period through setting the detection time. After the completion of each CV experiment, rotary table will start to detect the next solution, and CV experiments can perform 10 times automatically.
I-t measurements
I-t measurement was performed for the quantitative detection of sugar concentration. A quantity of 0.1 M NaOH was used as the electrolytic matrix. The contact surface between the working electrode and the solution was always a 0.5 cm * 0.5 cm square and the contact area is 0.25 cm2. I-t measurements is tested at +0.5 V constant potential. Through observation of the experiment, current always reaches a constant value at about 150 s, and reaches equilibrium at about 50 s after each drip. When the electrochemical workstation was just started, the metal elements on the surface of the working electrode would first be converted to hydroxide in an alkaline environment until they reached equilibrium. After repeated experiments, it was found that the process lasted about 150 s So the experiment started after 200 s. Therefore, the experiment started after the system reached a stable state. In the detection process, 0.05 mL 0.1 M three sugar solutions were added with pipette once every 50 s, and 20 drops were added for each experiment, with a total time of 1200 s. The i-t experiment was carried out under the condition that the constant temperature automatic mixer was continuously stirred, and the speed of the agitator was kept constant at 250 r/min. In recent years, many electrochemical performances of Ni and Cu in alkaline environment have been reported [Citation17]. The system has a high-precision automatic pipette device. By setting the time and volume, the liquid to be measured can be dropped quantitatively and periodically. And i-t measurement will be beginning after pushing the “i-t start” button. With the addition of glucose, a rapid oxidation reaction takes place on the electrode surface, resulting in gluconolactone. ) displays the experimental principle of this study.
Experiments and MLR
The concentration of glucose, sucrose, and fructose in the mixed solution were 0.03 M, 0.06 M, and 0.09 M, respectively. Other experimental methods and parameters are the same as the I-t experiment. The detected data are saved in “.csv” format. In each experiment, 10 eigenvalues were extracted. Representing the current response generated after adding 0.1 ml test liquid. Formula (1) is the formula of unitary linear regression. And θ0 is the intercept and θ1 is the regression coefficient for the independent variable. But in real life, most changes are not the result of changes in a single variable. Therefore, this simple representation will not satisfy most usage requirements. Since the invention in this paper deals with three variables, three variables are used as examples, formula (2) shows the MLR. And θ0 is the intercept, x1, x2 and x3 are the characteristic indexes of three different independent variables, θ1, θ2, θ3 are their corresponding regression coefficients. MLR is suitable for this study, because each sugar is the factor that generates the current in response for each electrode. Python is a very understandable and maintainable programming language, and its best area is data analysis. Based on Python, this paper conducts multiple linear regression analysis on experimental data, establishes regression model, and obtains regression coefficient. The model uses 100 sets of detection data, of which 80 groups are training data and 20 groups are test data. The predicted value is compared with the real value, then the score is obtained.
Control experiments
All experiments were conducted in an alkaline environment and NaOH solution was used as the base solution. In addition, NaOH is easy to react with CO2 in the air to produce Na2CO3, so the interference of Na2CO3 on the experiment must be eliminated. Na+ and Cl− are present during the experiment. NaCl is a typical representative of inorganic salts, and NaCl is commonly found in various solutions in daily life. Therefore, the NaCl control experiment was used to explore whether NaCl and other inorganic salts would influence the experiment. The other conditions were the same as in the i-t experiment. The detection solutions were 0.1 M Na2CO3, 0.1 M NaCl, 0.1 M glucose, 0.1 M fructose, and 0.1 M sucrose.
Reproducibility and stability experiments
This experiment is to verify the stability and repeatability of the system. The experiment steps and materials are the same as the i-t experiment. The same solution was detected repeatedly by the multi-sensor in this paper. And MAE, MSE, RMSE were calculated to verify repeatability. The constant voltage test was used for the stability test, electrolyte solution contains 0.1 M NaOH and 1 mM glucose, the potential is constant at +5 V, and the test time was set at 4000 s.
Results and discussion
SEM results
Fig. s1 showed SEM characterization results of Ni foam. Fig. s1(a) and Fig. s1(b) was the overall structure and local structure of Ni foam, respectively. The Ni foam had a uniform three-dimensional mesh microporous structure, multi-layer stable mesh structure, and close connection. These properties and special spatial structures greatly accurate electrochemical reactions in solution environment.
CV measurements results
When the Ni foam was used as a working electrode. CV measurements were performed at a scan rate of 50 mV/s for 2 cycles in the 0.1 M KCl solution containing 5 mM K3[Fe(CN)6]. This experiment was used to calculate the effective surface area of Ni foam. Fig. s2 showed the results. Formula (3) was used to calculate the effective surface area[Citation18,Citation19].
Where n was the number of electrons participating in the redox reaction (n = 1 for K3[Fe(CN)6]), D was the diffusion coefficient of the molecule in a solution (0.673×10⁻⁵ cm2s−Citation1 for K3[Fe(CN)6] in 0.1 M KCl solution). Co was the bulk concentration of the redox probe. The value of Aeff for Ni foam was estimated to be 1.2095 cm2.
In this study, a multiple electrochemical sensor system was designed and used for multiple sugar content quantitative analysis in solution. Fig. s3(a), Fig. s3(b) and Fig. s3(c) showed the CV curve by using Ni foam electrode as the working electrode. The anode peak potential of without additives, glucose, fructose, and sucrose were 0.507 V, 0.559 V, 0.598 V, and 0.589 V, respectively, and the anode peak current were 0.614 mA, 1.298 mA, 1.622 mA and 1.400 mA, respectively. Fig. s3(d), Fig. s3(e) and Fig. s3(f) show the CV curve obtained by using Cu film electrode as the working electrode. The cathode peak potential of without additives, glucose, fructose, and sucrose were −0.648 V, −0.637 V, −0.639 V, and −0.635 V, respectively, and the cathode peak current were 0.114 mA, 0.115 mA, 0.119 mA, and 0.124 mA, respectively. Fig. s3(g), Fig. s3(h) and Fig. s3(i) show the CV curve obtained by using Cu sheet electrode as the working electrode. The anode peak potential of without additives, glucose, fructose, and sucrose were 0.381 V, 0.255 V, 0.248 V, and 0.304 V, respectively, and the anode peak current were 0.247 mA, 0.087 mA, 0.090 mA, and 0.156 mA, respectively. The experimental results show that different electrodes produce different anode peak potential and current for different sugars in CV experiments.
I-t measurements results
Ni foam electrode: Fig. s4 showed the i-t measurements results of the 0.1 M glucose, 0.1 M fructose, 0.1 M sucrose and the mixed solution of those three sugars with the concentration of 0.05 M when using the Ni foam electrode as the working electrode. The base solution was 0.1 M NaOH. The concentration of the test solution in the solution increased with the continuous drip of the test solution, and 0.05 mL of the test solution was added every 50 s.
), ) and ) shows the linear fitting curves between the concentrations and the current density of the three substances. Then, formula (4), formula (5), and formula (6) were obtained. For the convenience of calculation, ‘Cg,’ ‘Cf,’ and ‘Cs’ in all formulas below were the concentrations of glucose, fructose, and sucrose, respectively. ‘X’ was the current density obtained after detection conversion. The concentration of a single solution of the three sugars was calculated by these three formulas.
Figure 2. Linear fitting results of i-t measurements: (a) glucose of Ni foam electrode; (b) fructose of Ni foam electrode; (c) sucrose of Ni foam electrode; (d) glucose of Cu film electrode; (e) fructose of Cu film electrode; (f) sucrose of Cu film electrode; (g) glucose of Cu sheet electrode; (h) fructose of Cu sheet electrode; (i) sucrose of Cu sheet electrode
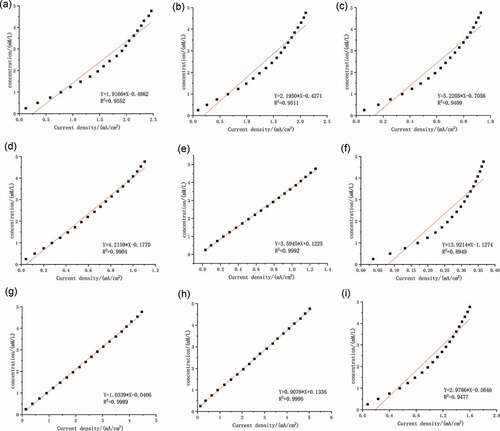
Cu film electrode: Fig. s5 showed the i-t experiment results of the 0.1 M glucose, 0.1 M fructose, 0.1 M sucrose, and the mixed solution of those three sugars with the concentration of 0.05 M when using the Cu film electrode as the working electrode. ), ) and ) shows the linear fitting results between the concentrations and the current density of the three substances. In the same way, formula (7), formula (8), and formula (9) were obtained.
Fig. s6 shows the i-t experiment results of the 0.1 M glucose, 0.1 M fructose, 0.1 M sucrose, and the mixed solution of those three sugars with the concentration of 0.05 M when using the Cu sheet electrode as the working electrode.
Cu sheet electrode: Fig. s6 showed the i-t scanning results of the 0.1 M glucose, 0.1 M fructose, 0.1 M sucrose and mixed solution containing three sugars with concentration of 0.05 M by using Cu sheet electrode as the working electrode. ), ) and ) shows the linear fitting results between the concentrations and the current density of the three substances. In the same way, formula (10), formula (11), and formula (13) were obtained.
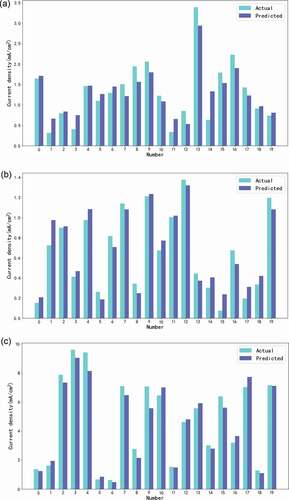
Analysis with MLR: Quantitative analysis of sugar was studied through the experimental data. In this paper, a variety of experiments on different sugar content in solution were conducted, and the data were processed appropriately to eliminate gross errors. Then, the regression model was established through program training. Let X1, X2 and X3 be the current densities of Ni foam, Cu film and Cu sheet, respectively. Formula (13), formula (14), and formula (15) were the multiple linear regression equations of the obtained foamed Ni electrode, Cu film electrode, and Cu sheet electrode, respectively. Fig. s7(a) was the scatter diagram of the multiple data of Ni foam electrode. The concentrations of three sugars were taken as three characteristic values, respectively. The prediction lines of different sugar concentrations on the current density was obtained (confidence = 95%). The “train_test_split” function was used to create a preliminary model. After building a preliminary data set model, the eigenvalues (different sugar concentrations) and the label value (current density) of the training set were put into the “LinearRegression()” model and trained using the “fit” function. After the model training, the corresponding regression coefficient and intercept were output, and the MLR equation of Ni foam was obtained. Similarly, fig. s7(b) and fig. s7(c) were multivariate data scatter diagrams of Cu film electrode and Cu sheet electrode, respectively.
shows the effect of MLR while using the Ni foam electrode, Cu film electrode and Cu sheet electrode, respectively. MLR results indicated that the experimental data of Cu sheet electrode was the most reliable. The following equations were obtained.
Figure 3. Regression effect of the eletrodes: (a) Ni foam electrode; (b) Cu film electrode; (c) Cu sheet electrode
The concentration of glucose, sucrose, and fructose was 0.03 M, 0.06 M, and 0.09 M, respectively. The solution was measured and 10 characteristic values of measurement data were extracted. Finally, the current density results are displayed in . shows that the current densities of foam Ni electrode, Cu film electrode and Cu sheet electrode were 2.156 mA/cmCitation2, 1.306 mA/cmCitation2 and 7.912 mA/cmCitation2, respectively, when 1 mL solution was added into solution. The ‘Cg,’ ‘Cf’ and ‘Cs’ were calculated as 1.3366 mM, 4.3710 mM, and 2.7096 mM, respectively. The relationship between the calculated concentration ‘c’ and the original concentration ‘co’ was shown in formula (17).
Table 1. The corresponding current was measured, and 10 eigenvalues were taken from the i-t experimental data of each electrode, and the corresponding current density was obtained through calculation and analysis
Put the calculated concentration into formula (17) to calculate the original concentration ‘Cgo,’ ‘Cso’ and ‘Cfo,’ which are 28.0686 mM, 56.9016 mM, and 91.7910 mM, respectively. The actual values of ‘Cgo,’ ‘Cso’ and ‘Cfo’ are 30 mM, 60 mM, and 90 mM, respectively, with an average error of 4.53%.
Real sample analysis: Finally, the actual sample had been tested. The test sample was watermelons, which are high in glucose, fructose, and sucrose. A fresh ripe watermelon is cut up and juiced. It was placed in an airtight environment at a constant temperature of 0°C for 30 minutes. The supernatant was then transferred to a beaker, and 50 ml was removed using a pipette and prepared into a solution using a 250 ml volumetric flask. The configured solution was detected, and the current densities of foamy Ni electrode, Cu film electrode, and Cu sheet electrode were 0.8827, 0.3613, 1.7864. The output concentration ‘Cg,’ ‘Cf’ and ‘Cs’ calculated by the input were 0.4740 mM, 0.7221 mM, and 0.4724 mM, respectively.
The results showed that the proposed method still has some disadvantages in detecting accuracy. Electrochemical detection is a complex nonlinear process. But it can be approximated as a linear process over a small range of concentrations. So as to facilitate our analysis and detection. Therefore, it is convenient for us to detect and analyze within a certain error range. Abdelilah et al. reported that the effect of cathodic polarization on the electrochemical behavior of the thin titanium dioxide film formed by anodic pretreatment over pure commercial titanium metal for biomaterial application was investigated in situ using scanning electrochemical microscopy (SECM). SECM operation in the redox competition mode proved that hydrogen was absorbed in the surface oxide film leading to changes in conductivity and electrochemical reactivity [Citation20]. SECM is an advanced electrochemical method, which is based on electrochemical scanning of electrochemical system surface by an ultramicroelectrode [Citation21]. Due to very high complexity of such systems the evaluation of data collected by this electrochemical method is a challenging task, which could be partly solved by mathematical modeling of processes that are influencing the signal of SECM [Citation22]. Several attempts to describe these processes mathematically have been performed for both feedback and generation-collection SECM modes [Citation23]. However, mathematical models for the redox competition SECM mode still were not elaborated due to high complexity of this problem [Citation24]. Feliksas et al. had developed a mathematical model for the evaluation of enzyme − glucose oxidase (GO) − modified surface by SECM, which was acting at redox competition mode [Citation25]. Lu et al. reported the simulation of intracellular receptor signaling cascade by an electrochemical signal amplification system helped in directly measuring BmOR1–bombykol ligand interaction and exploring the kinetics after the self-assembly of BmOR1 on the biosensor [Citation26].
The method proposed in this paper presents some advantages including high accuracy, easy operation, low cost [Citation27]. Furthermore, this method utilized multiple electrochemical sensors and characterized the multiple contents in the liquid combining data treatment model [Citation28]. Results demonstrated that this way was effective for multiple content characterization with a portable self-developed instrument. A long-term plan has been made to carry out sugar analysis by combining electrochemical sensors and artificial intelligence methods [Citation29,Citation30].
Control experiments
Fig. s8 showed the results of control experiments. Results indicated that Ni foam electrode, Cu film electrode and Cu sheet electrode produced almost no current response to Na2CO3 and NaCl, indicating that Na2CO3 and NaCl had no effect on the sugar analysis. Ni foam electrode presented larger current to glucose, and the Cu film electrode and Cu sheet electrode presented larger current to fructose. Control experiment results indicated that the sensor system had good selectivity.
Reproducibility and stability
displays the mean absolute error (MAE), mean squared error (MSE) and root mean squared error (RMSE) of the predictor model. Fig. s9(a) showed the results of multi-sensor system to the same solution. The data analysis results of Ni foam electrode, Cu film electrode and Cu sheet electrode were showed in Fig. s9(b), Fig. s9(c) and Fig. s9(d), respectively. The standard deviation (SD) of Ni foam electrode, Cu film electrode and Cu sheet electrode are calculated as 0.023%, 0.206% and 0.648%, respectively. Results demonstrated that the designed analysis system had good reproducibility and stability.
Table 2. The MAE, MSE, RMSE for the predictor model
Conclusion
In this paper, an electrochemical sensor array utilizing metal materials was designed, and pioneer applications for sugar content analysis from mixtures were conducted. Pt electrode was used as counter electrode, and Ag/AgCl electrode was used as reference electrode. Ni foam, Cu film and Cu sheet electrodes were used to form working electrode array. The detection platform is controlled by micro-controllers. The sugar mixtures were automatically measured by using this instrument. CV and i-t methods were utilized to carry out the experiments. Different scan rates CV results showed that it was a typical diffusion controlled electrochemical process. Different sugars CV results showed that different electrodes for CV experiments with different sugars produced different anode peak potential and current. Control experiments showed that neither Na2CO3 nor NaCl had any effect on the experimental results. The developed system have good stability and repeatability. I-t fitting results indicated that there were good linear relationship between system responses and sugar concentrations. The linear range was between 0.14 mM and 4.76 mM. A python-based MLR model was developed for sugar content determination. Results were obtained by solving the system of equations. The error of test results was 4.53%. The sensor studied in this paper realized the quantitative analysis of sugar mixtures. The proposed method in this paper is promising in multiple content quantitative analysis for food samples.
Supplemental Material
Download MS Word (2.2 MB)Acknowledgments
This work is financially supported by Scientific Research Project of Zhejiang Province (Grant No. 2019C02075, LGG18F030012, LGG19F010012), Natural Science Foundation of Zhejiang Province (Grant No. LY19F030023) and College Student Research Programme of Zhejiang Province. Scientific Research Project of Zhejiang Province (No. 2018C02013) and McIntire Stennis program.
Supplementary material
Supplemental data for this article can be accessed on the publisher’s website.
Additional information
Funding
References
- Lin, W. T.; Kao, Y. H.; Melinda, S. S.; David, W. S.; Lee, C. H.; Lin, H. Y.; Ted, C.; Tseng, T. S. The Association between Sugar-sweetened Beverages Intake, Body Mass Index, and Inflammation in US Adults. Int. J. Public Health. 2020, 65(1), 45–53. DOI: https://doi.org/10.1007/s00038-020-01330-5.
- Rosa, J. W. L.; Zhang, S. Y.; Tony, K. T. L. Interaction of Glucose Sensing and Leptin Action in the Brain. Mol. Metab. 2020, 39, 101011.
- Hua, A.; Li, J.; Li, O.; Su, M.; Gao, X. Fructose Vs Glucose Decreased Liking/wanting and Subsequent Intake of High-energy Foods in Young Women. Nutr. Res. 2020, 78, 60–71. DOI: https://doi.org/10.1016/j.nutres.2020.05.002.
- Ethel, L. B. N.; Priscila, P. S.; Heloisa, B. A.; Gisele, S.; Katiucha, R.; Geovana, X. E.; Fábio, R. F. S.; Fernanda, M.; Ana, A. F. N-acetylcysteine in High-sucrose Diet-induced Obesity: Energy Expenditure and Metabolic Shifting for Cardiac Health. Pharmacol. Res. 2009, 59(1), 74–79. DOI: https://doi.org/10.1016/j.phrs.2008.10.004.
- Xue, M. H.; Xu, Q.; Zhou, M.; Zhu, J. J. In Situ Immobilization of Glucose Oxidase in Chitosan–gold Nanoparticle Hybrid Film on Prussian Blue Modified Electrode for High-sensitivity Glucose Detection. Electrochem. Commun. 2006, 8, 1468–1474. DOI: https://doi.org/10.1016/j.elecom.2006.07.019.
- Nie, H.; Yao, Z.; Zhou, X.; Yang, Z.; Huang, S. Nonenzymatic Electrochemical Detection of Glucose Using Well-distributed Nickel Nanoparticles on Straight Multi-walled Carbon Nanotubes. Biosens. Bioelectron. 2011, 30, 28–34. DOI: https://doi.org/10.1016/j.bios.2011.08.022.
- Li, R.; Zhang, J.; Wang, Z.; Li, Z.; Liu, J.; Gu, Z.; Wang, G. Novel Graphene-gold Nanohybrid with Excellent Electrocatalytic Performance for the Electrochemical Detection of Glucose. Sens. Actuators B Chem. 2015, 208, 421–428. DOI: https://doi.org/10.1016/j.snb.2014.11.004.
- Seung, H. B.; Jihyeok, R.; Chan, Y. P.; Min, W. K.; Rongjia, S.; Suresh, K. K.; Tae, J. P. Cu-nanoflower Decorated Gold Nanoparticles-graphene Oxide Nanofiber as Electrochemical Biosensor for Glucose Detection. Mater. Sci. Eng. C. 2020, 107, 110273. DOI: https://doi.org/10.1016/j.msec.2019.110273.
- Alam, M. M.; Abdullah, M. A.; Mohammed, M. R.; Islam, M. A. Fabrication of Sensitive D-fructose Sensor Based on Facile Ternary Mixed ZnO/CdO/SnO2 Nanocomposites by Electrochemical Approach. Surf. Interfaces. 2020, 19, 100540. DOI: https://doi.org/10.1016/j.surfin.2020.100540.
- Riccarda, A.; Lo, G. A New Osmium-polymer Modified Screen-printed Graphene Electrode for Fructose Detection. Sens. Actuators B Chem. 2014, 195, 287–293. DOI: https://doi.org/10.1016/j.snb.2014.01.050.
- Yu, H.; Yan, W.; Sun, J.; Wang, H.; Zhao, Z. Study on Quantitative Detection of Turbid Solution Components Based on Ellipse Fitting. Spectrochim. Acta. A. 2020, 240, 118573. DOI: https://doi.org/10.1016/j.saa.2020.118573.
- Supakorn, H.; Anuwat, W. Real-time Monitoring of Sucrose, Sorbitol, D-glucose and D-fructose Concentration by Electromagnetic Sensing. Food. Chem. 2017, 232, 566–570. DOI: https://doi.org/10.1016/j.foodchem.2017.04.054.
- Nikolaos, G.; Kristin, F.; Craig, M. R. Validation of a Rapid and Sensitive HPLC/MS Method for Measuring Sucrose, Fructose and Glucose in Plant Tissues. Food. Chem. 2018, 262, 191–198. DOI: https://doi.org/10.1016/j.foodchem.2018.04.051.
- Jiang, C.; Li, R.; Chen, T.; Xu, C.; Li, L.; Li, S. A Two-lane Mixed Traffic Flow Model with Drivers’ Intention to Change Lane Based on Cellular Automata. Int. J. Bio-Inspired Computation. 2020, 16, 229–240.
- Kutyła-Olesiuk, A.; Wawrzyniak, U. E.; Jańczyk, M.; Wróblewski, W. Electrochemical Sensor Arrays for the Analysis of Wine Production. Procedia. Eng. 2014, 87, 580–583. DOI: https://doi.org/10.1016/j.proeng.2014.11.555.
- Wen, X.; Xi, J.; Long, M.; Tan, L.; Wang, J.; Yan, P.; Zhong, L.; Liu, Y.; Tang, A. Ni(OH)2/Ni Based on TiO2 Nanotube Arrays Binder-free Electrochemical Sensor for Formaldehyde Accelerated Detection. J. Electroanal. Chem. 2017, 805, 68–74. DOI: https://doi.org/10.1016/j.jelechem.2017.09.066.
- Gao, A.; Zhang, X.; Peng, X.; Wu, H.; Bai, L.; Jin, W.; Wu, G.; Hang, R.; Paul, K. C. In Situ Synthesis of Ni(OH)2/TiO2 Composite Film on NiTi Alloy for Non-enzymatic Glucose Sensing. Sens. Actuators B Chem. 2016, 232, 150–157. DOI: https://doi.org/10.1016/j.snb.2016.03.122.
- Shruthi, B.; Raju, V. B.; Madhu, B. J. Synthesis, Spectroscopic and Electrochemical Performance of Pasted β-nickel Hydroxide Electrode in Alkaline Electrolyte, Spectrochim. Acta A Mol. Biomol. Spectrosc. 2015, 135, 683–689. DOI: https://doi.org/10.1016/j.saa.2014.07.009.
- Xia, Y.; Dai, Q.; Chen, J. Electrochemical Degradation of Aspirin Using a Ni Doped PbO2 Electrode. J. Electroanal. Chem. 2015, 744, 117–125. DOI: https://doi.org/10.1016/j.jelechem.2015.01.021.
- Abdelilah, A.; Martina, M.; Livia, N.; Ricardo, M. S.; Geza, N. A Study of the Electrochemical Reactivity of Titanium under Cathodic Polarization by Means of Combined Feedback and Redox Competition Modes of Scanning Electrochemical Microscopy. Sens. Actuators B Chem. 2020, 320, 128339. DOI: https://doi.org/10.1016/j.snb.2020.128339.
- Allen, J. B.; Fu, R. F. F.; Juhyoun, K.; Ovadia, L. Scanning Electrochemical Microscopy Introduction and Principles. Compr. Anal. Chem. Anal. Chem. 2020, 61, 132–138.
- Wilhelm, T.; Wittstock, G.; Szargan, R. Scanning Electrochemical Microscopy of Enzymes Immobilized on Structured Glass-gold Substrates. Fresen J Anal Chem. 1999, 365(1–3), 163–167. DOI: https://doi.org/10.1007/s002160051465.
- Wittstock, G.; Wilhelm, T. Characterization and Manipulation of Microscopic Biochemically Active Regions by Scanning Electrochemical Microscopy (SECM). Analytical Sciences. 2020, 320(11), 1199–1204. DOI: https://doi.org/10.2116/analsci.18.1199.
- Eckhard, K.; Chen, X.; Turcu, F.; Schuhmann, W. Redox Competition Mode of Scanning Electrochemical Microscopy (RC-SECM) for Visualisation of Local Catalytic Activity. Phys. Chem. Chem. Phys. 2006, 8(45), 5359–5365. DOI: https://doi.org/10.1039/b609511a.
- Feliksas, I.; Inga, M.; Rokas, A.; Arunas, R. Modelling of Scanning Electrochemical Microscopy at Redox Competition Mode Using Diffusion and Reaction Equations. Electrochim. Acta. 2016, 222, 347–354. DOI: https://doi.org/10.1016/j.electacta.2016.10.179.
- Lu, D.; Xu, Q.; Pang, G. A Bombykol Electrochemical Receptor Sensor and Its Kinetics. Bioelectrochemistry. 2019, 128, 263–273. DOI: https://doi.org/10.1016/j.bioelechem.2019.04.009.
- Yuan, M. J.; Guo, X. T.; Li, N.; Li, Q.; Wang, S. B.; Liu, C. S.; Pang, H. Highly Dispersed and Stabilized Nickel Nanoparticle/silicon Oxide/nitrogen-doped Carbon Composites for High-performance Glucose Electrocatalysis, Sensor Actuat B-Chem. 2019, 297(2019), 126809. DOI: https://doi.org/10.1016/j.snb.2019.126809
- Pang, H.; Zhang, Y. Z.; Cheng, T.; Lai, W. Y.; Huang, W. Uniform Manganese Hexacyanoferrate Hydrate Nanocubes Featuring Superior Performance for Low-cost Supercapacitors and Nonenzymatic Electrochemical Sensors. NANOSCALE. 2015, 7(38), 16012–16019. DOI: https://doi.org/10.1039/C5NR04322K.
- Zhou, H.; Yu, H.; Hu, R.; Zhang, G.; Hu, J.; He, T. Analyzing multiple types of behaviors from traffic videos via nonparametric topic model. Journal of Visual Communication and Image Representation. 2019, 64, 102649. DOI: https://doi.org/10.1016/j.jvcir.2019.102649
- Zhou, H.; Yu, H.;Hu, R. Hu, J. A survey on trends of cross-media topic evolution map.Knowledge-Based Systems. 2017, 124, 164-175. DOI: https://doi.org/10.1016/j.knosys.2017.03.009