
ABSTRACT
The aim of current research was to determine the effect of different extraction techniques on the antioxidant capacity of green tea, black tea and ginger polyphenols. Initially, the raw materials were subjected to compositional analysis. Afterward, the bioactive moieties from all the samples were extracted through ultrasound and conventional solvent extraction method using different solvents (i.e. ethanol, methanol and water). Furthermore, the functional ingredients, namely, catechins and theaflavins were isolated by solvent partition method from green and black tea, respectively. In addition, the extracts and isolates were analyzed for their total phenolic and antioxidant profile using various spectrophotometric assays. For the quantification of theaflavins and catechins, a reverse phase HPLC system was used. Results showed that ultrasound (P > .005) proved more effectual for the extraction and isolation of polyphenols (757.33 mg/100 g GAE) from the tested materials among the other extraction techniques (741.66 mg/100 g GAE). Likewise, green tea showed better performance than the rest and in solvents ethanol performed better as compared to their counter parts. Similarly, the isolates showed higher antioxidant potential as compared to their extracts and order of effectiveness was catechins > theaflavins > Ginger freeze dried extract (GFDE).
Introduction
Recently, diet-based therapy with special reference to polyphenols has been invigorated worldwide and people are using natural food materials as an intervention against various maladies. Among different dietary regimen tools, polyphenolic enriched functional and nutraceutical foods engrossed attention due to their acceptability, easy access, low cost, and long administration. In this scenario, green and black tea (Camellia sinensis) are the members of Theaceae family and are examples of plants containing bioactive molecules with unique nutraceutical potential. Likewise, the therapeutic worth of ginger is also well established. Extensive studies have suggested that tea consumption provides numerous health benefits mainly attributed to its polyphenols especially catechins, theaflavin, and thearubigins. Tea is mainly divided into three distinct types i.e., black, green and oolong differed in terms of processing method and chemical profile. Among all types, green tea holds a 20% share of total tea production and is regularly consumed in Asia especially in the south and East Asia. Whereas, 78% of the world tea share is held by black tea and has consumption in North America, Europe and North Africa. Like other therapeutic plants, tea chemical composition is dominated by polyphenols especially flavanols (catechins, theaflavin and thearubigins, quercetin, myricetin and kaempferol) and phenolic acids. Ginger rhizome (Zingiber officinale Roscoe) is particularly used as a spice in food by consumers in the world. Ginger blessed with an array of phytochemicals denoted its strong pharmacological potential. Among the different phytochemicals shogaols, gingerols and zingiberene are considered as most effective. Tea is composed of leaves from Camellia sinensis plant, which is second in the list of beverages in all over the world consumed by people.[Citation1,Citation2]
Globally, Ginger rhizome (Zingiber officinale Roscoe) is a widely utilized spice by the consumer owing to its rich taste and therapeutic profile. It is well known for its nutraceutical value, which can be ascribed to a variety of bioactive compounds, including gingerols, zingiberene, and shogaols.[Citation3] Gingerols-6 (GN-6), a family of volatile phenolic compounds gives the characteristic pungent taste to the fresh ginger rhizome. It is the major compound of the rhizome responsible for the pungency, while other GNs, such as 4-, 8-, 10-, and 12-GN, are present in a lesser amount. These compounds are thermally labile which are transformed at high temperatures to shogaols (SGs), which impart a pungent and spicy-sweet fragrance.[Citation4] In this context, Hussain et al.,[Citation5] revealed that extracts of ginger have a vast range of biological functions inclusive of antiallergic, antiserotonergic, anticholinergic, antiserotonergic, anticholinergic, anticonvulsant, antiulcer, analgesic, gastric antisecretory, antitumor, antithrombotic, hypocholesterolemic, antifungal, antispasmodic and other benign and healthful things. Various studies have explored that ginger rhizome is equipped/supplied with active principles of ginger called gingerols and shogaols exhibiting strong antioxidant properties.[Citation6]
The current proposal aims to optimize the extraction efficiency of bioactive molecules from green tea, black tea, and ginger through ultrasound assistant extraction and conventional solvent extraction method. Moreover, the antioxidant characterization of these resultant effluents was also carried out to access their in vitro effectiveness. Catechins, and Theaflavin were isolated from the selected extracts. Likewise, ginger extract was also freeze-dried to obtained GFD fraction. The outcomes of this project surely proved beneficial for both academia and industry that surely uplift the quality and credibility of contemporary nutrition and provide rational and cost-effective solutions for ever-escalating health-care burden thus contribute to the prospering economy. Moreover, outcomes have credentials regarding the optimization of polyphenol extraction for the development of the effective, economical, and cost-effective intervention. Polyphenols have therapeutic worth considering the fact, this project might be the first attempt that combines functional and nutraceutical products in one intervention that can tackle the physiological maladies in a better way owing to their multidimensional mechanistic approach.
Materials and methods
Procurement of raw material
Recent research project was carried out in the Institute of Home and Food Sciences, Government College University, Faisalabad. Green tea and black tea variety (Qi-Men) were procured from the National Tea Research Institute (NTRI), Shinkiari, Mansehra for the isolation of the catechins and the theaflavins respectively. The locally grown ground ginger was used for the recent research project. The reagents (analytical and HPLC grade) and standards were purchased from Merck (Merck KGaA, Darmstadt, Germany) and Sigma-Aldrich (Sigma-Aldrich Tokyo, Japan). Instant exploration aims to investigate the effect of different extraction techniques on the extraction/isolation of polyphenols from green tea, black tea, and ginger. The raw materials were subjected to compositional analysis. Afterward, the bioactive moieties from all samples were extracted by using ultrasound and conventional solvent extraction method by using different solvents like ethanol, methanol, and water. The detail of adapted methodology has been disclosed as under;
Compositional analysis proximate analysis
The proximate composition of black tea, green tea, and ginger was evaluated through the estimation of moisture, fat, protein, fat, fiber and ash by adapting the guidelines of Kaur et al.[Citation7] Whereas, NFE was estimated through the subtraction method.
Minerals analysis
The green tea, black tea, and ginger samples were evaluated for minerals like sodium (Na), potassium (K), calcium (Ca), zinc (Zn), magnesium (Mg) and iron (Fe) through the standard protocol of .[Citation8] The first two were estimated through Flame Photometer-410 (Sherwood Scientific Ltd., Cambridge) however, remaining by Atomic Absorption Spectrophotometer (Varian AA240, Australia).
Polyphenols extraction
Bioactive molecules i.e. catechins, theaflavin and ginger freeze-dried (GFDE) extract were extracted from black tea, green tea, and ginger, respectively, by the solvent extraction and ultrasound extraction technique by selecting the protocol of Chen et al.,[Citation9] with some modifications. Purposely, using solvents including water, ethanol, and methanol at a constant temperature of 60°C and constant time (7 hrs for conventional extraction and 20 minutes for ultrasound extraction). The conventional extraction was carried out by using the orbital shaker (Model 780, thermos fisher, US), whereas the ultrasound added extraction was carried out by using the ultrasonic equipment ((VCX 750, Newtown). After the extraction from both conventional and sonication, the mixture was filtered by using a Whatman® filter paper (Whatman, United Kingdom) and final extracts were obtained). The obtained extracts were further concentrated and turn into powder form by using freeze-drying and stored at optimum condition. The adapted processing conditions (time and temperature) were selected based on earlier experiments results of polyphenol extraction through these modules by the same research group. Moreover, in preliminary trials, these conditions elucidated better results among the different tested processing combinations.
Isolation of theaflavin and catechins
The resultant extracts () were utilized for the isolation of respective ingredients. In this context, the green tea (catechins) and black tea (theaflavins) extract were subjected to solvent partition method following the guidelines of Coda et al. .[Citation10] Purposely, the respective tea samples were treated first with chloroform and then ethyl acetate to obtain catechins and theaflavins. Afterward, the ethyl acetate fraction was subjected to a freeze drier (Zirbus, Va Co 5, Germany) at −70 C shelf temperature, −80°C condenser temperature, 760 mm/Hg vacuum pressure for 24 hrs to obtain the powder form of respective nutraceutical. Whereas ginger extract was subjected to freeze-drying and its freeze-dried powder was further utilized. The resultant isolates and prepared ginger freeze-dried extracts were subjected to different antioxidant assays.
Table 1. Treatments used for estimation of solvents extraction efficiency through conventional and ultrasound added extraction
Phytochemical screening assays
Different antioxidant assays were executed through total phenolics, total flavonoids, DPPH, ABTS, and FRAP assay estimation.
Total phenolics (TPC)
The total phenolics (TPC) were the most common assay to estimate the antioxidant potential of the tested compound. Purposely, the equal amount of FC reagent and sample was taken alongside 500 µL of distilled water and provide stay for 5 minutes. Afterward, 4.5 mL of 7% Na2CO3 was added and provided to stay for 90 minutes. Lastly, the absorbance was measured through a spectrophotometer (IRMECO, U2020) at 760 nm. The total phenolics were calculated as gallic acid equivalent (mg gallic acid/g) following the procedure of .[Citation11]
Antioxidant potential
DPPH Radical Scavenging Assay: DPPH (1,1-diphenyl-2-picrylhydrazyl) free radical scavenging ability estimation is the most common test to apprehend the antioxidant potential of the tested compound. In short, sample and DPPH solution (0.12 mM) were added to the test tube in the ratio of 4 and 1 mL, respectively and placed for 30 minutes in a dark place. Afterward, absorbance was measured at 520 recorded by using UV/Visible Spectrophotometer alongside control and blank .[Citation12]
ABTS (2,2ʹ-azino-bis, 3-ethylbenzothiazoline-6-sulfonic acid) Assay: ABTS assay of the ginger extract was estimated conferring to the method outlined by Piljac-Žegarac et al. .[Citation13] For the preparation of ABTS radicals, % mL freshly prepared ABTS solution (7 mM) was mixed with 5 mL potassium persulfate solution (2.45 mM) to make 10 mL total volume. The mixture was transferred to an opaque bottle and allowed to stand for 16 hrs in a dark place to achieve the stable oxidized state. The mixture was diluted with ethanol and was adjusted to give 0.7 absorbances at 734 nm. Additionally, 10 µL ginger extract was added 1 mL ABTS solution, mixed thoroughly and subjected to spectrophotometry to measure the absorbance at 734 nm after 30 min stays time. The antioxidant activity using the Trolox standard curve was reported in µmol Trolox/g sample extract.
Ferric Reducing Antioxidant Power (FRAP): The metal ion chelation ability is another parameter to access the antioxidant capacity of the tested compounds under different challenges and for this ferric reducing antioxidant power is the most adapted test. For estimation of FRAP, 0.5 mL of sample was added in 125 mL of phosphate buffer prepared 0.2 M and pH of 6.6 and potassium ferricyanide solution (1%), placed in the water bath at 50°C for 15 min. In the resulted sample, an equal amount of 1.25 mL Trichloroacetic acid (10%) and distilled water alongside 0.25 mL of ferric chloride (1%) were added and provide stay time for 10 min and record the reading at 700 nm.[Citation5,Citation13]
HPLC quantification
For the quantification of theaflavins and catechins, a reverse phase HPLC system (PerkinElmer, Series 200, USA) was adapted with C18 column,10 μL sample size and column temperature of 40°C. Whereas, acetonitrile, ethyl acetate and phosphoric acid in ratio of 21:3:76 were utilized as mobile phase and quantification was done with UV/vis detector (model 481) at a wavelength of 278 nm .[Citation5] Likewise, gingerol is the most abundant antioxidant in ginger and its estimation is important to impart positive health benefits to the ginger. Purposely, HPLC quantification was carried out for gingerol contents estimation in ginger extracts obtained through all extraction techniques. Briefly, reverse phase HPLC (PerkinElmer, Series 200, USA) with C18 column. The mobile phase was comprised of methanol/water, 65:35 (v/v), with a sample size of 1 mL, with 1.0 mL/min flow rate. For estimation, UV detection was made at 282 nm. The calculation was made by comparing the peak time and height with the gingerol standard .[Citation14]
Statistical analysis
The data for each parameter was analyzed statistically to check the level of significance. For analysis of variance, one-way and two-way ANOVA were performed and for the estimation of significance among the means, Tukey’s HSD test was applied. The values were represented in mean ± S.D.
Results and discussions
Proximate and minerals estimation
The compositional assessment like proximate and mineral profiles is the reliable indicators for the estimation of therapeutic and nutritional worth of the tested materials. Likewise, Black tea, green tea and ginger (dry weight basis) were tested for different proximate compositions and black tea showed 7.34 ± 0.20, 4.71 ± 0.06, 15.42 ± 0.51, 15.73 ± 1.52, 5.06 ± 0.08, and 54.17 ± 1.97%, of moisture, fat, protein, fiber, ash, and NFE, respectively. Similarly, in green tea (dry weight basis) the moisture, protein, fat, fiber, ash, and NFE were recorded as 5.18 ± 0.09, 18.46 ± 1.06, 2.89 ± 0.13, 15.75 ± 1.05, 5.81 ± 0.21, and 53.86 ± 1.75, respectively (). The mean values for moisture, protein, fat, fiber, ash and carbohydrate content were found to be 79 ± 1.1, 3.24 ± 0.21, 1.21 ± 0.01, 3.70 ± 0.04, 3.60 ± 0.01, and 10.2 ± 0.02%, respectively in ginger samples.
Table 2. Compositional analysis of black tea, Green tea & Ginger powder (%)
Mineral profile in the current study () included potassium, calcium, sodium, manganese, iron, and zinc and their respective concentrations were 1887.50 ± 75.79, 336.53 ± 19.66, 7.76 ± 0.38, 68.19 ± 3.83, 21.42 ± 1.78, and 4.22 ± 0.13 mg/100 g in Black tea. Likewise, the recorded values for sodium, potassium, calcium, manganese, iron, and zinc in green tea were 7.55 ± 0.14, 1708.13 ± 51.50, 379.75 ± 19.75, 66.42 ± 3.93, 20.73 ± 0.72, and 3.08 ± 0.14 mg/100 g, respectively. Moreover, Na (24.6 ± 0.24 mg/100 g), K (1207.19 ± 5.55 mg/100 g), Ca (82.±0.94 mg/100 g), Zn (21.1 ± 0.05 mg/100 g), Mn (198 ± 1.11 mg/100 g), and Fe (17.8 ± 0.90 mg/100 g) were estimated in ginger samples.
Table 3. Mineral profile of black tea, Green tea & Ginger powder (mg/kg)
Extracts/isolate characterization
Extract analysis
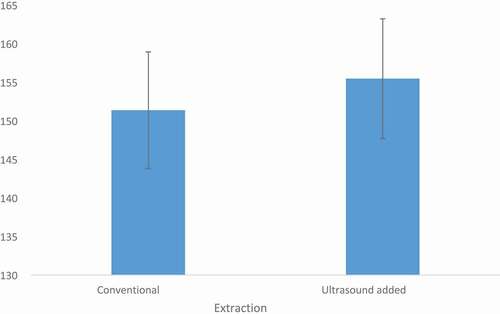
Among the extraction mode, ultrasound-assisted extraction exhibited a significantly (p ≤ 0. 001) better effect as compared to conventional solvent extraction. Likewise, in solvents, ethanol elucidated the highest yield followed by methanol and water in both ultrasound and conventional extraction modules. Amongst the tested compounds, green tea exhibited the richest antioxidant profile followed by black tea and ginger. From , it was evident that the ultrasound extracted compounds exhibited higher antioxidant scores as compared to their conventional solvent-extracted extracts.
Figure 1. Total antioxidant scores comparison between the conventional and ultrasound added extraction techniques. The scores were calculated from the cumulative means of all antioxidant indices for both techniques like TPC, DPPH, B-carotene, FRAP and ABTS. The outcomes indicated the significant differences (P > .001) between the extraction techniques
Means for total phenolic contents (TPC) of GT extract showed the highest TPC in ethanolic extract of ultrasound and conventional extraction as 1005 ± 1.02 and 995 ± 2.43, mg/100 g GAE, respectively followed by methanol 890 ± 4.45 and 880 ± 2.34 mg/100 g GAE, respectively, while, the lowest 789 ± 4.84, 784 ± 1.98 mg/100 g GAE were detected in water extract, respectively. Likewise, the trend was observed for black tea (BT) maximum TPC value was exhibited by ethanol as 915 ± 6.42, 894 ± 1.02, mg/100 g GAE, respectively in Ultrasound and conventional extraction followed by methanol 788 ± 4.49, 767 ± 1.09 mg/100 g GAE, respectively, and water 649 ± 4.21, 635 ± 1.2 mg/100 g GAE for respective extraction techniques. Similarly, ginger freeze-dried extract (GFDE) also revealed the same trend; highest in ultrasound followed by conventional extraction and maximum in ethanol and minimum in water (). Means regarding DPPH activity of GT extracts () indicated the highest DPPH in ethanolic extract of ultrasound and conventional extraction as 77 ± 4.65, 66.33 ± 2.51%, respectively. Whereas, the recorded concentration for methanol and water were 69.67 ± 1.68, 55 ± 1.98 and 62.67 ± 2.44 and 56 ± 4.55%, respectively for ultrasound and conventional extraction. Likewise, in BT the recorded DPPH values in ethanolic extract of ultrasound and conventional extraction were 75 ± 1.09 and 65 ± 1.09%. Similarly, in ginger, the DPPH was in the range of 49% to 61% with the highest in ultrasound ethanolic extract ().
Table 4. Effect of solvents & Extraction mode on TPC (mg/100 g GAE) of tea extracts & Ginger
Table 5. Effect of solvents & Extraction mode on DPPH (%) of tea extracts & Ginger
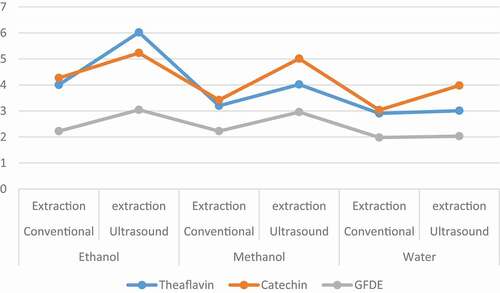
Figure 2. HPLC quantification (g/100 g) of isolated contents. Absolute values for theaflavins, catechins and Ginger freeze dried extract (GFDE) fractions characterize through reverse phase HPLC in mg/g. Three solvents and two techniques were applied, and comparison were made between solvents and extraction techniques. Two-way repeated ANOVA was applied and level of significance was determined at (p ≤ 0. 05)
Ethanolic solvent showed the highest beta carotene contents in ultrasonic extraction of 70 ± 2.25% followed by methanol 67 ± 2.25%, and the lowest 65 ± 3.45 were detected in an aqueous extract of GT. Likewise, the maximum value of β carotene (65 ± 3.05%) was recorded in ethanol trailed by methanol (58 ± 2.18%) and water (52 ± 1.75%) in ultrasound added extracts of BT. However, in ginger the highest β carotene value was observed in methanol 55 ± 1.94%, followed by ethanol 54 ± 1.81% and water 48 ± 1.27%. Likewise, the trend was observed in the conventional extraction method ().
Table 6. Effect of solvents & Extraction mode on β carotene (%) of tea extracts & Ginger
The recorded FRAP values in ethanolic, methanolic and water extract of ultrasound added extracts of green tea, black tea, and ginger were 825 ± 2.45, 800 ± 1.34 and 470 ± 1.6 µM Fe+2/g, 801 ± 2.12, 777 ± 1.45, and 431 ± 1.78 µM Fe+2/g and 785 ± 1.98, 715 ± 1.43 and 412 ± 2.02 µM Fe+2/g, respectively. Likewise, in conventional extraction maximum values of FRAP were observed in ethanol (812 ± 2.45) trailed by methanol (791 ± 2.12) and minimum output (768 ± 1.98) was recorded in aqueous green tea extract. Similar observations were recorded for black tea and ginger ().
Table 7. Effect of solvents & Extraction mode on FRAP (µM Fe+2/g) of tea extracts & Ginger
The recorded ABTS concentrations of green tea in ultrasound added extracts of ethanol, methanol, and water were 22.52 ± 0.77 µM TE/g, 17.65 ± 0.61 µM TE/g, and 15.71 ± 0.47 µM TE/g, respectively. Similarly, black tea in ultrasound added extraction exhibited the highest ABTS 17.84 ± 0.55 µM TE/g in ethanol, followed by methanol 16.07 ± 0.47 µM TE/g, and the lowest 12.36 ± 0.67 µM TE/g in the water extract. In addition, the ginger extracts expounded the highest ABTS value (11.10 ± 0.14 µM TE/g) in ethanol followed by methanol (9.56 ± 0.27 µM TE/g) and water (8.67 ± 0.25 µM TE/g). Likewise, in conventional extraction, the highest ABTS 0.678 ± 0.00768 µM TE/g were detected in ethanol followed by methanol 0.520 ± 0.006 µM TE/g, and water 0.458 ± 0.008 µM TE/g in GT. A similar trend was observed for black tea and ginger, maximum in ethanol, and minimum in water ().
Table 8. Effect of solvents & Extraction mode on ABTS value (µM TE/g) of tea extracts & Ginger
Table 9. Effect of solvents & Extraction mode on DPPH (%) of Isolated components
Isolate analysis
The isolates like catechins, theaflavins, and ginger freeze-dried extract (GFDE) were also obtained from green tea, black tea, and ginger, respectively. The obtained isolates were subjected to their antioxidant activity estimation through DPPH, β carotene, and FRAP assay by dissolving in ethanol, methanol and water. Means for DPPH value of catechins, theaflavins and GFDE obtained through conventional extraction indicated the highest activity in ethanolic fractions as 85.26 ± 4.43, 79.71 ± 5.61, and 52 ± 2.46%, respectively followed by methanol 78.89 ± 3.54, 74.75 ± 4.43, and 50 ± 2.45%, respectively and water 78.43 ± 3.89, 72.69 ± 6.95, and 49 ± 3.6%, correspondingly (). Similarly, for ultrasonic extraction, the maximum DPPH values for catechin, theaflavin, and GFDE were observed in ethanol (94.33 ± 4.23, 86.44 ± 5.68, and 67 ± 2.60%) trailed by methanol (88.85 ± 3.23, 81.71 ± 4.32, and 58 ± 2.25%) and water (82.33 ± 3.74, 76.59 ± 5.95, and 52 ± 2.65), respectively.
The ethanolic fraction of catechins exhibited the maximum β carotene activity 71.86 ± 1.22% than methanol 67.27 ± 1.32% and water 64.24 ± 1.05%. Similarly, theaflavins also elucidated the same trend and recorded values for this trait were 75.51 ± 1.50, 71.79 ± 1.72 and 67.66 ± 2.32% in ethanolic, methanolic, and water fractions, respectively. The ß-carotene activity of GFDE in ethanol was (50 ± 0.71%), whereas 48 ± 1.09 and 41 ± 1.03% was observed in methanol and water extract, respectively. Likewise, trend was reflected in ultrasound-based fractions; maximum in ethanol followed by methanol and water ().
Table 10. Effect of solvents & Extraction mode on β carotene (%) of Isolated components
The FRAP values in depicted higher activity for catechins as compared to theaflavins and GFDE. The FRAP values for theaflavins ethanolic, methanolic, and water extract were 948.47 ± 1.23, 696.54 ± 1.32, and 605.97 ± 0.98 μmol Fe2+/g, respectively. Likewise, catechin respective extracts showed FRAP activity as 1026 ± 1.87, 948 ± 2.01, and 947 ± 2.41 μmol Fe2+/g. Similarly, GFDE depicted the highest value in ethanol 566 ± 2.47 μmol Fe2+/g followed by methanol 606 ± 2.54 μmol Fe2+/g while minimum output 500 ± 2.77 μmol Fe2+/g in water. In ultrasonic extraction, the means for FRAP values of theaflavin showed maximum activity in ethanol 1000.60 ± 1.23 μmol Fe2+/g than methanol 745.27 ± 1.32 μmol Fe2+/g and water 654.96 ± 0.98 μmol Fe2+/g. Similarly, for catechin the recorded FRAP values for respective solvents were 1070 ± 1.58 μmol Fe2+/g, 986 ± 2.01 μmol Fe2+/g, and 877 ± 1.36 μmol Fe2+/g, respectively. The FRAP values of GFDE in ethanol, methanol, and water were 612 ± 2.65 μmol 658 ± 2.48, and 543 ± 2.87 μmol Fe2+/g, respectively.
Table 11. Effect of solvents & Extraction mode on FRAP (µM Fe+2/g) of Isolated components
HPLC quantification of theaflavin, catechins, and ginger freeze dried extracts
Means for extraction yield illuminated the highest theaflavin (6.02 ± 0.15 and 4.005 ± 0.25 g/100 g) in ethanolic extract followed by methanol (4.02 ± 1.25 and 3.200 ± 1.36 g/100 g) whilst water exhibited the lowest yield (3.01 ± 1.01 and 2.908 ± 1.21 g/100 g). Similarly, for catechins, ethanol showed maximum extraction recovery (5.231 ± 1.21 and 4.269 ± 0.96 g/100 g) as compared to methanol (5.012 ± 0.88 and 4.269 ± 1.05 g/100 g) and water (3.98 ± 0.89 and 3.035 ± 1.18 g/100 g). Likewise, in the case of ginger freeze-dried extract, ethanol showed the highest yield (3.045 ± 0.32 and 2.964 ± 0.65 g/100 g) as compared to methanol (2.96 ± 0.88 and 2.225 ± 1.32 g/100 g) and water (2.032 ± 1.23 and 1.981 ± 1.58 g/100 g), respectively for ultrasound added extraction and conventional extraction ().
Discussion
The results regarding the compositional profile are in harmony with the observations of Coda et al.,; Hussain et al.,[Citation10,Citation11] observed that both green and black tea contain appreciable amount protein and fiber. Likewise,[Citation12] observed 6.12 to 8.25, 2.56 to 4.23, 13.24 to 19.21, 13 to 16.25, 2.21 to 6.12%, moisture, fat, protein, fiber, and ash, respectively. The findings regarding the minerals of the current investigation are corroborated with the observations of different researcher groups like[Citation5,Citation13–16] narrated that green and black tea has rich mineral potential with special reference to Na, K, Ca, Mn, Zn and Fe. However, they ascribed the variations as the function of climate, agronomic practices and soil conditions.
The findings of present research regarding the higher polyphenolic yield of tea polyphenols through ethanol and methanol as compared to water are in line with the earlier investigation of[Citation17] probed the effect of different solvents for the polyphenol extraction of tea. Purposely, they utilized ethanol, methanol, dimethylformamide (DMF), water, and acetone for the extraction and observed the highest polyphenols, DPPH in ethanol followed by methanol and water. The recorded values of TPC for ethanol, methanol and water were 1300.30 mg/100 g GAE, 820.30 mg/100 g GAE, 330.30 mg/100 g GAE, respectively, while 68.9, 58.3, and 29.9% DPPH.
Amongst the different extraction modes, solvent extraction has prime importance for the recovery of polyphenols owing to its ease, higher recovery, and easy application. However, to extract maximum benefits, many factors must be taken into account like sample size, solvent-to-material ratio and other relevant parameters. All of these can actively influence the extraction yield.[Citation18]
Likewise, the trend was observed by Cabrera et al.,[Citation19] for DPPH inhibition; more in ethanolic solvent (97.70%) as compared to methanol (95.55%). The different researcher groups, kaur et al.,; chandini et al.,[Citation7,Citation20] expressed that the time and type of solvents are the factors of prime consideration for the polyphenol extraction from tea. The findings of another scientific exploration conducted by Chen et al.,[Citation9] are corroborated with the outcomes of instant exploration. They recorded FRAP and TPC values of different types of black tea and observed variations from 357 to 927 µmol Fe2+/g, and 400 to 1200 mg/100 g GAE, respectively. Later, Costa et al.[Citation8] investigated the antioxidant potential of different black tea samples through the total phenolic estimation, free radical inhibition through DPPH test, and observed values of respective traits were 3000.10 mg/100 g GAE and 75%. Likewise, the tea samples exhibited good free radical scavenging and ß- carotene binding ability. The observed variations in DPPH and ß-carotene were 42.01 to 51.36 and 40.02 to 48%, respectively[Citation21]
The higher antioxidant activity of tea flavonoids is attributed to the presence of a specific chemical structure dominated by vicinal dihydroxy and trihydroxy moieties that can quench metal ions and imparted electron delocalization thus ultimately proved helpful to reduce free radicals production.[Citation22,Citation23] The more extraction efficiency of ethanol for polyphenol as compared to other solvents are in harmony with the findings of Friedman et al.,; Ghasemzadeh et al.,; Ghasemzadeh et al.,[Citation24–26] they observed better tea polyphenol extraction through aqueous ethanol as compared to methanol and water. In this context, they elucidated solvent-to-material ratio, time and temperature can play a vital role. The existing results for the better free radical inhibiting activity of tea polyphenols through ethanol as compared to methanol and water are supported by the findings of Herrero et al.,[Citation27] observed higher DPPH radical scavenging activity (92.20 ± 0.52%) in ethanol as compared to water (88.36 ± 0.76%). Similar findings were documented by Asensio-Vegas et al.,[Citation28] observed higher DPPH free radical scavenging activity through ethanolic extracts elucidated (46.6%) as compared to water extract (41.1%).
The findings regarding the theaflavin extraction yield are coherent with the observations of Hromadkova et al.,[Citation29] noticed higher extraction yield (1.51 g/50 g of theaflavin) from black tea sample. They envisaged that the isolation recovery is dependent upon medium, solvent, time, and temperature; moreover, variety has also influenced this trait. In this contest,[Citation30] observed good polyphenols recovery up to 70% in freeze-dried ribose tea f with special reference to theaflavins and catechins in comparison with their crude extract (13.2%). Likewise, observations were documented by the findings of Jayasekera et al.,[Citation31] recorded the 75 to 80% variations in the recovery of the same bioactive moieties. However, they utilized different time solvents variations to optimize the extraction efficiency. They were of the view that the time and temperature intervention exerted cardinal effect on the isolation.
The effect of different time-temperature interactions on tea polyphenol isolation is well reflected through the findings of Joubert et al.[Citation32] they utilized different time intervals at fixed temperatures and observed the influence on the tea isolate recovery. Purposely, they utilized 10–120 min at 90°C. They observed optimum recovery at 40 min; however, after 60 min a diminishing pattern was observed and the highest degradation was noted at maximum temperature. They expressed that a higher solvent to material ratio and 40°C are the optimum conditions for the extraction of black tea polyphenols. The possible mechanism behind the polyphenol less recovery at high temperature may be associated with their vulnerability at a higher temperature. The higher antioxidant activity of tea isolates as compared to their extract in the current study is verified by the outcomes of Khan et al.[Citation33] probed the antioxidant activity of theaflavins and their mixtures from Assam black tea extract (ASTE). They explicated more DPPH value for isolated theaflavins 60–97% as compared to their extracts 40–82%. The isolated components showed higher antioxidant and free radical scavenging activity owing to their purity, structural diversity and multiple mechanistic approaches. In this context, theaflavins and catechins exhibited higher antioxidant capacity owing to the presence of multiple functional groups in C rings. The high free radical tackling potential of isolated black tea polyphenols may ascribe this tendency.[Citation34] Likewise, observations were documented by McAlpine et al.,[Citation35] also recorded the higher antioxidant profiling of isolated components as compared to their respective extracts. Furthermore,[Citation36] expressed that the higher free radical quenching ability is owing to the presence of benzotropolone ring and its gallate structure. The difference in the extraction yield owing to the solvents may be ascribed to the polarity factor and property of the component to be extracted.[Citation37]
Ginger has strong antioxidant potential owing to its major polyphenols like gingerol and others. The promising antioxidant potential of ginger in current research is corroborated with the earlier findings of Masmali et al.,[Citation38] investigated the total phenolic contents and antioxidant activity of different ginger verities and observed better performance of methanol as compared to water. The recorded TPC were varied between 95.2 to 87.5 mg/g dry extract. Whereas, the observed DPPH values were 83.87% and 83.03%, respectively. Moreover, the appreciable ferric reducing antioxidant power (FRAP) has been observed. One of their peers,[Citation39] also carried out the intensive antioxidant activity estimation of different parts of ginger-like leaves, stems and rhizomes of two different varieties i.e. Halia Bentong and Halia Bara. They examined the TPC, FRAP and DPPH of different parts of both varieties by utilizing the two solvents methanol and water. Among the varieties, Halia Bara exhibited a higher antioxidant profile and in solvents methanol performed better as compared to water. The highest antioxidants were detected in rhizomes and least in the stem.
The higher antioxidant potential of Ginger freeze-dried extract (GFDE) in the present research are in agreement with the findings of Fatima et al.,[Citation40] examined the antioxidant potential of ginger freeze-dried extract through different antioxidant indices and observed TPC and DPPH were varied from 670.1 to 725.25 mg/g dry and 80.25 to 901.25%. They were of the view that GFDE has the more concentrated form of polyphenols as compared to their raw extract thus exhibited higher antioxidant activity. Different researchers groups[Citation41–43]also observed higher antioxidant profiling of ginger freeze-dried extract as compared to their crude extract.
It is deduced from the piled evidence that all the tested components i.e. green tea, black tea and ginger have promising antioxidant potential, Likewise, the isolated bioactive molecules catechins (green tea), theaflavin (black tea) and ginger freeze-dried extract (Ginger) exhibited more pronounced effect than their raw extract. Among the solvents highest performance was observed by ethanol followed by methanol and water. Amongst the tested compounds catechins lead over their counterparts. Conclusively, it was inferred that both nutraceutical (catechins and theaflavins) and designer ingredient (GFD) has merit to be incorporated in the preparation of dietary intervention against oxidative stress induce maladies owing to their higher antioxidant potential.
Conclusion
From the above findings, it is envisaged that green tea, black tea and ginger have an appreciable nutritional profile and exhibited strong antioxidant potential. Among the extraction techniques, ultrasound proved more effective for the extraction and isolation of polyphenols from the tested materials. Likewise, among the treatments, green tea showed better performance than the rest and in solvents ethanol performed better as compared to their counterparts. Likewise, the isolates showed higher antioxidant potential as compared to their extracts and the order of effectiveness was catechins>theaflavins>GFDE.
References
- Ahmed, M.; Ahmad, A.; Chatha, Z. A.; Dilshad, S. M. R. Studies on Preparation of Ready to Serve Mandarin (Citrus Reticulata) Diet Drink. Pak. J. Agri. Sci. 2008, 45(4), 470–476.
- Aoshima, H.; Hirata, S.; Ayabe, S. Antioxidative and Anti-hydrogen Peroxide Activities of Various Herbal Teas. Food Chem. 2007, 103(2), 617–622. DOI: https://doi.org/10.1016/j.foodchem.2006.08.032.
- Bekhit, A. E. D. A.; Cheng, V. J.; McConnell, M.; Zhao, J. H.; Sedcole, R.; Harrison, R. Antioxidant Activities, Sensory and Anti-influenza Activity of Grape Skin Tea Infusion. Food Chem. 2011, 129(3), 837–845. DOI: https://doi.org/10.1016/j.foodchem.2011.05.032.
- Castellari, M.; Matricardi, L.; Arfelli, G.; Galassi, S.; Amati, A. Level of Single Bioactive Phenolics in Red Wine as a Function of the Oxygen Supplied during Storage. Food Chem. 2000, 69(1), 61–67. DOI: https://doi.org/10.1016/S0308-8146(99)00240-X.
- Liang, H.; Liang, Y.; Dong, J.; Lu, J. Tea Extraction Methods in Relation to Control of Epimerization of Tea Catechins. J. Sci. Food Agric. 2007, 87, 1748–1752. doi: https://doi.org/10.1002/jsfa.2913.
- Chen, Y. S.; Liu, B. L.; Chang, Y. N. Bioactivities and Sensory Evaluation of Pu-erh Teas Made from Three Tea Leaves in an Improved Pile Fermentation Process. J. Biosci. Bioeng. 2010, 109(6), 557–563. DOI: https://doi.org/10.1016/j.jbiosc.2009.11.004.
- Kaur, M.; Soodan, R. K.; Katnoria, J. K.; Bhardwaj, R.; Pakade, Y. B.; Nagpal, A. K. Analysis of Physico-chemical Parameters, Genotoxicity and Oxidative Stress Inducing Potential of Soils of Some Agricultural Fields under Rice Cultivation. Tro.p Plant Res. 2014, 1(3), 49–61.
- Costa, L. M.; Gouveia, S. T.; Nobrega, J. A. Comparison of Heating Extraction Procedures for Al, Ca, Mg, and Mn in Tea Samples. Anal. Sci. 2002, 18(3), 313–318. DOI: https://doi.org/10.2116/analsci.18.313.
- Chen, H. J.; Inbaraj, B. S.; Chen, B. H. Determination of Phenolic Acids and Flavonoids in Taraxacum Formosanum Kitam by Liquid Chromatography-tandem Mass Spectrometry Coupled with a Post-column Derivatization Technique. Inter. J. Mole. Sci. 2012, 13(1), 260–285. DOI: https://doi.org/10.3390/ijms13010260.
- Coda, R.; Lanera, A.; Trani, A.; Gobbetti, M.; Di Cagno, R. Yogurt-like Beverages Made of a Mixture of Cereals, Soy and Grape Must: Microbiology, Texture, Nutritional and Sensory Properties. Inter. J. Food Microbio. 2012, 155(3), 120–127. DOI: https://doi.org/10.1016/j.ijfoodmicro.2012.01.016.
- Hussain, G.; Saeed, F.; Shahbaz, M.; Ahmed, A.; Imran, M.; Khan, M. A.; Jabeen, F. Reconnoitring the Impact of Different Extraction Techniques on Ginger Bioactive Moieties Extraction, Antioxidant Characterization and Physicochemical Properties for Their Therapeutic Effect. Pak. J. Pharm. Sci. 2019, 32(5), 2223–2236.
- Ostadalova, M.; Pazout, V.; Straka, I.; Tauferova, A.; Bartl, P.; Pokorna, J. Monitoring Tea Pigments Theaflavins and Thearubigins in Dependence on the Method and Duration of Storage. J. Food Tech. 2011, 9(2), 50–56.
- Piljac-Žegarac, J.; Valek, L.; Martinez, S.; Belščak, A. Fluctuations in the Phenolic Content and Antioxidant Capacity of Dark Fruit Juices in Refrigerated Storage. Food Chem. 2009, 113(2), 394–400. DOI: https://doi.org/10.1016/j.foodchem.2008.07.048.
- Yang, X. R.; Wang, Y. Y.; Li, K. K.; Li, J.; Li, C. R.; Shi, X. G.; Song, X. H. Cocoa Tea (Camellia Ptilophylla Chang), a Natural Decaffeinated Species of tea–Recommendations on the Proper Way of Preparation for Consumption. J. Funct. Foods. 2011, 3(4), 305–312. DOI: https://doi.org/10.1016/j.jff.2011.06.001.
- Al-Awwadi, N. A. J.;. Potential Health Benefits and Scientific Review of Ginger. J. Pharm. Phytotherapy. 2017, 9(7), 111–116. DOI: https://doi.org/10.5897/JPP2017.0459.
- Baek, J. Y.; Lee, J. M.; Lee, S. C. Extraction of Nutraceutical Compounds from Licorice Roots with Subcritical Water. Separ. Purifi. Techn. 2008, 63(3), 661–664.
- Bastos, D. H.; Saldanha, L. A.; Catharino, R. R.; Sawaya, A.; Cunha, I. B.; Carvalho, P. O.; Eberlin, M. N. Phenolic Antioxidants Identified by ESI-MS from Yerba Mate (Ilex Paraguariensis) and Green Tea (Camelia Sinensis) Extracts. Molecules. 2007, 12(3), 423–432.
- Butt, M. S.; Sultan, M. T. Ginger and Its Health Claims: Molecular Aspects. Crit. Rev. Food Sci. Nutr. 2011, 51(5), 383–393. DOI: https://doi.org/10.1080/10408391003624848.
- Cabrera, C.; Artacho, R.; Giménez, R. Beneficial Effects of Green Tea—a Review. J. Amer. Colleg. Nut. 2006, 25(2), 79–99.
- Chandini, S. K.; Jaganmohan Rao, L.; Subramanian, R. Influence of Extraction Conditions on Polyphenols Content and Cream Constituents in Black Tea Extracts. Inter. J. Food Sci. Tech. 2011, 46(4), 879–886. DOI: https://doi.org/10.1111/j.1365-2621.2011.02576.x.
- Kitrytė, V.; Bagdonaitė, D.; Venskutonis, P. R. Biorefining of Industrial Hemp (Cannabis Sativa L.) Threshing Residues into Cannabinoid and Antioxidant Fractions by Supercritical Carbon Dioxide, Pressurized Liquid and Enzyme-assisted Extractions. Food Chem. 2018, 267, 420–429. DOI: https://doi.org/10.1016/j.foodchem.2017.09.080.
- Drużyńska, B.; Stępniewska, A.; Wołosiak, R. The Influence of Time and Type of Solvent on Efficiency of the Extraction of Polyphenols from Green Tea and Antioxidant Properties Obtained Extracts. ACTA Scientiarum Polonorum Technologia Alimentaria. 2007, 6(1), 27–36.
- El-Ghorab, A. H.; Nauman, M.; Anjum, F. M.; Hussain, S.; Nadeem, M. A Comparative Study on Chemical Composition and Antioxidant Activity of Ginger (Zingiber Officinale) and Cumin (Cuminum Cyminum). J. Agri. Food Chem. 2010, 58(14), 8231–8237. DOI: https://doi.org/10.1021/jf101202x.
- Friedman, M.; Levin, C. E.; Choi, S. H.; Kozukue, E.; Kozukue, N. HPLC Analysis of Catechins, Theaflavins, and Alkaloids in Commercial Teas and Green Tea Dietary Supplements: Comparison of Water and 80% Ethanol/water Extracts. J. Food Sci. 2006, 71(6), C328–C337. DOI: https://doi.org/10.1111/j.1365-2621.2006.tb12402.x.
- Ghasemzadeh, A.; Jaafar, H. Z.; Juraimi, A. S.; Tayebi-Meigooni, A. Comparative Evaluation of Different Extraction Techniques and Solvents for the Assay of Phytochemicals and Antioxidant Activity of Hashemi Rice Bran. Molecules. 2015, 20(6), 10822–10838. DOI: https://doi.org/10.3390/molecules200610822.
- Ghasemzadeh, A.; Jaafar, H. Z.; Rahmat, A. Antioxidant Activities, Total Phenolics and Flavonoids Content in Two Varieties of Malaysia Young Ginger (Zingiber Officinale Roscoe). Molecule. 2010, 15(6), 4324–4333. DOI: https://doi.org/10.3390/molecules15064324.
- Herrero, M.; Cifuentes, A.; Ibañez, E. Sub-and Supercritical Fluid Extraction of Functional Ingredients from Different Natural Sources: Plants, Food-by-products, Algae and Microalgae: A Review. Food Chem. 2006, 98(1), 136–148. DOI: https://doi.org/10.1016/j.foodchem.2005.05.058.
- Asensio-Vegas, C.; Khedim, M. B.; Rico, D.; Brunton, N.; Rai, D.; Hossain, M.; Martin-Diana, A. B. In-vitro Approach for the Determination of Antioxidant and Anti-inflammatory Activity of Wild Marjoram (Thymus Mastichina L.). J. Food Nutr. Res. 2018, 6(12), 731–739. DOI: https://doi.org/10.12691/jfnr-6-12-3.
- Hromadkova, Z.; Ebringerová, A. Ultrasonic Extraction of Plant Materials––investigation of Hemicellulose Release from Buckwheat Hulls. Ultrason. Sonochem. 2003, 10(3), 127–133.
- Bhutta, Z. A.; Soofi, S.; Cousens, S.; Mohammad, S.; Memon, Z. A.; Ali, I.; Martines, J. Improvement of Perinatal and Newborn Care in Rural Pakistan through Community-based Strategies: A Cluster-randomised Effectiveness Trial. Lancet. 2011, 377(9763), 403–412.
- Jayasekera, S.; Molan, A. L.; Garg, M.; Moughan, P. J. Variation in Antioxidant Potential and Total Polyphenol Content of Fresh and Fully-fermented Sri Lankan Tea. Food Chem. 2011, 125(2), 536–541.
- Joubert, E.; De Beer, D. Phenolic Content and Antioxidant Activity of Rooibos Food Ingredient Extracts. J.Food Comp. Analy. 2012, 27(1), 45–51.
- Khan, N.; Mukhtar, H. Tea Polyphenols for Health Promotion. Life Sci. 2007, 81(7), 519–533.
- Luximon-Ramma, A.; Bahorun, T.; Crozier, A.; Zbarsky, V.; Datla, K. P.; Dexter, D. T.; Aruoma, O. I. Characterization of the Antioxidant Functions of Flavonoids and Proanthocyanidins in Mauritian Black Teas. Food Res. Inter. 2005, 38(4), 357–367. DOI: https://doi.org/10.1016/j.foodres.2004.10.005.
- McAlpine, M. D.; Ward, W. E. Influence of Steep Time on Polyphenol Content and Antioxidant Capacity of Black, Green, Rooibos, and Herbal Teas. Beverage. 2016, 2(3), 17. DOI: https://doi.org/10.3390/beverages2030017.
- McKay, D. L.; Blumberg, J. B. The Role of Tea in Human Health: An Update. J. Amer. Colle. Nut. 2002, 21(1), 1–13.
- Mokrani, A.; Madani, K. Effect of Solvent, Time and Temperature on the Extraction of Phenolic Compounds and Antioxidant Capacity of Peach (Prunus Persica L.) Fruit. Sep. Purif Tech. 2016, 162, 68–76. DOI: https://doi.org/10.1016/j.seppur.2016.01.043.
- Masmali, A. M.; Alanazi, S. A.; Alotaibi, A. G.; Fagehi, R.; Abusharaha, A.; El-Hiti, G. A. The Acute Effect of a Single Dose of Green Tea on the Quality and Quantity of Tears in Normal Eye Subjects. Clin. Ophthalmol. (Auckland, NZ). 2019, 13, 605. DOI: https://doi.org/10.2147/OPTH.S201127.
- Polasa, K.; Krishna, T. P.; Nirmala, K. Modulation of Xenobiotic Metabolism in Ginger (Zingiber Officinale Roscoe) Fed Rats. Inte. J. Nut. Meta. 2013, 2(3), 056–062. DOI: https://doi.org/10.5897/IJNAM.9000026.
- Fatima, S.; Haider, N.; Alam, M. A.; Gani, M. A.; Ahmad, R.; Taha, M. Herbal Approach for the Management of C0VID-19: An Overview. Rev Drug Metab Drug Interact 2020, 1. (ahead-of-print).DOI:https://doi.org/10.1515/dmdi-2020-0150
- Rusak, G.; Komes, D.; Likić, S.; Horžić, D.; Kovač, M. Phenolic Content and Antioxidative Capacity of Green and White Tea Extracts Depending on Extraction Conditions and the Solvent Used. Food Chem. 2008, 110(4), 852–858. DOI: https://doi.org/10.1016/j.foodchem.2008.02.072.
- Sarkar, A.; Bhaduri, A. Black Tea Is a Powerful Chemopreventor of Reactive Oxygen and Nitrogen Species: Comparison with Its Individual Catechin Constituents and Green Tea. Biochem. Biophy. Res. Com. 2001, 284(1), 173–178. DOI: https://doi.org/10.1006/bbrc.2001.4944.
- Hussain, G.; Saeed, F.; Shahbaz, M.; Ahmed, A.; Imran, M.; Khan, M. A.; Jabeen, F. Reconnoitring the Impact of Different Extraction Techniques on Ginger Bioactive Moieties Extraction, Antioxidant Characterization and Physicochemical Properties for Their Therapeutic Effect. Pak. J. Pharm. Sci. 2019, 32(5), 2223–2236.