
 ?Mathematical formulae have been encoded as MathML and are displayed in this HTML version using MathJax in order to improve their display. Uncheck the box to turn MathJax off. This feature requires Javascript. Click on a formula to zoom.
ABSTRACT
There is little or no information on the relationship between the quality of fufu flour and the textural attributes of cooked dough. Quality attributes of flour were therefore correlated with the sensory texture profile analysis (STPA) and instrumental texture profile analysis (ITPA) of the dough produced from six varieties of cassava. Results showed that the water absorption capacity (WAC) of flour had a positive correlation (p < .05, r = 0.90) with the STPA moldability of the cooked dough and a significant negative correlation (p < 0 .05, r = −0.94) with its STPA. The correlation between the STPA hardness of cooked dough and the bulk density of flour was positive and significant (p < .01, r = 0.94) but not significant between the ITPA of cooked dough and the quality attributes of flour. The textural attributes of the eba produced from the TMEB419 variety were hardness and moldability, those for TMS13F1020P0001 were stretchability, gumminess, hardness, and adhesiveness, and those for NR14B-218, TMS13F1153P0001, NR1741, and IITA-TMS-IBA30572 were moldability and stretchability. The information provided in this study might help in the breeding of cassava varieties that would be acceptable to end-users in terms of the quality characteristics of flour and the textural attributes of cooked dough.
Introduction
Texture is the sensory and functional manifestation of the quality attributes of foods, detected from kinesthetic qualities[Citation1,Citation2] and through the senses of sight, hearing, and touch. The texture of cooked root and tuber crops and their products is often cited as a primary determinant of the acceptability of improved and local cassava varieties. Information for breeding purposes on the drivers of the consumer-preferred textural attributes has been limited.[Citation3]
Breeding efforts could be relatively cost-effective if these drivers were ascertained with results observed in early breeding generations.[Citation3] However, breeding for poorly understood traits that require a subjective taste panel is expensive and subject to high variance. It requires a lengthier breeding process (to reduce the number of selected lines for taste and sensory evaluation) and significantly delays new varieties and their adoption.[Citation4] If breeders had laboratory assessments for texture-associated traits, whether biochemical, biophysical, or genetic, they could develop new varieties more quickly and effectively[Citation3] with all the characteristics desired by consumers. Farmers select cassava varieties to meet their income, food security, culinary, and agronomic needs, and preserve their cultural identity while sustaining high-yielding local varieties and those introduced by researchers.[Citation5] Cassava roots are processed into value-added products such as lafun, gari/eba, and fufu.[Citation5]
Fufu is a traditional fermented food product consumed in southern, western, and eastern Nigeria and in other West African countries[Citation6] It is ranked next to gari as an indigenous fermented food in the southern part of Nigeria.[Citation7] The preference for fufu as a staple food is gradually developing in West Africa.[Citation8] Fufu is usually processed by households and rural processors whose practices may differ by culture and region. The variations in processing methods and differences in the biophysical traits of the varieties may change the texture and sensory properties of cooked dough.[Citation9] Thus, knowledge of the textural attributes of products from different varieties would reduce the challenges of balancing the requirements of producers with those of end-users in terms of their preferred quality traits. Hence, this study aimed to evaluate the relationship between the functional and pasting properties and the chemical composition of the flour with the sensory and instrumental texture profiles of the cooked dough from different cassava varieties.
Materials and methods
Materials
Six cassava varieties (NR14B-218, TMS13F1153P0001, TMEB419, NR1741, TMS13F1020P0001, and IITA-TMS-IBA30572) were harvested from the IITA NextGen project farm at Ikenne (Lat 6°84ʹ9”N: Long 3°69ʹ3”E), Ogun State, Nigeria. We used 5 kg of each variety in the production of flour. The breeders were still evaluating all the varieties except for TMEB that was released in 2005. This variety has a starch content of 23.7% and a dry matter content of 25%; it is moderately resistant to cassava mosaic disease (CMD) and can be molded.
Production of fufu flour
We used the traditional method of flour production described by Chijioke et al.[Citation9] with modification. Cassava roots (5 kg) were peeled with a stainless-steel knife, washed with clean water, and soaked in fermenting drums for four days, then pulverized and sieved through a 2 mm sieve. The sediment was packed in woven polyethylene sacks after 2 h and dewatered with a spinning (1000 rpm) machine for 10 min. The cake was granulated and spread inside a cabinet dryer at 60°C for 24 h to avoid gelatinization. After drying, it was milled into flour in a hammer mill, cooled, and packed in polyethylene bags for further analyses.
Functional properties
Bulk Density: We measured flour samples (10 g) into a 50 ml graduated measuring cylinder and tapped this gently on the bench ten times to achieve a constant height of the contents. The sample volume was recorded and expressed as grams per milliliter.[Citation10,Citation11]
Swelling power and Solubility index: We used the method of Afoakwa et al.[Citation12] to determine the swelling power (SWP) and solubility index (SI) of the samples. We weighed about 0.1 g of sample and put a 2.5% aqueous starch dispersion in centrifuge tubes, capped them to prevent spillage, and heated them in a water bath with a shaker (Precision Scientific, Model 25: Chicago, USA) at a temperature of 85°C for 30 min. The tubes were allowed to cool to room temperature and centrifuged after heating (Thelco GLC- 1, 60647: Chicago, USA) at 3,000 rpm for 15 min. The paste was separated from the supernatant and weighed. The liquid above the sediment was evaporated in a hot air oven (Mmert GmbH+Co.KG: D-91126, Germany) at a temperature of 105°C, and the residue was weighed. All determinations were done in duplicates. We calculated the SWP and SI as follows
Water Absorption Capacity: We weighed about 1 g of flour sample into a clean, pre-weighed, and dried centrifuge tube and mixed this adequately with distilled water (10 ml) by vortexing. The suspension was allowed to stand for 30 min and centrifuged (Thelco GLC- 1, 60647: Chicago, USA) at 3,500 rpm for 30 min. After centrifuging, the supernatant was decanted, and the tube with the sediment was weighed after removing adhering drops of water. The weight of water (g) retained in the sample was reported as the WAC.[Citation13]
Dispersibility: We weighed about 10 g of the sample into a 100 ml measuring cylinder, and added distilled water up to the 50 ml mark. The mixture was stirred vigorously and allowed to settle for 3 h. We noted the volume of settled particles and calculated the percentage as follows[Citation14:]
To measure the pasting properties of the fufu flour sample, we used a Rapid Visco Analyzer (Model RVA 4500, Perten Instruments, Australia, PTY, Ltd) equipped with a 1000 cmg sensitivity cartridge. The sample (3.5 g) was weighed into a dried empty canister, and 25 ml of distilled water was added. The mixture was thoroughly stirred; the canister was fitted into the RVA as recommended. The slurry was heated from 50 to 95°C at a rate of 1.5°C/min, held at this temperature for 15 min, then cooled to 50°C. We recorded Peak viscosity, trough, breakdown, final viscosity setback, peak time, and pasting temperature from the pasting profile with the aid of Thermocline for Windows software connected to a computer.[Citation15]
Chemical composition
Starch and Sugar contents: We used the method described by Onitilo et al.[Citation16] to determine the starch and sugar contents and weighed 0.02 g of the sample into a centrifuge tube with 1 ml of ethanol, 2 ml of distilled water, and 10 ml of hot ethanol. The mixture was vortexed and centrifuged at 2000 rpm for 10 min. The supernatant was decanted and used for determining sugar content. The sediment was hydrolyzed with perchloric acid and used to estimate starch content. Phenol and sulfuric acid reagents were used for color development and glucose standards to estimate sugar. We read the absorbance with a spectrophotometer (Genesys 10S UV-VIS, China) at 490 nm.
where A is the absorbance of the sample, I is the intercept of the sample, D.F is the dilution factor (depends on aliquot taken for assay), V is volume, B is the standard curve slope, W is the weight of the sample.
Amylose content: We determined the amylose content of samples by the method described by Mohana et al.[Citation17] and weighed 0.1 g of the sample into a test tube. To this, 1 ml of 95% ethanol and 9 ml of 1 N NaOH were carefully added and vortexed with the test tube mouth covered. The samples were heated for 10 min in a boiling water bath to gelatinize the starch and cooled to room temperature. A 10-times dilution of the extract was made by taking 1 ml and making this up to 10 ml with 9 ml of water. From the diluents, an aliquot of 0.5 ml was taken for analysis. To this, 0.1 ml of the acetic acid solution and 0.2 ml of iodine solution were added. The volume was then made up to 10 ml with 9.2 ml of distilled water. We left the test mixture for 20 min for color development, then vortexed it; we read the absorbance at 620 nm.
Ash content: We weighed 3 g of the flour sample into a well-labeled crucible and placed it in the furnace (VULCANTM furnace model 3–1750) at 600°C for 5 h to burn off moisture and all organic constituents. We recorded the weight of the residue as the ash content.[Citation18]
pH-value: We used the method of AOAC[Citation18] to determine the pH and put ten g of the sample into a 100 mL beaker and added 100 mL of distilled water. We used a standardized pH meter (Mettler Toledo GmbH; 8606 Greifensee, Switzerland) to analyze the pH. Triplicate values were obtained; the mean was taken as a pH value.
Cyanogenic potential: The flour sample (30 g) was homogenized in 250 ml of 0.1 M orthophosphoric acid, the homogenate was centrifuged, and the supernatant was extracted. About 0.1 ml of the extract was treated with linamarin standard to get the total cyanogenic potential (CNP). We ran another assay with 0.1 ml of extract, but used 0.1 ml of 0.1 M phosphate buffer (pH 6.0) to give the non-glucosidic CNP. In a third assay we added 0.6 ml of extract to 3.4 ml of McIlvaine buffer (pH 4.5). It was properly mixed, and 0.2 ml of 0.5% chloramine T and 0.8 ml of color reagent were added to give the free cyanogen.[Citation19] We obtained a standard curve by plotting absorbance values (y-axis) against standard concentration (x-axis): linamarin = 125 ml/ (sample wt × 0.01093); non-glucosidic cyanogen = 125 ml/ (sample wt × 0.03176); free cyanide = 125 ml/ (sample wt × 0.04151).
Preparation of cooked fufu dough for analysis of sensory /instrumental texture profiles
We used the modified method described by Tomlins et al.[Citation20] flour to prepare cooked dough from flour produced from different varieties. We added 50 g of fufu flours from six different varieties to 150 ml of boiled water inside a stainless-steel cooking pot and produced a thick, smooth dough by continuously stirring with a wooden stirrer. The analyses of sensory and instrumental texture profiles were conducted simultaneously, based on parameters such as moldability, stretchability, stickiness, and hardness. We conducted the STPA by presenting coded and duplicate samples of the cooked fufu dough to 15 trained panelists from staff and graduate students at IITA Ibadan who consumed the product regularly.
We examined the ITFA of the cooked fufu samples six times using a Texture analyzer (TA-XTPlus-Stable Microsystems) equipped with a 50 kg load cell. The cooked dough samples were placed inside a closed container to maintain the temperature (28–30°C). The parameters derived from the texture analyzers used were the hardness, adhesiveness, cohesiveness, springiness/stretchability, and gumminess of the cooked dough.
Statistical analysis
We performed the analysis of variance (ANOVA) and Pearson correlation of the data generated using the Statistical Package for Social Sciences (SPSS version 21) and principal component analysis using XLSTAT 2021 version.
Results and discussion
Functional properties of fufu flour from different cassava varieties
The functional properties of foods affect how foods behave during preparation for consumption and their end-use.[Citation21] The average of the functional properties of the fufu flour was water absorption capacity (WAC) 129.05%, bulk density (BD) 59.47%, dispersibility 75.08%, swelling power (SWP) 11.45%, and solubility index (SI) 3.63% (). Significant differences (p < .05) existed in all the functional properties of the fufu flour except in dispersibility and SWP, which were not significantly different (p > .05) ().
Table 1. Functional properties of fufu flour produced from different cassava varieties
The ability of a sample to absorb water is an essential property during its reconstitution in hot water to cooked dough; it is a function of smaller granule sizes and, thus, of higher solubility.[Citation5] The WAC of the fufu flour ranged from 115.28 to 164.65%. This implied that flour produced from TMEB419 (164.65%) would absorb more water during its preparation to the dough than flour made from IITA-TMS-IBA30572 (115.28%) with lower WAC (). We found no statistically significant differences (p > .05) in the WAC of flour produced from IITA-TMS-IBA30572 and the other varieties, except for that of TMEB419, which was significantly different (p < .05). However, Sanni et al.[Citation22] report that the WAC of rotary-dried and flash-dried fufu flour ranges from 49 to 96%, lower than the present study. This might be attributed to differences in drying methods and varieties.
Ikujenlola[Citation23] observes that knowledge of any product’s BD is essential in choosing the suitable material for packaging. The smaller the BD value, the larger the amount of the product that can be packaged in each container volume, thus reducing the space occupied and the costs of packaging and transportation. The BD of flour was higher in TMEB419 (80.02%) and lower in NR1741 (39.60%) (). The BD of fufu flour (43–72%) produced from different cassava varieties by Awoyale et al.[Citation5] is within the range of values reported in this study. Differences in varieties and drying methods may be responsible for the high BD of flour (85–97%) reported by Sanni et al.[Citation22]
The dispersibility of any starchy food is a measure of its reconstitutability in water. The better the dispersibility of starchy food, the better it reconstitutes in water.[Citation24] Flour produced from NR14B-218 and IITA-TMS-IBA30572 (76%) had the highest dispersibility, and flour from TMEB419 (74%) had the lowest (). This implied that flours from NR14B-218 and IITA-TMS-IBA30572 might reconstitute more appropriately in hot water without lumps during the preparation of dough because of their wide dispersibility compared with TMEB419. However, the behavior of flour from all varieties might be the same when reconstituted in hot water as there were no significant differences (p > .05) in their dispersibility. The way the flour was reconstituted in boiled water may influence the formation of lumps.[Citation5] Awoyale et al.[Citation5] report similar values of flour dispersibility; Sanni et al.[Citation22] report a lower dispersibility of 56–61%) for rotary-dried and flash-dried flours.
The SWP and SI show the magnitude of the interaction between starch chains within the amorphous and crystalline domains.[Citation5] The flour produced from TMEB419 (12.33%) had the highest SWP compared with that from IITA-TMS-IBA30572 (10.48%) with a lower SWP (). Awoyale et al. [5[report that the SWP of the flour produced from different cassava varieties ranged from 8.31 to 13.55%; this agreed with the SWP of the flour of the present study. Solubility is related to the extent of leaching of amylose out of starch granules during swelling. It is affected by intermolecular forces and surfactants and other associated substances.[Citation25] The SI of the flour ranged between 2.45 and 5.10% (). This means that fufu flour produced from NR14B-218 might consist of highly associated starch granules with an extensive and strongly bonded micellar structure due to its lower SI, while flour from IITA-TMS-IBA30572 might be made up of weak associated forces owing to its high SI.[Citation26] The SI of this study’s flour fell within the range of values (2.28–9.03%) reported for the SI of flour produced from different cassava varieties.[Citation5]
Pasting properties of fufu from different cassava varieties
The pasting properties are essential knowledge in predicting the behavior of starchy foods during and after cooking since the flour will be reconstituted in hot water to become cooked dough before consumption with preferred soup.[Citation27] The pasting properties of the flour showed that mean peak viscosity was 722.10 RVU, trough viscosity 321.51 RVU, breakdown viscosity 400.60 RVU, final viscosity 428.81 RVU, setback viscosity 107.31 RVU, peak time 4.44 min, and pasting temperature 80.08°C (). Significant differences (p < .05) existed in all the pasting properties.
Table 2. Pasting properties of fufu produced from different cassava varieties
The peak viscosity of the flour ranged between 612.46 and 760.96 RVU. Flour from NR14B-218 had the highest value, and TMS13F1020P0001 the lowest (). The maximum viscosity developed during or soon after the heating portion and contributes to the good texture of starchy paste is called peak viscosity.[Citation28] Hence, fufu consumers who prefer good-textured cooked dough may use flour produced from NR14B-218, NR1741, TMS13F1153P0001, and IITA-TMS-IBA30572 because of they are statistically similar and have higher peak viscosity than flour from TMS13F1020P0001 with low peak viscosity.[28} The quantity of water added during the reconstitution of flour into cooked dough may affect the texture. The peak viscosity of the flour produced from NR14B-218 was higher than the range of values (296.88–709.71 RVU) reported for the peak viscosity of flour made from different cassava varieties.[Citation5] However, a lower peak viscosity value (340.16–507.51 RVU) was reported for rotary-dried and flash-dried fufu flour.[Citation22]
The higher the breakdown viscosity, the lower the ability of the sample to withstand heating and shear stress during cooking.[Citation27] Consequently, flour produced from IITA-TMS-IBA30572 with the highest breakdown viscosity (438.21 RVU) might not withstand heating and shear stress during cooking into cooked dough as well as flour from TMS13F1020P0001 (340.17 RVU) with low breakdown viscosity. The behavior of the flour produced from the IITA-TMS-IBA30572 may be like that of TMEB419 and NR14B-218 because their breakdown viscosity did not significantly differ (p > .05). The breakdown viscosity (103.52–447 RVU) of flour produced from different varieties[Citation5] agreed with the present study. The lower breakdown values (156.94–174 RVU) reported for rotary-dried and flash-dried fufu flour[Citation22] might be attributed to differences in varieties and drying methods.
The parameter mostly used to determine the quality of starchy food is the final viscosity and indicates the material’s ability to form a gel after cooking.[Citation22] The flour produced from TMS13F1153P0001 (503.80 RUV), with the highest final viscosity, might form a gel more quickly after being cooked into dough than flour from TMS13F1020P0001 (385.96 RVU) that had the lowest final viscosity (). The behavior of the product from TMEB419 during cooking might be similar to that of TMS13F1020P0001 because the final viscosity was statistically the same. Awoyale et al.[Citation5] report a final viscosity between 336.80 and 506.04 RVU for flour produced from different cassava varieties, thus supporting the final viscosity of the flour in this study. The final viscosity (431.94 RVU) of rotary-dried flour[Citation22] agreed with the values reported in this study. Bechoff et al.[Citation29] write that fast gelatinization of the starch paste is the attribute that fufu processors highly appreciate. This implies that cooked dough prepared from TMS13F1153P0001 flour might be more acceptable than dough from other flours.
The point where retrogradation of starch molecules occurs is known as the setback viscosity. Lower setback viscosity during the cooling of paste indicates a better resistance to retrogradation.[Citation27,Citation30] This means that cooked dough produced from TMEB419 flour (95.54 RVU) might not weep because of its lower setback viscosity compared to that produced from TMS13F1153P0001 (129.50 RVU) with high setback viscosity (). The cooked dough prepared from IITA-TMS-IBA30572 flour might not retrograde easily because of its setback viscosity which was not significantly different (p > .05) from that of TMEB419. The setback viscosity of the fufu flour reported here was within the range of values (74.96–187.27 RVU) for the setback viscosities of flour produced from different cassava varieties[Citation5] and rotary-dried and flash-dried fufu flour (93.96–136.77 RVU).[Citation22]
The pasting temperature of the flour samples ranged from 78.78 to 81.23°C, with flour from TMS13F1020P0001 and IITA-TMS-IBA30572 having the highest temperature and that from NR14B-218 the lowest (). The pasting temperature measured the minimum required to cook a given food sample with implications for the stability of other components and indicated energy costs[Citation31] This meant that the products from NR14B-218, TMEB419, and TMS13F1153P0001 flours might consume less energy because of their low and statistically comparable pasting temperatures. The peak time, which measures the cooking time, was higher in flour produced from IITA-TMS-IBA30572 (4.57 min) and lower in flour from NR14B-218 variety (4.27 min), although all the samples might form a cooked dough in less than 5 min.[Citation27] The pasting temperature and peak time reported in this study were within the range of values of pasting temperature (72.73–84.58°C) and peak time (4.13–5.40 min.) for flours that Awoyale et al.[Citation5]produce from different varieties. The peak time (4.68–4.78 min) of rotary-dried and flash-dried flours agreed with the present study, but their pasting temperature (63.77–65.11 RVU) was lower.[Citation22]
Chemical composition of fufu flour from different cassava varieties
The chemical composition of the flour produced from different varieties showed that the mean of starch is 78.34%, sugar 1.82%, amylose 30.31, ash 0.36%, pH 4.52, and cyanogenic potential (CNP) 0.28 mg HCN/kg (). Akingbala et al.[Citation32] report that starch content is one of the vital quality indices of starchy food which determine the texture of the cooked dough. The starch content was higher in flour produced from TMS13F1020P0001 (79.42%) and lower in flour made from TMEB419 (76.60%). There were no significant differences in the starch content of the flour produced from NR14B-218, TMS13F1020P0001, TMS13F1153P0001, and IITA-TMS-IBA30572 (). There was more conversion of starch into sugar during fermentation in flour produced from TMEB419 (2.07%) and less in that of NR14B-218 (1.69%)[Citation32] (). Also, no significant differences were observed in the sugar content of the flour produced from NR1741, NR14B-218, TMS13F1020P0001, TMS13F1153P0001, and IITA-TMS-IBA30572. The starch content (84.75–90.59%) reported for flour made from different varieties[Citation5] was higher than the flour in this study and might be attributed to different varieties and processing methods.
Table 3. Chemical composition of fufu produced from different cassava varieties
The amylose content of starchy foods determines the stability of the viscous solution formed when starch is heated.[Citation21] Thus, the higher the amylose content of the flour, the higher the retrogradation of the starch molecules after cooking. This implied that cooked dough prepared from TMS13F1020P0001 flour (33.79%) might exhibit an increased rate of retrogradation because of its high amylose content than flour from TMS13F1153P0001 (26.58) with a low amylose content ().
The ash content ranged between 0.29 and 0.43%, with fufu flour produced from TMS13F1153P0001 having the most and flour from TMS13F1020P0001 the least (). The mineral status reflects the ash content even though contamination during processing could indicate a high ash concentration in a sample.[Citation33] The ash contens of all the samples produced from different cassava varieties fell below the regulatory value of the Codex Alimentarius Commission.[Citation34] and were within the range of values reported by Etudaiye et al.[Citation35] (0.05–2.80%) and Awoyale et al.[Citation5] (0.25–1.51%) for flour produced from different cassava varieties.
The pH value measures the degree of acidity or alkalinity of fermented products[Citation36] and was higher in TMSF1153P001 (5.01) and lower in TMS13F1020P0001 (4.14) (). The breakdown of starch in the fresh cassava roots by Corynebacterium manihot to simple sugars and its subsequent fermentation to produce lactic and formic acids might be responsible for the low pH values in some of the flour samples.[Citation37] Awoyale et al.[Citation5] reported a comparable pH value (4.1–6.45) for flour produced from different cassava varieties.
Cassava contains hydrogen cyanide, which occurs because of the hydrolysis of cyanogenic glucosides, a group of nitriles-containing compounds that yield cyanide after an enzymatic breakdown. This cyanogenic glycoside is toxic to humans if the roots are not adequately processed before consumption.[Citation38] CNP content in the flour ranged from 0.12 to 0.61 mg HCN/kg, with the product from NR1741 having the highest value and that from TMEB419 the lowest (). The CNP content of all flour samples was very low compared to the standard of the Codex Alimentarius Commission (10 mg HCN/kg[Citation34]); thus, they might be free from cyanide and safe for human consumption.
Sensory texture profile of cooked fufu dough produced from different cassava varieties
The result of the sensory texture profile of the cooked dough produced from different varieties showed that they were moderately stretchable, hard, sticky, and could be molded (). The sensory texture attributes of dough were all significantly different (p < .05) except for stretchability ().
Table 4. Sensory texture profile of cooked fufu dough produced from different cassava varieties
The cooked doughs from TMEB419 and NR1741 were more stretchable than the other varieties. However, there was no statistically significant difference (p > .05) in the stretchability of the cooked dough prepared from all the flours from different varieties (). There was an insignificant correlation between the stretchability of the cooked dough and the WAC (p > .05, r = 0.60) and starch content (p > .05, r = – 0.75) of the flour ().
Table 5. Correlation of the functional and pasting properties and the chemical composition of fufu flour with the sensory and instrumental texture profile of the cooked dough produced from different varieties
Even though there were significant differences (p < .05) in the hardness of some of the doughs prepared from the different flours, all cooked doughs fell within the category of moderately hard products (). There was no significant difference (p > .05) in the hardness of the cooked doughs prepared from flours of TMS13F1153P0001, TMEB419, and IITA-TMS-IBA30572. We observed a significant and positive correlation (p < .01, r = 0.94) between the hardness of the cooked dough and the bulk density of the flour ().
The cooked dough prepared from TMS13F1020P0001 flour was stickier than the product from TMEB419 flour (). The less sticky the cooked dough, the better the acceptability.[Citation9,Citation39,Citation40] Hence, the dough prepared from TMEB419 flour might be more acceptable to the consumers than those from other flours. The high WAC of the flour produced from TMEB419 might be responsible for the less sticky cooked dough, as a significantly negative correlation (p < .01, r = – 0.94) existed between the WAC of the flour and the stickiness of the dough. The correlation between the starch content of the flour and the stickiness of the cooked dough was positive but not significant (p > .05, r = 0.69) (). This agrees with the observation of Bechoff et al.,[Citation29] who report a significant positive relationship between the starch content of flour and the stickiness of the cooked dough.
The dough prepared from TMEB419 flour was more flexible than those prepared from other varieties (). A significant difference (p < .05) existed between the moldability of dough prepared from TMEB419 flour and those of the other varieties. A significant and positive correlation existed between the pliability of the dough and the WAC of fufu flour (p < .05, r = 0.90) (). This means that the high WAC of the TMEB419 flour might be responsible for the plasticity of the cooked dough. However, a negative but not significant correlation (p > .05, r = – 0.57) existed between the dough’s moldability and the flour’s starch content.
Instrumental texture profile of cooked dough produced from different cassava varieties
shows the instrumental texture profile of the cooked fufu dough prepared from different varieties. The mean of the profiling was hardness 30.77 N/m2, adhesiveness 43.91 N/m2, moldability 0.96, stretchability 0.97, and gumminess 29.26 N/m2. Significant differences (p < .05) existed in all the instrumental texture attributes of the cooked dough, except for adhesiveness and stretchability, which were not significantly different (p > .05) (). No significant correlation (p > .05) was observed between the ITPA attributes of the dough, all the functional and pasting properties, and the chemical composition of the flour ().
Table 6. Instrumental texture profiling of cooked fufu dough produced from different cassava varieties
Hardness is the force required to compress the cooked dough. Hardness is also defined as an indicator of the most direct response to taste, directly affecting chewiness, gumminess, and cohesiveness in the texture profile analysis[Citation3,Citation41] The product from TMEB419 flour (45.34 N/m2) was significantly (p < .05) harder than that prepared from the flour of TMS13F1153P0001 (19.37 N/m2) (). The ITPA hardness of the dough has a positive correlation with functional properties of the flour (except for dispersibility) and a negative correlation with pasting properties (except for breakdown viscosity and pasting temperature) and with chemical composition (except for amylose content) ().
Adhesiveness is how the cooked dough sticks to the hand, mouth surface, or teeth.[Citation41] The adhesiveness of the dough ranged from – 54.64 to – 30.61 N/m2, with the product from TMS13F1020P0001 flour having the highest value (p < .05) and that from NR14B-218 flour having the lowest (). The ITPA adhesiveness of the cooked dough had a positive correlation with all the functional properties (except for WAC and SI), pasting properties, and chemical composition (except for sugar and starch, ash content, and pH value) of the flour ().
Moldability defines how well the product withstands a second deformation relative to its first resistance and is calculated as the work area during the second compression divided by the work area during the first.[Citation3] Usually, the cooked dough is squeezed manually, during which the mechanical and geometrical characteristics are assessed, then molded into balls with the hand, dipped into the soup, and swallowed. The moldability of the dough ranged from 0.92 in TMS13F1020P0001 flour to 0.99 in the TMS13F1153P0001 flour (). The ITPA moldability of dough was positively correlated with all the functional properties of the flour (except for WAC, SWP, and dispersibility), with the pasting properties (except for peak and breakdown viscosities and pasting temperature), and with the chemical composition (except for amylose content) ().
Stretchability or elasticity is the degree to which the cooked dough returns to its original shape after compression between the teeth.[Citation3,Citation41] The stretchability was less in the product from TMS13F1020P0001 flour (0.75) and more in the product from TMEB419 (1.06) (). The stretchability of the dough also had a positive correlation with all the functional properties of the flour (except for solubility index and dispersibility), with pasting properties (except for setback viscosity, peak time, and pasting temperature), and with chemical composition (except for starch and amylose contents) ().
The energy required to disintegrate a semi-solid food until it can be swallowed is known as gumminess. It is calculated as cohesiveness multiplied by hardness[Citation3,Citation41] The product from TMEB419 flour (42.38 N/m2) had significantly (p < .05) more gumminess than the product from TMS13F1153P0001 (19.27 N/m2) (). The ITPA gumminess of the dough had a positive correlation with the functional properties of the flour (except for dispersibility) and negative correlations with the pasting properties (except for breakdown viscosity and pasting temperature) and with chemical composition (except for amylose content) (). The ITPA of the cooked fufu doughs produced from cassava varieties is shown in .
Figure 1. Instrumental texture profile analysis curve of cooked fufu dough produced from NR14B-218 gari.
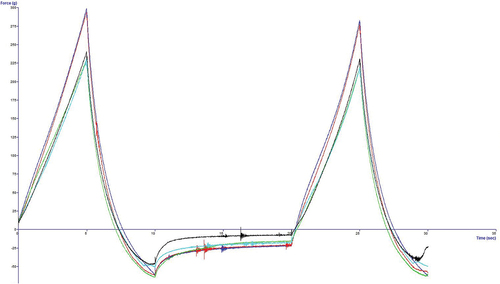
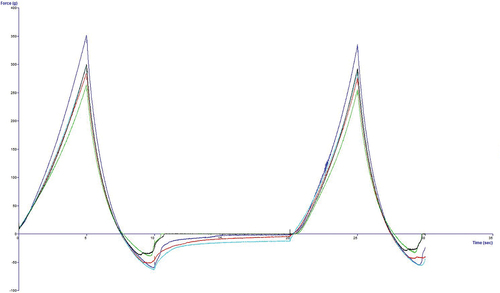
Figure 2. Instrumental texture profile analysis curve of e cooked fufu dough produced from TMS13F1153P0001gari.
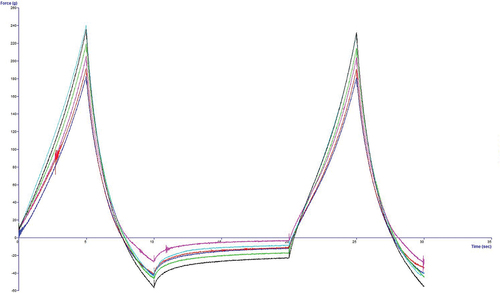
Figure 3. Instrumental texture profile analysis curve of cooked fufu dough produced from TMBE419 gari.
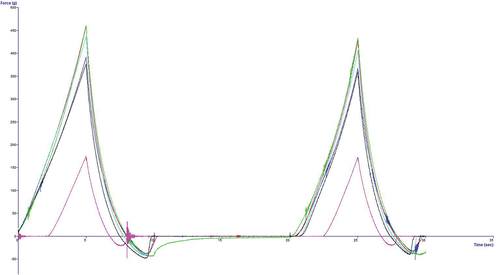
Figure 4. Instrumental texture profile analysis curve of cooked fufu dough produced from NR1741 gari.
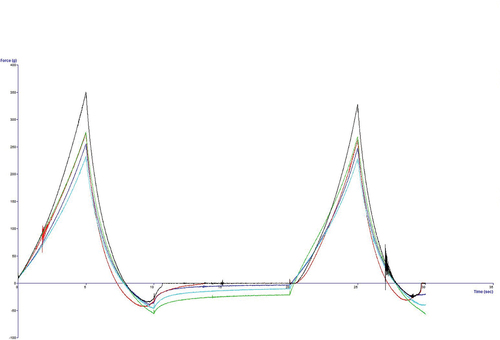
Figure 5. Instrumental texture profile analysis curve of cooked fufu dough produced from TMS13F1020P0001 gari.
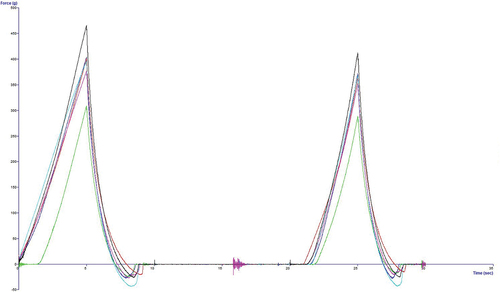
Figure 6. Instrumental texture profile analysis curve of cooked fufu dough produced from IITA-TMS-IBA30572 gari.
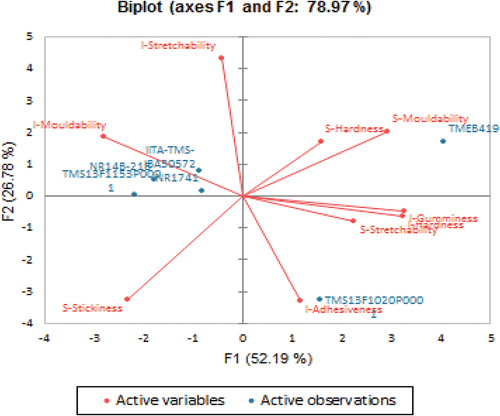
The principal component analysis (PCA) biplot () allowed us to draw a line between the cassava varieties and the cooked fufu dough’s sensory/instrumental texture attributes. The result showed a data variance of about 78.97%, with the principal component one (PC1) contributing 52.19% and principal component two (PC2) contributing 26.78%. The PC1 was positively correlated with sensory texture attributes such as stretchability (r = 0.67) and moldability (r = 0.88), as well as the instrumental texture attributes such as hardness (r = 0.98) and gumminess (r = 0.99). A negative correlation existed between the PC1 and the sensory texture attribute (stickiness; r = – 0.70) and the instrumental texture attribute (moldability; r = – 0.84). In addition, the PC2 had a negative correlation with the sensory texture attribute (stickiness; r = – 0.70) and the instrumental texture attribute (adhesiveness; r = – 0.71) (). The correlation between the PC2 and the stretchability of the instrumental texture profile is positive (r = 0.93) (). The variety TMEB419 was in quadrant 1 with sensory texture attributes (hardness and moldability), while TMS13F1020P0001 was in quadrant 2 with the sensory texture attribute (stretchability) and the instrumental textural attributes (gumminess, hardness, and adhesiveness). The varieties NR14B-218, TMS13F1153P0001, NR1741, and IITA-TMS-IBA30572 were in quadrant 4 with the instrumental textural attributes (moldability and stretchability) ().
Figure 7. Biplot of cooked fufu dough’s sensory and instrumental texture attributes produced from different cassava varieties. Active variables are the sensory and instrumental texture attributes that were observed. Active observations are the cassava varieties. S-Sensory texture attribute, I–Instrumental texture attribute.
Conclusion
This study showed no significant correlation between the STPA attributes of the cooked fufu dough and the pasting properties and chemical composition of the fufu flour. The WAC of the flour had a significant and positive correlation with the STPA moldability of the cooked dough and a significant and negative correlation with the STPA stickiness. The correlation between the STPA hardness of the cooked dough and the bulk density of the flour was positive and significant. There was no significant correlation between the ITPA attributes of the cooked dough, all the functional and pasting properties, and the chemical composition of the flour. The TMEB419 variety was in the same quadrant with the hardness and moldability of the sensory texture profile. In contrast, TMS13F1020P0001 was in the same quadrant with the stretchability of the sensory texture profile and the gumminess, hardness, and adhesiveness of the instrumental texture profile. The varieties NR14B-218, TMS13F1153P0001, NR1741, and IITA-TMS-IBA30572, on the other hand, were in the same quadrant with the moldability and stretchability of the instrumental texture profile. The information provided in this study might help in breeding cassava varieties that would be acceptable to end-users in terms of the quality characteristics of the flour and the textural attributes of the cooked dough.
Ethical statements
The authors of this study declare that the sensory evaluation followed the tenets of the Declaration of Helsinki promulgated in1964 and was approved by the institutional ethical review committee. In addition, verbal consent was obtained from the participants.
Acknowledgments
The authors acknowledged the CGIAR Research Program’s support on Roots, Tubers and Bananas (RTB), the staff of Food and Nutrition Sciences Laboratory, and the Cassava Breeding Unit, IITA Ibadan, Nigeria. The authors would like to especially acknowledge Dr Ismail Rabbi of the Breeding Unit of IITA.
Disclosure statement
No potential conflict of interest was reported by the author(s).
Additional information
Funding
References
- Szczesniak, A. S. Texture Is a Sensory Property. Food Qual. Prefer. 2002, 13(4), 215–225. DOI: 10.1016/S0950-3293(01)00039-8.
- Civille, G. V.; Ofteda, K. N. Sensory Evaluation Techniques — Make “Good for You” Taste “Good.” Physiol. Behav. 2012, 107(4), 598–05. DOI: 10.1016/j.physbeh.2012.04.015.
- Goddard, J.; Harris, K. P.; Kelly, A.; Cullen, A.; Reynolds, T., and Anderson, L. Root, Tuber, and Banana Textural Traits. A Review of the Available Food Science and Consumer Preferences Literature. Prepared for the Agricultural Policy Team of the Bill & Melinda Gates Foundation by the Evan School Policy Analysis and Research (EPAR) University of Washington, Washington DC, 2015, pp. 52.
- Van Oirschot, Q. E.; Rees, D.; Aked, J. Sensory Characteristics of Five Sweet-potato Cultivars and Their Changes during Storage under Tropical Conditions. Food Qual. Prefer. 2003, 14(8), 673–680. DOI: 10.1016/S0950-3293(02)00209-4.
- Awoyale, W.; Asiedu, R.; Kawalawu, W. K. C.; Abass, A.; Maziya-Dixon, B.; Kromah, A.; Edet, M.; Mulbah, S. Assessment of the Suitability of Different Cassava Varieties for Gari and Fufu Flour Production in Liberia. Asian Food Sci. J. 2020, 14(2), 36–52. DOI: 10.9734/afsj/2020/v14i230128.
- Rosales-soto, M. U.; Ross, C. F.; Younce, F.; Fellman, J. K.; Mattinson, D. S.; Huber, K.; Powers, J. R. Physicochemical and Sensory Evaluation of Cooked, Fermented Protein-fortified Cassava (Manihot Esculenta Crantz) Flour. Adv. Food Technol. Nutr. Sci. Open J. 2016, 2(1), 9–18. DOI: 10.17140/AFTNSOJ-2-126.
- Egwim, E.; Amanabo, M.; Yahaya, A.; Bello, M. Nigerian Indigenous Fermented Foods: Processes and Prospects. Intech open science/open mind. 2013, pp. 13–180 http://doi.org/10.5772/52877
- Johnson, P. N. T.; Gallat, S.; Oduro-Yeboah, C.; Osei-Yaw, A.; Westby, A. Sensory Properties on Instant Fufu Flour from Four High-yielding Ghanaian Varieties of Cassava. Trop. Sci. 2006, 46, 134–138.
- Chijioke, U.; Madu, T.; Okoye, B.; Ogunka, A. P.; Ejechi, M.; Ofoeze, M.; Ogbete, C.; Njoku, D.; Ewuziem, J.; Kalu, C., et al. (2021). Quality Attributes of Fufu in South-East Nigeria: A Guide for Cassava Breeders. Int. J. Food Sci. Technol. 2021, 56(3), 1247–1257.
- Bentley, J.; Nitturkar, H.; Friedmann, M.; Thiele, G. Building a Sustainable, Integrated Seed System for Cassava in Nigeria (BASICS) Phase I Final Report. December 23, 2020, pp.78 Available online at: https://hdl.handle.net/10568/110984.
- Ashraf, S.; Anjum, F. M.; Nadeem, M.; Functional, R. A. Technological Aspects of Resistant Starch. Pak. J. Food Sci. 2012, 22(2), 90–95.
- Afoakwa, E. O.; Budu, A.; Asiedu, S.; Chiwona-Karltun, C.; Nyirenda, D. B. Viscoelastic Properties and Physic Functional Characterization of Six High-yielding Cassava Mosaic Disease-resistant Cassava (Manihot Esculenta Crantz) Genotypes. J. Nutr. Food Sci. 2012, 2, 129. DOI: 10.4172/2155-9600.1000129.
- Oyeyinka, S.; Oyeyinka, A.; Karim, O.; Kayode, R.; Balogun, M.; Balogun, O. Quality Attributes of Weevils (Callosobruchus Maculatus) Infested Cowpea (Vigna Unguiculata) Products. Niger. J. Agric. Food Environ. 2013, 9(3), 16–22.
- Asaam, E. S.; Adubofuor, J.; Amoah, I.; Apeku, O. D. Functional and Pasting Properties of Yellow Maize–soya Bean–pumpkin Composite Flours and Acceptability Study on Their Breakfast Cereals. Cogent Food Agric. 2018, 4(1), 1501932. DOI: 10.1080/23311932.2018.1501932.
- Donaldben, N. S.; Tanko, O. O.; Hussaina, T. O. Physicochemical Properties of Starches from Two Varieties of Sweet Potato and Yam Tubers Available in Nigeria. Asian Food Sci. J. 2020, 14(4), 28–38. DOI: 10.9734/afsj/2020/v14i430136.
- Onitilo, M. O.; Sanni, L. O.; Oyewole, O. B.; Maziya-Dixon, B. Physicochemical and Functional Properties of Sour Starches from Different Cassava Varieties. Int. J. Food Prop. 2007, 10(3), 607–620. DOI: 10.1080/10942910601048994.
- Mohana, K.; Asna, U.; Prasad, N. N. Effect of Storage on Resistant Starch and Amylose Content of Cereal-pulse Based Ready-to-eat Commercial Products. Food Chem. 2007, 102(4), 1425–1430. DOI: 10.1016/j.foodchem.2006.10.022.
- AOAC. Association of Official Analytical Chemists. Official Methods of Analysis of the Association of Official Analytical Chemists, 17th ed.; USA: Washington, DC, 2000.
- Essers, A. J. A.; Bosveld, M.; Van der Grift, R. M.; Voragen, A. G. J. Studies on the Quantification of Specific Cyanogens in Cassava Products and the Introduction of a New Chromogen. J. Sci. Food Agric. 1993, 63(3), 287–296. DOI: 10.1002/jsfa.2740630305.
- Tomlins, K.; Sanni, L. O.; Oyewole, O.; Dipeolu, A.; Ayinde, I.; Adebayo, K.; Westby, A. Consumer Acceptability and Sensory Evaluation of a Fermented Cassava Product (Nigerian Fufu). J. Sci. Food Agric. 2007, 87, 1949–1956.
- Awoyale, W.; Sanni, L. O.; Shittu, T. A.; Adegunwa, M. O. Effect of Varieties on the Functional and Pasting Properties of Biofortified Cassava Root Starches. J. Food Meas. Charact. 2015, 9(2), 225–232. DOI: 10.1007/s11694-015-9227-6.
- Sanni, L. O.; Adebowale, A. A.; Filani, T. A.; Oyewole, O. B.; Westby, A. (2006). Quality of Flash and Rotary Dried Fufu Flour. J. Food. Agric. Environ. 2006, 4(3&4), 74–78.
- Ikujenlola, A. V. Chemical and Functional Properties of Complementary Food from Malted and Unmalted Acha (Digitaria Exilis), Soybean (Glycine Max), and Defatted Sesame Seeds (Sesamum Indicum). J. Eng. Appl. Sci. 2008, 3(6), 471–475.
- Kulkarni, D. N.; Ingle, U. M. Sorghum Malt-based Weaning Food Formulations: Preparation, Functional Properties, and Nutritive Value. Food Nutr. Bull. 1991, 13, 322–327.
- Moorthy, S. Tuber Crop Starches. Technical Bulletin No. 18 CTCRI, Trivandrum. 2002.
- Singh, N.; Chawla, D.; Singh, J. Influence of Acetic Anhydride on Physiochemical, Morphological, and Thermal Properties of Corn and Potato Starch. Food Chem. 2004, 86(4), 601–608. DOI: 10.1016/j.foodchem.2003.10.008.
- Adebowale, A. A.; Sanni, L.; Awonorin, S.; Daniel, I.; Kuye, A. Effect of Cassava Varieties on the Sorption Isotherm of Tapioca Grits. Int. J. Food Sci. Technol. 2007, 42(4), 448–452. DOI: 10.1111/j.1365-2621.2007.01261.x.
- Ikegwu, O. J.; Nwobasi, V. N.; Odoli, M. O.; Oledinma, N. U. Evaluation of the Pasting and Some Functional Properties of Starch Isolated from Some Improved Cassava Varieties in Nigeria. Afr. J. Biotechnol. 2009, 8(10), 2310–2315.
- Bechoff, A.; Tomlins, K. I.; Chijioke, U.; Ilona, P.; Westby, A.; Boy, E. Physical Losses Could Partially Explain Modest Carotenoid Retention in Dried Food Products from Biofortified Cassava. PLoS One. 2018, 13(3), e0194402. DOI: 10.1371/journal.pone.0194402.
- Sanni, L.; Onitilo, M.; Oyewole, O. B.; Keiths, T.; Westby, A. Studies into the Production and Qualities of Cassava Grits (Tapioca) in Nigeria. The Sixth International Scientific Meeting of the Cassava Biotechnology Network, 8–14 March 2004, CIAT, Cali, Columbia.
- Newport Scientific. Applications Manual for the Rapid Visco TM Analyzer Using Thermocline for Windows; Newport Scientific Pty Ltd, Warrie wood, NSW: Australia, 1998; pp 2–26.
- Akingbala, J. O.; Oyewole, O. B.; Uzo-Peters, P. I.; Karim, R. O.; Bacuss-Taylor, G. S. H. Evaluating Stored Cassava Quality in Gari Production. J. Food. Agric. Environ. 2005, 3, 75–80.
- Baah, F. D.; Maziya-Dixon, B.; Asiedu, R.; Oduro, I.; Ellis, W. O. The Nutritional and Biochemical Composition of D. Alata (Dioscorea Spp.) Tubers. J. Food. Agric. Environ. 2009, 7(2), 373378.
- Codex Alimentarius Commissio. (Joint FAO/WHO Food Standard Programme. Codex Standard for Miscellaneous Products, 1st (Rome, Italy) ed; (supplement 1 to Codex Alimentarius, volume xii). 1985.
- Etudaiye, H. A.; Nwabueze, T. U.; Sanni, L. O. Pasting and Functional Properties of Processed from Cassava Mosaic Disease-resistant Varieties Cultivated in a High Rainfall Zone. Niger. Food J. 2009, 27(2), 185–193. DOI: 10.4314/nifoj.v27i2.47489.
- Sanni, L. O.; Maziya-Dixon, B.; Akanya, C. I.; Alaya, Y.; Egwuonwu, C. V.; Okechukwu, R. U.; Ezedinma, C.; Akoroda, M.; Lemchi, J.; Ogbe, F., et al. Standards for Cassava Products and Guidelines for Export; International Institute of Tropical Agriculture: Ibadan, Nigeria, 2005; pp 11–39.
- Amund, O. O.; Ogunsina, O. A. Extracellular Amylase Production by Cassava Fermenting Bacteria. J. Ind. Microbiol. 1987, 2(2), 123127. DOI: 10.1007/BF01569511.
- Uyo, E. A.; Udensi, O.; Natui, V.; Urua, I. Effect of Different Processing Methods on Cyanide Content of Gari from Four Cultivars of Cassava. J. Food. Agric. Environ. 2007, 5(3&4), 105–107.
- Adinsi, L.; Akissoé, N.; Escobar, A.; Prin, L.; Kougblenou, N.; Dufour, D.; Hounhouigan, D. J.; Fliedel, G. Sensory and Physicochemical Profiling of Traditional and Enriched Gari in Benin. Food Sci. Nutr. 2019, 7(10), 3338–3348. DOI: 10.1002/fsn3.1201.
- Ndjouenkeu, R.; Kegah, F. N.; Teeken, B.; Okoye, B.; Madu, T.; Olaosebikan, O. D.; Chijioke, U.; Bello, A.; Osunbade, O. A.; Owoade, D., et al. From Cassava to Gari: Mapping Quality Characteristics and End-user Preferences of Food Products in Cameroon and Nigeria. Int. J. Food Sci. Technol. 2021, 56(3), 1223–1238. DOI: 10.1111/ijfs.14790.
- Awoyale, W.; Alamu, E. O.; Chijioke, U.; Tran, T.; Takam-Tchuente, N. H.; Ndjouenkeu, R.; Kegah, N.; Maziya-Dixon, B. A Review of Cassava Semolina (Gari and Eba) End-user Preferences and Implications for Varietal Trait Evaluation. Int. J. Food Sci. Technol. 2021, 56(3), 1206–1222. DOI: 10.1111/ijfs.14867.