
 ?Mathematical formulae have been encoded as MathML and are displayed in this HTML version using MathJax in order to improve their display. Uncheck the box to turn MathJax off. This feature requires Javascript. Click on a formula to zoom.
ABSTRACT
To avoid fraudulent practices, LC-Orbitrap and FT-NIRS combined with multivariate analysis was used to distinguish between 53 Korean and foreign Boston butt samples; forty were used to establish the calibration model and 13 were used as an external validation set. Twenty metabolites were determined to be good indicators of geographic origin. Both LC-Orbitrap with CDA model based on 20 metabolites and FT-NIRS with PLS achieved 100% efficiency in identifying Korean and foreign samples; overall predictive rates for LC-Orbitrap (94.9%) and FT-NIRS (100%). Thus, combined use of LC-Orbitrap and FT-NIRS could be proposed to determine reliably discriminate geographic origins of pork samples.
Introduction
Pork is an excellent source of protein and polyunsaturated fatty acids (PUFA), which are essential in human diets.[Citation1] According to the 2019 meat consumption data,[Citation2] 31.2 kg of pork meat is consumed annually per person in Korea, making Korea rank first in the world in terms of pork consumption. Boston butt is a highly preferred pork cut among Koreans who mostly consume grilled or roasted pork rather than processed meat. However, the Boston butt is not a high yield cut, resulting in an imbalance between the supply and demand in South Korea and consequent import from the US, Spain, Canada, Chile, Denmark, Mexico, Netherlands, and Germany.[Citation3]
Ninety percent of the imported Boston butt is frozen,[Citation3] and its sale price is two to three-fold lower than that of domestic chilled Boston butt. However, Korean consumers prefer local Boston butt to the imported frozen meat owing to its freshness. Unfortunately, the difference in sale prices has resulted in fraudulent practices, wherein cheaper imported frozen Boston butt is thawed and sold as the more expensive Korean chilled Boston butt.
Scientific technologies are being developed to protect consumer rights and the earnings of agricultural producers, as well as to prevent fraudulent practices. To identify the geographic origin of pork meat, methods have been developed to determine mineral element signatures[Citation4–6] and use a combination of multi-elements and stable isotopes.[Citation7,Citation8] There have been only a few studies until now on the use of organic compound signatures to discriminate the geographic origins of pork. Pork is a good source of nutrients, such as protein, fat, fatty acids, and vitamins (thiamine, riboflavin, niacin, pantothenic acid, and pyridoxine).[Citation9] Differences in these pork components depend on the location where the pig species was raised,[Citation10,Citation11] the production system,[Citation8,Citation12–14] and feed provided.[Citation15–19]
Owing to the great chemical diversity and range of concentrations of the various components in pork, non-target liquid chromatography coupled with high-resolution mass spectrometry (LC-HRMS) and Fourier transformation near-infrared spectroscopy (FT-NIRS) are excellent analytical tools to determine the geographic origin of pork. Both techniques have advantages and disadvantages. Although the non-target LC-HRMS approach is expensive, time-consuming, and requires more technical expertise, it has been used to investigate potential biomarkers for discriminating the geographic origin of goji berry,[Citation20] hazelnut,[Citation21] and virgin olive oil[Citation22] through comprehensive metabolite profiling. Select markers contributing to discrimination not only help identify the geographical origin of pork but also explain the relationship between the nutritional value of pork and varying environmental conditions for growth, including breeding, feeding, and housing conditions.
FT-NIRS can provide information regarding the chemical structure by measuring the absorptions corresponding to the overtone and combination vibrations involving C-H, O-H, N-H, and S-H bonds in the sample in the NIR region (4,000–10,000 cm−1). FT-NIRS is useful for simultaneous analysis of organic constituents, such as the fat (C-H), moisture (O-H), and protein (N-H, S-H) contents in food from a single spectrum. FT-NIRS is a rapid, accurate, easy, and nondestructive analytical tool and has been employed to identify the geographical origin of lamb meat[Citation23] and beef.[Citation24] However FT-NIRS is not appropriate when detailed information about pork-related components is required to determine their geographic origin.
LC- Orbitrap and FT-NIRS are both important due to their individual traits. Moreover, to enhance the reliability of discrimination results based on geographical origin, it is necessary to make a comprehensive judgment using the results obtained with the two different types of equipment rather than one single equipment type alone.
To the best of our knowledge, there are no published reports that determine the geographical origin of pork using LC-HRMS and FT-NIRS, respectively. In the pork meat industry, NIRS has been successfully used to quantify quality traits, including the contents of protein, fat, moisture, and other components.[Citation25] However, it has not been used for discriminating the geographic origin of pork,[Citation26] employed LC-HRMS to differentiate five pork cuts (shoulder, rump, loin, shank, and belly) and three pork varieties (Tibetan, Jilin, and Sanmenxia) based on the lipid composition of domestic pork in China. Another study reported the detection of 14 chemical markers, including carnosine, L-carnitine, and L-acetylcarnitine, to distinguish live from dead pork meat using LC-HRMS.[Citation27] These studies, however, did not discriminate the geographic origins of pork; organic compound profiling methods can be applied to identify pork origin.
Accordingly, the aim of this study was to screen and identify potential markers for discriminating Boston butt cuts having Korean and non-Korean origins using high-performance liquid chromatography (HPLC) Orbitrap high-resolution mass spectrometry coupled with multivariate classification. In addition, FT-NIRS with chemometrics – as a fast and convenient method – was performed to distinguish pork from different geographic origins. To verify the reliability of the classification results by FT-NIRS and to increase the consistency of judgment, a comparison of the classification results based on potential biomarker from LC-Orbitrap was attempted.
Materials and methods
Sample procurement
Twenty-four samples of chilled Boston butt originating in Korea were collected from butcher shops from eight different Korean provinces (representative production areas; three samples per province): Gyeonggi-do, Gangwon-do, Chungcheongbuk-do, Chungcheongnam-do, Jeollabuk-do, Jeollanam-do, Gyeongsangbuk-do, and Gyeongsangnam-do. Twenty-nine imported Boston butt samples, frozen at −18°C, were obtained from a retail market in Seoul, South Korea. The foreign samples were imported from the following countries: Austria (3), Belgium (3), Canada (2), Chile (3), Denmark (3), Germany (3), Ireland (3), Mexico (3), Spain (3), and the United States of America (3). The provinces and cities of Korean and foreign samples are listed in Table S1. There was no information about the locations and rearing practices for foreign samples.
Sample treatment
Boston butt samples (2000–2500 g each) were taken, and visible fat was removed using a ceramic knife; subsequently, 300 g of lean meat was acquired. The lean meat samples were spread thinly in a polyethylene bag and frozen at −40°C for 8 h. The samples were lyophilized for 24 h and ground using a grinding mill (A11 model, IKA, Königswinter, Germany) to obtain homogeneous powders (particle size < 20 mesh). The moisture contents of the powders were below a 5.0% average, and the powders were stored at −40°C before further analysis.
Reagents and solvents
Ultrapure water (18.2 Ω) was obtained using a Milli-Q water purification system (Milli-Q Advantage A 10, Millipore, Bedford, MA, USA). Formic acid and acetonitrile of LC-MS grade quality were procured from Merck (Darmstadt, Hesse, Germany). Caffeic acid was purchased from Sigma-Aldrich (St. Louis, MO, USA).
QuEChERS extraction
Pork samples (2 g) were placed in 50-milliliter polytetrafluoroethylene (PTFE) tubes, and 10 mL of ultrapure water (18.2 Ω) was added. Two ceramic homogenizers (Agilent Technologies, Wilmington, DE, USA) were added, and the tube was manually shaken for 1 min. Thereafter, 10 mL of acetonitrile was added as the extraction solvent, and the mixture was vortexed for 1 min at 3000 rpm (Shake master BMS A-20 TP, Tokyo, Japan). QuEChERS salts (4 g of magnesium sulfate, 1 g of sodium chloride, 1 g of sodium citrate tribasic dihydrate, and 0.5 g of sodium citrate dibasic sesquihydrate) were subsequently added. The mixture was shaken for 1 min at 3000 rpm (Shake master BMS A-20 TP, Tokyo, Japan) and centrifuged (5 min, 20 400 × g, 4°C) in a centrifuge (Mx 307, TOMY, Tokyo, Japan). Next, 500 µL of the supernatant was transferred to a 2-milliliter tube, and 300 µL of water, 150 µL of acetonitrile, and 50 µL of a 20 µg/mL caffeic acid solution in methanol, used as internal standard, were added. The mixture was vortexed for 20s and centrifuged at 20 400 × g for 5 min at 4°C. The solution was then filtered using a 0.22 PTFE syringe filter (Phenomenex, Torrance, CA, USA), and 2 µL of the filtered solution was injected into the LC-Orbitrap.
The QuEChERS method is based on extraction with acetonitrile and partitioning with salt addition.[Citation28] Unlike methods[Citation26,Citation27] that first require extraction of the polar and nonpolar substances in pork meat, the QuEChERS method does not need initial preparation. The QuEChERS method employs cold water or ice for layer separation and vacuum evaporation followed by reconstitution for the mobile phase.
HPLC conditions
Untargeted metabolites were analyzed using a HPLC system (Shiseido nanospace SI-2, Osaka Soda, Osaka, Japan) coupled with a high-resolution mass spectrometer (Q Exactive™ Plus, Thermo Fisher Scientific, Waltham, MA, USA). Instrument control, data acquisition, and data analysis were performed using Xcalibur 3.0 (Thermo Fisher Scientific) and Q Exactive Tune software. A Cadenza, CD-C18 column (150 mm × 2.0 mm, 3 μm, Imtakt, Philadelphia, PA, USA) was used for chromatographic separation at 40°C. The mobile phase consisted of (A) water + 0.1% formic acid and (B) acetonitrile + 0.1% formic acid, and a flow rate of 0.3 m/min was used. The total run time was 20 min, and the following gradient program was used: 0–2 min, 5% B; 2–12 min, linearly increased to 95% B and 12–14 min, 95% B; then 14–20 min, 5% B for equilibration. The injection volume was 2 μL.
Orbitrap MS conditions
To acquire MS data, the full-scan/data-dependent MS/MS (dd-MS2) was operated in positive mode using electrospray ionization (ESI). The following HESI-II source parameters were used: spray voltage of 3.5 kV; sheath, auxiliary, and sweep gas flow rates of 35 arb, 10 arb, and 0 arb, respectively; a capillary temperature of 300°C; S-lens radio frequency level of 50°C; and heater temperature of 320°C. The full-scan spectra were collected with an m/z range of 100–1500 Da at a 70,000 resolution, automatic gain control (AGC) of 1e6, and maximum injection time of 100 ms. The dd-MS2 spectra were collected with an m/z range of 100–1500 Da at a 17,500 resolution, AGC of 1e6, maximum injection time of 100 ms, window of 0.5 m/z, loop count of top three peaks, dynamic exclusion of 6.0 s, and normalized collision energies of 10, 30, and 60.
Data processing and identification
Raw data from full MS scan and dd-MS2 scan were processed using the Compound Discoverer 2.1 software (Thermo Fisher Scientific) for spectrum properties filter and peak alignment, and feature extraction was set as default value. Next, the exact mass coupled with MS/MS spectrum was matched with online mass databases, such as ChemSpider (www.chemspider.com) and mzCloud (www.mzcloud.org), for identification. An internal standard was used to evaluate for instrumental bias among the run samples. A blank sample was processed and used to eliminate the background signal in the samples.
Multivariate data analysis
The identified data filtered by set conditions (as described in Section 3.1), and fold-change (FC) analysis, t-test, and volcano plot construction were carried out using Compound Discoverer 2.1. The selected mass features were exported to the data matrix compound name, retention time, and non-normalized areas for further analysis. Autoscaling (centered mean divided by the standard deviation of each variable) was applied to normalize data before multivariate data analysis. Next, we carried out orthogonal partial least squares-discriminant analysis (OPLS-DA) using Simca 17.0 (Umetrics, Umea, Sweden). After the OPLS-DA analysis, the most significant variables for geographical discrimination were selected by Variable Importance in the Projection (VIP), S-plot, and Canonical discriminant analysis (CDA) of UNISTAT (version 6.5., Unistat Ltd., London, UK). To rebuild the classification model from the selected variables, CDA of UNISTAT was performed. The normalized (autoscaled) areas of organic components were used as independent variables. The response variable was set to Korean samples and foreign samples in the calibration set. In the validation set, unknown Boston butt was set to “ *.”
For evaluating the performance of the model, its sensitivity, selectivity, and efficiency were calculated based on the values for True Korean (TK; samples correctly classified as Korean), False Korean (FK; samples that were not correctly classified as foreign), True Foreign (TF; samples correctly classified as foreign), and False Foreign (FF, samples not correctly classified as Korean).
The Korean and foreign sample prediction rates of the constructed model are presented as the percentages of correct classification of Korean and foreign samples, respectively. Pearson’s correlation analysis was performed using SPSS 16.0 (SPSS Inc., Chicago, IL, USA).
NIRS analysis
Briefly, 15 g of freeze-dried pork powder was placed in the sample cup. The spectrum of each sample was collected three times in the reflectance mode using an FT-NIRS spectrometer (Bruker Optik GmbH, Ettlingen, Germany). The range of spectra was 11,500–3,950 cm−1 at 16 cm−1 resolutions and 32 scans with an integrating sphere. All data analyses, including spectra preprocessing, classification model construction, test validation, and PLS algorithm-based analysis, were carried out using the Bruker OPUS 7.0 software on Windows 7 (Microsoft, Redmond, WA, USA).
The following pre-treatment methods were applied for classification model developments: standard normal variate, multiplicative scatter correction, first derivative, and second derivative. The precision of the classification model with FT-NIRS was evaluated using the coefficient of determination (R2), root mean square error of estimation (RMSEE), root mean square error of prediction (RMSEP), and residual prediction deviation (RPD). R2 gives the percentage of variance present in the component values, which is reproduced in the prediction. RMSEE value calculates the analysis error of the classification model. The RMSEP value is a quantitative measure for the preciseness of the analysis of test samples. The RPD value is a qualitative measure for the assessment of the validation results. It is the quotient of the standard deviation of the reference values and the bias-corrected mean error of prediction of the validation. To avoid an over-optimistic interpretation of the result, the RPD is calculated. The OPUS program automatically selects the optimum classification model with the lowest possible rank (latent variable), RMSEE, RMSEP, and the highest R2 and RPD.
Results and discussion
Boston butt sample peaks obtained using LC-Orbitrap
In total, 2,872 peaks were detected in pork samples using LC-Orbitrap MS. To obtain sufficient peak features and reliable statistical results, the following filtering conditions were employed using Discoverer 2.1: (1) annotation source determined by mzCloud and ChemSpider has a status of full match in source predicted compounds; (2) compounds had features with the MS/MS fragments information greater than 1; and (3) volcano plot analysis using Student’s t-test was conducted. In total, 1,004 metabolites were obtained that showed an adjusted p-value of <0.05 and a FC of 1.2. shows the volcano plot of the -log 10 adjusted p-values versus log2 fold changes (foreign/Korean samples).
Figure 1. Volcano plot analysis for identifying metabolites differentially detected in domestic and foreign Boston butt. Green and red squares indicate characteristic metabolites in Korean and foreign Boston butt samples, respectively (adjusted p-value < 0.05, fold change > 1.2).
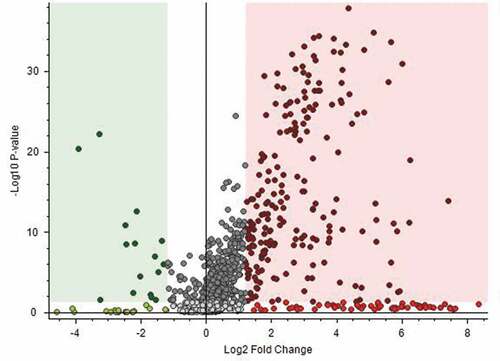
Among the metabolites, 138 duplicate metabolites were removed using the following conditions: high CV% for peak areas of each group, high number of fill gaps, and low identification matching percentage. The result of this analysis revealed 47 putative metabolites in the foreign group and five putative metabolites in the Korean group that can potentially discriminate between foreign and Korean domestic Boston butt samples.
Metabolite selection via OPLS-DA and CDA
OPLS-DA has been used to discriminate the geographical origins of the samples using the LC-HRMS data for soybeans,[Citation29] guarana seeds,[Citation30] durum wheat,[Citation31] and orange.[Citation32] Figure S1 shows the OPLS-DA results based on the total 52 metabolites described in Section 3.1 for 24 Korean samples (72 observations) and 29 foreign samples (87 observations). Except for one Korean sample, the OPLS-DA models discriminated between the Korean (blue circles) and foreign (red circles) samples. VIP scores of the OPLS-DA models were generated to identify which of the 52 metabolites described in Section 3.1 majorly influence discrimination between Korean and foreign pork samples. The metabolites with a VIP value greater than 1 have an above-average contribution to the OPLS-DA classification. Twenty significantly differential metabolites were selected based on a VIP value > 1 and a P-value < 0.05. Of these, seven were excluded due to unknown chemical classes: [(1 R,3S)-1-amino-3-[(6 R)-6-hexyl-5,6,7,8-tetrahydro-2-naphthalenyl]cyclopentyl]methanol (1.23), methyl adamantan-1-yl[(3-cyclohexylpropanoyl)amino]acetate (1.22), 2-ethoxy-3-(stearoylamino)propyl dihydrogen phosphate (1.17), 2-hydroxy-3-(palmitoyloxy)propyl 2-(trimethylammonio)ethyl phosphate (1.13), 3-dodecyl-4-hydroxy-4-methyl-1-oxa-3-azaspiro[4.5]decan-2-one (1.09), 1-[2-(adamantan-1-yl)ethoxy]-3-(2,6-dimethyl-4-morpholinyl)-2-propanol (1.09), and 1,11-diamino-3,6,9-trioxaundecane (1.02). In addition, to improve the discrimination between the origins of the two Boston butt, seven additional variables were selected via CDA. The variables were inserted and deleted to obtain the best variables capable of distinguishing between Korean and foreign groups based on standardized coefficients. The large standardized coefficients indicated variables with greater discriminating ability.
Finally, 20 metabolites (13 from OPLS-DA and 7 from CDA) were selected (). The classification of the Boston butt samples using the selected 20 metabolites was also good (). Thus, sufficient discriminative information was contained in the 20 selected metabolites, which showed similar discriminant ability as that achieved with the previously mentioned 52 metabolites (Figure S1).
Table 1. Identification of twenty markers for the separation of Boston butt
Figure 2. OPLS-DA model results using LC-Orbitrap data from Korean and foreign Boston butt. (a) Results of the re-classification of Korean and foreign Boston butt samples based on 20 metabolites. Score plot (R2X (cum) = 0.902, R2 Y (cum) = 0.791, and Q2 (cum) = 0.773). Three Belgium observations are shown as dotted square boxes. (b) OPLS-DA model permutation test. R2 = (0.042), Q2 = (0.0, −0.201) of Korean and foreign Boston butt samples. (c) S-plot for selecting 20 markers.
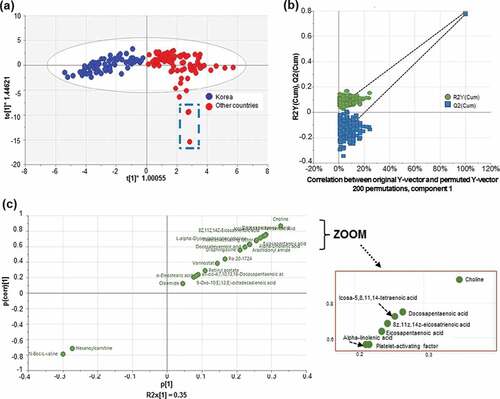
The foreign samples from ten different nations were more widely scattered than Korean samples, reflecting the geographical diversity of samples spread over a wider area. The values of R2X, R2Y, and Q2 were 0.902, 0.791, and 0.773, respectively, which indicated a good fit and high predictive ability, with a low likelihood of overfitting (). When the R2Y and Q2 values were close to 1, the OPLS-DA model was more stable and reproducible. When the R2Y, Q2 values were >0.5, the OPLS-DA model had acceptable prediction abilities.[Citation33,Citation34]
To verify the statistical significance of the constructed model, the permutation test (n = 200) method was used with 7-fold cross-validation as an internal prediction. In the permutation test, the regression intercept values for R2 and Q2 regression lines represent the degree of fit to the data and the predictive ability of the model, respectively. The intercept value (R2) should not be more than 0.3, and the Q2 value should not exceed 0.05 for the model, which demonstrated no overfitting and showed the high predictive value of the model.[Citation35] In the permutation test, the values of R2 and Q2 were 0.042 and −0.201, respectively, indicating good repeatability and predictability of the model ().
Discrimination of the geographical origins of Boston butt samples by CDA
The OPLS models classified the different Korean and foreign groups. But external validation with independent sample set which were excluded from the classification model was necessary. Because OPLS-DA often yielded the most overoptimistic result possible for the predictive ability (Q2) statistic.[Citation36] To evaluate accurately evaluate the predictive ability, another supervised method, CDA was adopted.
The goal of CDA is to achieve better discrimination between sample origins by optimizing between-group variation and minimizing within-group variation.[Citation37] CDA has been applied previously as a classification model to discriminate pork geographical origins based on mineral elements using inductively coupled plasma spectrometry.[Citation5] This method has also been used to verify the authenticity of honey using 1H nuclear magnetic resonance spectroscopy with great success.[Citation34]
To perform the external validation, 159 observations (53 Boston butt samples and their analytical replicates) were randomly assigned to a calibration set (CS) comprising 3/4 of the observations (Korean, 54; foreign, 66) and an external validation set comprising the remaining 1/4 observations (Korean, 18; foreign, 21). The CS was used to construct a classification model using the normalized areas of the 20 selected metabolites as explanatory variables, and the validation set was employed to validate the established model. This process was repeated three times to compare the predictive powers of the three models CS1–3. The CDA results showed that the overall sensitivity, selectivity, and efficiency were 100% with CS1, CS2, and CS3. The statistical parameters of the CDA model are shown in .
Table 2. Classification results for the geographical origin of Boston butte by canonical discriminant analysis with twenty metabolites
The canonical discriminant function is defined as the linear combination of variables by which two groups can be most well classified. The values of CS1, CS2, and CS3 were −2.3775, −2.6023, and −2.2165 and 1.9452, 2.1291, and 1.7346, respectively, for Korean and foreign samples. The canonical correlation is interpreted as an index of the overall fit of the model, as it shows the proportion of variance between the groups and the total variance. The values of canonical correlation for CS1, CS2, and CS3 were 0.9081, 0.9216, and 0.8923, respectively. A value near 1 indicates that the separation between the groups is good. The distances between centroids of the two groups for CS1, CS2, and CS3 were 4.3227, 4.7314, and 3.9511, respectively. A distance between centroids >2 indicates a significant separation. In the current study, 60 out of 63 foreign observations with all three CDA models were correctly classified as foreign, and the average predictive rate was 95.2%. Furthermore, 51 out of 54 Korean observations for CS1, CS2, and CS3 were correctly assigned to the Korean group, and the average predictive rate was 94.4% (). The overall prediction rate was 94.9%, which was obtained from 111 out of 117 Korean and foreign observations. Thus, the CDA model may have good identification and predictive power.
Metabolites specific to Korean domestic and foreign samples
Nine metabolites, namely icosa-5,8,11,14-tetraenoic acid (AA), docosapentaenoic acid (DPA), 8z,11z,14z-eicosatrienoic acid, eicosapentaenoic acid (EPA), alpha-linolenic acid (LNA), docosahexaenoic acid (DHA), α-eleostearic acid, all-cis-4,7,10,13,16-DPA (osbond acid), and 9-oxo-10(E),12(E)-octadecadienoic acid (9-OxoODE), belonged to unsaturated fatty acids and accounted for 45% of the 20 metabolites finally selected. As shown in the S-plot (), DPA, AA, 8z,11z,14z-eicosatrienoic acid, and EPA were located on the outer side and could be considered as key markers of the foreign group. Interestingly, although EPA showed the highest FC among the 20 metabolites (), its VIP score ranked seventh (Table S2). As a result of Pearson’s correlation analysis, significant positive correlations were observed among most of the unsaturated fatty acids ().[Citation38,Citation39] have reported that the fatty acid composition of pork closely reflects the diet. Pigs fed soybean oil have a higher PUFA content than pigs fed animal fat and palm oil.[Citation40] The level of LNA and DHA is increased more by soybean oil supplementation than by beef tallow and the switch from tallow to soybean oil in three crossbred (Landrace×Yorkshire×Duroc) pig diets.[Citation41] Diets enriched in plant oils (such as sunflower, linseed, and rapeseed) result in increased PUFA levels in pork.[Citation42,Citation43]
Figure 3. Correlation matrix of 20 metabolites from Korean and foreign Boston butt samples. Each square indicates Pearson’s correlation coefficient of a pair of compounds. Positive correlations are represented by shaded red and negative correlations by shaded blue. The value of the correlation coefficient is indicated by the strength of the color saturation.
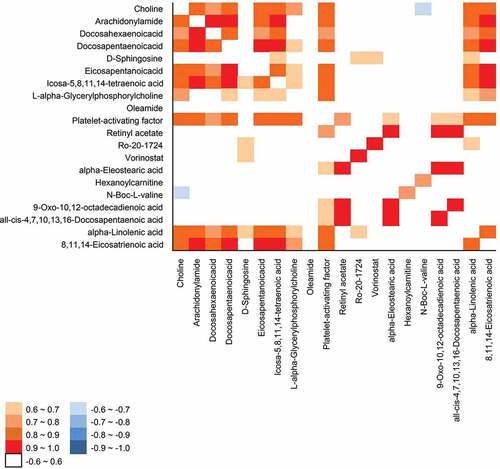
Among the selected 20 metabolites, choline showed the highest VIP value of 1.47 (Table S2) and was the most remote metabolite visualized in the S-plot of OPLS-DA (). Thus, it has the greatest influence on the identification of the geographic origin of pork. Choline is an essential nutrient that functions to maintain cell structure, transport lipid in and out of cells, and serve as a precursor for the synthesis of acetylcholine and phospholipids.[Citation44] Choline content was positively correlated with AA (r = 0.893, P < .0001), 8z,11z,14z-eicosatrienoic acid (r = 0.888, P < .0001), DPA (r = 0.880, P < .0001), platelet-activating factor (PAF; r = 0.873, P < .0001), and EPA (r = 0.844, P < .0001; ).
PAF is a potent phospholipid that mediates the response to vascular and innate immunity-linked processes.[Citation45] The VIP value of PAF was 1.3 (Table S2), and foreign samples were more significantly enriched with this metabolite (FC = 5.5, p < .05) than the domestic samples (). The PAF content was positively correlated with choline (r = 0.873, P < .0001) and L-alpha-glycerylphosphorylcholine (r = 0.823, P < .0001; ). PAF needs choline at the sn-3 position to be able to activate the PAF receptor, and this can arise from the oxidation of unsaturated phosphatidylcholine.[Citation46] Moreover, the PAF content was positively correlated with arachidonoyl amide (r = 0.848, P < .0001), AA (r = 0.875, P < .0001), DPA (r = 0.85, P < .0001), 8z,11z,14z-eicosatrienoic acid (r = 0.868, P < .0001), EPA (r = 0.816, P < .0001), LNA (r = 0.869, P < .0001), and DHA (r = 0.716, P < .0001; ).
Hexanoylcarnitine (VIP = 1.24, FC = 0.2, p < .05) and N-Boc-L-valine (VIP = 1.35, FC = 0.1, p < .05) were present in the lower left-hand quadrant of the S-plot (); both mainly contributed to the identification of Korean Boston butt. Hexanoylcarnitine is a medium-chain acylcarnitine[Citation47] and an intermediate metabolite of fatty acid β-oxidation.[Citation48] In contrast, the content of palmitoyl carnitine, which is a long-chain acylcarnitine,[Citation49] was 4-fold higher in foreign samples than that in Korean Boston butt samples. However, palmitoyl carnitine had a VIP value of 0.48, suggesting that it had little influence on discriminating between Korean and foreign origins of Boston butt [data not shown).
Reported that short- and medium-chain acylcarnitine are metabolized very differently from long-chain acylcarnitine in cardiovascular diseases.[Citation47] The different types of acylcarnitine found in Korean and foreign groups may affect different fatty acid oxidation pathways. Korean Boston butt had significantly higher levels of hexanoylcarnitine than foreign Boston butt. N-Boc-L-valine was linked to hexanoylcarnitine (r = 0.744, P < .0001; ), but very little is known about N-Boc-L-valine, and it should be investigated in the future.
The pork distributed in the Korean market is dominated by pigs obtained by a three-way crossbreeding between Landrace, Yorkshire dam, and Duroc sire that combines their merits.[Citation10] These three-way crossbred pigs are used for commercial pork production not only in Korea but also in other parts of the world. Industrial livestock farming cannot be easily changed. Unsaturated fatty acid concentrations in meat have been reported to be more related to feeding than to genotype.[Citation50] Accordingly, differences in metabolic components of pork may be mainly influenced by pig diets,[Citation51–54] including different feed ingredients and feed additives in different regions.
NIRS
To compare the discriminatory performance of the analysis methods (LC-Orbitrap MS and FT-NIRS), the same calibration set and validation set used for CDA were used for FT-NIRS. The three classification models, CS1–3, were developed using the calibration set (Korean, 54; foreign, 66) and validated using the remaining observations (Korean, 18; foreign, 21) as an independent test set, respectively. The wavelengths selected for the classification model were 9405.3–7499.1 cm−1 and 5027.3–4594.4 cm−1, in accordance with the automatic optimization function in the OPUS 7.0 software (). The 5027.3–4594.4 cm−1 absorption region was associated with a combination of secondary amides (-CONH-), primary amides (-CONH2), and primary amines (NH2); these wavelengths may reflect the protein contents in pork. Absorption at 9405.3–7499.1 cm−1 was related to the second overtone of methyl (–CH3), methylene (-CH2), C = C alkenes, and – CH, which were mainly related to the lipid content in pork.
Figure 4. Raw FT-NIR spectrum of overall Boston butt samples (a) and after the second derivative pre-treatment (b).
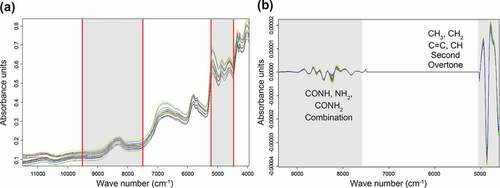
To eliminate the effect of baseline drifts, noises, and light scattering and achieve a reliable and accurate model, a second derivative was used for optimum spectral preprocessing (). The loading value of the pork was set to 100 for Korean domestic samples and 1 for foreign samples.
Via the calibration equation with PLS, a predicted value of 50 was considered as the threshold for the classification of Korean or foreign samples. A Boston butt sample with a PLS predicted value below 50 was assigned to the foreign group, while a value equal to or greater than 50 was assigned to the Korean group (). When developed NIRS models (a–c) were applied to a validation set (CS1-3) that had not been included in the calibration set, a prediction rate of 100% was obtained () based on a cutoff value of 50.
Figure 5. The FT-NIRS calibration model combined with the PLS algorithm for Korean and foreign Boston butt: (a) CS1, (b) CS2, and (c) CS3. Test validation results for Boston butt calibration: (d) CS1, (e) CS2, and (f) CS3.
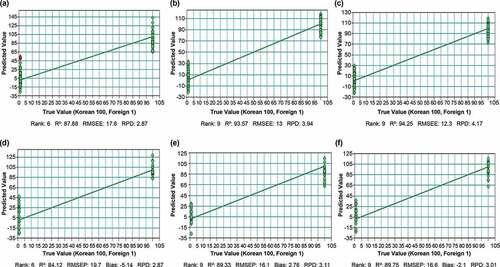
The model generated using a combination of FT-NIRS and PLS showed good discriminatory performance for both the calibration and validation sets; experiments were repeated three times. The classification model with CS1, CS2, and CS3 showed R2 values of 87.88%–94.25%, RMSEE values of 13–19.7, and RPD values of 2.6–3.93 (). The CS1, CS2, and CS3 of the FT-NIR model of the test validation were well-separated according to R2, RMSEP, and RPD ranges of 84.12–90.36%, 15.3–19.7%, and 2.6–3.24%, respectively (),[Citation55] have reported that a value for R2 between 0.81 and 0.9 is good. R2 greater than 0.9 reveals a strong linear correlation. For RPD values between 2.5 and 3, predictions can be classified as good, and RPD > 3 indicates a high predictive performance.
Comparison between FT-NIRS and LC-Orbitrap
Comparisons between the results of the classification model from FT-NIRS and LC-Orbitrap were applied to minimize the discriminant error and to increase confidence in the judgment.
For the FT-NIRS, of CS1, three observations (one sample), marked in red, from Belgium were assigned correctly to the foreign group, and the Mahalanobis distance was within the corresponding limit, 0.35. However, these observations were recognized as outliers due to the large F-probe. The F-probe values of the three observations were all 0.99. The F-probe value indicates the probability of the existence of an outlier in the distribution of F-values. F-values are calculated based on the difference in the true values and predicted values by the classification model.
The OPLS-DA model based on 20 metabolites by LC-Orbitrap had similar findings, wherein the three red marked observations from FT-NIRS fell outside the confidence ellipse (95% confidence interval) that accurately belonged to the foreign classification ( dotted square box). Further, the results of CDA showed that the classification efficiency of CS1 was 100% (),[Citation56] reported that samples are placed outside the confidence ellipse when samples indicate specific differences in compositional patterns compared with other samples rather than outliers. As similar results were obtained from two different pieces of equipment, LC-Orbitrap and FT-NIRS, we suggested that the three red marked observations had distinct metabolites instead of outliers.
Both CDA by processing the LC-Orbitrap MS data and PLS by FT-NIRS showed a perfect efficiency of 100%. For the external validation results, the overall predictive rates of 100.0% and 94.9% were found for FT-NIRS and LC-Orbitrap, respectively. Herein, organic component analysis of pork samples was carried out using LC-Orbitrap MS and FT-NIRS to characterize their geographic origins. In total, 20 metabolites were selected to discriminate between Korean and foreign pork samples via LC-Orbitrap MS coupled with volcano plot, OPLS-DA, and CDA. The concentrations of unsaturated fatty acids, choline, and PAF were found to be higher in foreign pork samples – obtained from ten nations – than those in Korean pork samples, whereas the concentrations of hexanoylcarnitine and N-Boc-L-valine were higher in Korean domestic pork samples than those in foreign pork samples. Because FT-NIRS with chemometrics is a fast and less laborious method than LC-Orbitrap MS, it might be suitable for distinguishing the geographic origins of a large number of pork samples. In contrast, LC-Orbitrap, compared with FT-NIRS, given the high cost and technical expertise requirement, provided a better understanding of the nutritional values that contribute to the identification of the geographical origin of Korean and non-Korean Boston butt samples. During routine analysis, FT-NIRS and LC-Orbitrap yielded consistent results, indicating consistency in the value judgments. We conclude that LC-Orbitrap MS and FT-NIRS can act as complementary strategies to determine the geographical origins of Boston butt. Future studies should be conducted to create a pork butt database for curating information related to samples of various geographic origins, evaluate the consistency of the findings of this research, update the classification model for maintaining the accuracy rate, and establish FT-NIRS and LC-Orbitrap for routine analysis to discriminate the geographic origins of pork butt.
Supplemental Material
Download ()Acknowledgments
This study was supported by the National Agricultural Products Quality Management Service of Korea. Author contributions: Lee Ji Hye: Conceptualization, Methodology, Writing- Original draft preparation, An Jae Min: Software, Visualization, Investigation, Kang Dong Jin: Validation, Data curation, Lee Seong Hun: Supervision, Writing- Reviewing and Editing, Kim Ho Jin: Writing- Investigation, Reviewing and Editing
Disclosure statement
No potential conflict of interest was reported by the author(s).
Supplementary material
Supplemental data for this article can be accessed on the publisher’s website.
Additional information
Funding
Related Research Data
References
- Iko Afé, O. H.; Anihouvi, D. G.; Assogba, M. F.; Anihouvi, E. L.; Kpoclou, Y. E.; Douny, C.; Mahillon, J.; Anihouvi, V. B.; Scippo, M.-L.; Hounhouigan, D. J. Consumption and Nutritional Quality of Grilled Pork Purchased from Open Road-side Restaurants of Benin. J. Food Compost. Anal. 2020, 92, 103549. DOI: 10.1016/j.jfca.2020.103549.
- OECD. Meat Consumption (Indicator). Pork meat, Kilograms/capita, 2019. 2021. https://data.oecd.org/agroutput/meat-consumption.htm (accessed Jan 12, 2021).
- MFDS. Ministry of Food and Drug Safet. The Report on Inspection Performance of Imported Livestock Products No. 219. 2020. https://mfds.go.kr/brd/m_567/list.do (accessed Jan 12, 2020).
- Kim, J. S.; Hwang, I. M.; Lee, G. H.; Park, Y. M.; Choi, J. Y.; Jamila, N.; Khan, N.; Kim, K. S. Geographical Origin Authentication of Pork Using Multi-element and Multivariate Data Analyses. Meat Sci. 2017, 123, 13–20. DOI: 10.1016/j.meatsci.2016.08.011.
- Qi, J.; Li, Y.; Zhang, C.; Wang, C.; Wang, J.; Guo, W.; Wang, S. Geographic Origin Discrimination of Pork from Different Chinese Regions Using Mineral Elements Analysis Assisted by Machine Learning Techniques. Food Chem. 2021, 337, 127779. DOI: 10.1016/j.foodchem.2020.127779.
- Shin, W. J.; Choi, S. H.; Ryu, J. S.; Song, B. Y.; Song, J. H.; Park, S. H.; Min, J. S. Discrimination of the Geographic Origin of Pork Using Multi-isotopes and Statistical Analysis. Rapid Commun. Mass Spectrom. 2018, 32, 1843–1850. DOI: 10.1002/rcm.8251.
- Park, Y. M.; Lee, C. M.; Hong, J. H.; Jamila, N.; Khan, N.; Jung, J. H.; Jung, Y. C.; Kim, K. S. Origin Discrimination of Defatted Pork via Trace Elements Profiling, Stable Isotope Ratios Analysis, and Multivariate Statistical Techniques. Meat Sci. 2018, 143, 93–103. DOI: 10.1016/j.meatsci.2018.04.012.
- Zhao, Y.; Tu, T.; Tang, X.; Zhao, S.; Qie, M.; Chen, A.; Yang, S. Authentication of Organic Pork and Identification of Geographical Origins of Pork in Four Regions of China by Combined Analysis of Stable Isotopes and Multi-elements. Meat Sci. 2020, 165, 108129. DOI: 10.1016/j.meatsci.2020.108129.
- Patterson, K. Y.; Trainer, D.; Holden, J. M.; Howe, J. C. USDA Nutrient Data Set for Fresh Pork (From SR), Release 2.01. 2009. https://www.ars.usda.gov/ARSUserFiles/80400525/Data/Pork/Pork09.pdf (accessed May 1, 2021)
- Choi, Y. S.; Lee, J. K.; Jung, J. T.; Jung, Y. C.; Jung, J. H.; Jung, M. O.; Choi, Y. I.; Jin, S. K.; Choi, J. S. Comparison of Meat Quality and Fatty Acid Composition of Longissimus Muscles from Purebred Pigs and Three-way Crossbred LYD Pigs. Korean J. Food Sci. Animal Resour. 2016, 36, 689–696. DOI: 10.5851/kosfa.2016.36.5.689.
- Teixeira, A.; Rodrigues, S. Pork Meat Quality of Preto Alentejano and Commercial Largewhite Landrace Cross. J. Integr. Agric. 2013, 12(11), 1961–1971. DOI: 10.1016/S2095-3119(13)60634-6.
- Hansen, L. L.; Claudi-Magnussen, C.; Jensen, S. K.; Andersen, H. J. Effect of Organic Pig Production Systems on Performance and Meat Quality. Meat Sci. 2006, 74, 605–615. DOI: 10.1016/j.meatsci.2006.02.014.
- Oliveira, G. B.; Alewijn, M.; Boerrigter-Eenling, R.; Van Ruth, S. M. Compositional Signatures of Conventional, Free Range, and Organic Pork Meat Using Fingerprint Techniques. Foods. 2015, 4, 359–375. DOI: 10.3390/foods4030359.
- Tomažin, U.; Batorek-Lukač, N.; Škrlep, M.; Prevolnik-Povše, M.; Čandek-Potokar, M. Meat and Fat Quality of Krškopolje Pigs Reared in Conventional and Organic Production Systems. Animal. 2019, 13(5), 1103–1110. DOI: 10.1017/S1751731118002409.
- Gatlin, L. A.; See, M. T.; Hansen, J. A.; Sutton, D.; Odle, J. The Effects of Dietary Fat Sources, Levels, and Feeding Intervals on Pork Fatty Acid Composition. J. Anim. Sci. 2002, 80, 1606–1615. DOI: 10.2527/2002.8061606x.
- Gjerlaug-Enger, E.; Haug, A.; Gaarder, M.; Ljøkjel, K.; Stenseth, R. S.; Sigfridson, K.; Egelandsdal, B.; Saarem, K.; Berg, P. Pig Feeds Rich in Rapeseed Products and Organic Selenium Increased Omega-3 Fatty Acids and Selenium in Pork Meat and Backfat. Food Sci. Nutr. 2015, 3, 120–128. DOI: 10.1002/fsn3.182.
- Morgan, C. A.; Noble, R. C.; Cocchi, M.; McCartney, R. Manipulation of the Fatty Acid Composition of Pig Meat Lipids by Dietary Means. J. Sci. Food Agric. 1992, 58, 357–368. DOI: 10.1002/jsfa.2740580310.
- Peiretti, P. G.; Gai, F.; Brugiapaglia, A.; Mussa, P. P.; Meineri, G. Fresh Meat Quality of Pigs Fed Diets with Different Fatty Acid Profiles and Supplemented with Red Wine Solids. Food Sci. Technol (Campinas). 2015, 35, 633–642. DOI: 10.1590/1678-457X.6653.
- Van Lunen, T. A.; Hurnik, D.; Jebelian, V. Growth Performance, Carcass Quality, Meat Quality and Fatty Acid Composition of Pigs Fed Diets. Can. J. Anim. Sci. 2003, 83(1), 45–52. DOI: 10.4141/A01-092.
- Bondia-Pons, I.; Savolainen, O.; Törrönen, R.; Martinez, J. A.; Poutanen, K.; Hanhineva, K. Metabolic Profiling of Goji Berry Extracts for Discrimination of Geographical Origin by Non-targeted Liquid Chromatography Coupled to Quadrupole Time-of-flight Mass Spectrometry. Food Res. Int. 2014, 63, 132–138. DOI: 10.1016/j.foodres.2014.01.067.
- Klockmann, S.; Reiner, E.; Bachmann, R.; Hackl, T.; Fischer, M. Food Fingerprinting: Metabolomic Approaches for Geographical Origin Discrimination of Hazelnuts (Corylus Avellana) by UPLC-QTOF-MS. J. Agric. Food Chem. 2016, 64(48), 9253–9262. DOI: 10.1021/acs.jafc.6b04433.
- Willenberg, I.; Parma, A.; Bonte, A.; Matthäus, B. Development of Chemometric Models Based on a LC-qToF-MS Approach to Verify the Geographic Origin of Virgin Olive Oil. Foods. 2021, 10(2), 479. DOI: 10.3390/foods10020479.
- Sun, S.; Guo, B.; Wei, Y.; Fan, M. Classification of Geographical Origins and Prediction of δ13C and δ15N Values of Lamb Meat by near Infrared Reflectance Spectroscopy. Food Chem. 2012, 135(2), 508–514. DOI: 10.1016/j.foodchem.2012.05.004.
- Li, Y.; Wei, Y. M.; Pan, J. R.; Guo, B. L. Determination of Geographical Origin of Beef Based on FT IR Spectroscopy Analysis. Guang Pu Xue Yu Guang Pu Fen Xi. 2009, 29, 647–651.
- Prevolnik, M.; Čandek-Potokar, M.; Škorjanc, D. Ability of NIR Spectroscopy to Predict Meat Chemical Composition and Quality – A Review. Czech J. Anim. Sci. 2004, 49, 500–510. DOI: 10.17221/4337-CJAS.
- Mi, S.; Shang, K.; Li, X.; Zhang, C. H.; Liu, J. Q.; Huang, D. Q. Characterization and Discrimination of Selected China’s Domestic Pork Using an LC-MS-based Lipidomics Approach. Food Control. 2019, 100, 305–314. DOI: 10.1016/j.foodcont.2019.02.001.
- Mengsi, C.; Qing’an, H.; Jianhong, Z.; Ruoxi, Z.; Jiancheng, W.; Wenyuan, G.; Weijun, K.; Kaoqi, L.; Lianfeng, A. An Untargeted and Pseudotargeted Metabolomic Combination Approach to Identify Differential Markers to Distinguish Live from Dead Pork Meat by Liquid Chromatography–mass Spectrometry. J. Chromatogr. A. 2020, 1610, 460553. DOI: 10.1016/j.chroma.2019.460553.
- Anastassiades, M.; Lehotay, S. J.; Stajnbaher, D.; Schenck, F. J. Fast and Easy Multiresidue Method Employing Acetonitrile Extraction/partitioning and ”Dispersive Solid-phase Extraction” for the Determination of Pesticide Residues in Produce. J. AOAC Int. 2003, 86, 412–431. DOI: 10.1093/jaoac/86.2.412.
- Lee, E. M.; Park, S. J.; Lee, J. E.; Lee, B. M.; Shin, B. K.; Kang, D. J.; Choi, H. K.; Kim, Y. S.; Lee, D. Y. Highly Geographical Specificity of Metabolomic Traits among Korean Domestic Soybeans (Glycine Max). Food Res. Int. 2019, 120, 12–18. DOI: 10.1016/j.foodres.2019.02.021.
- Da Silva, G. S.; Canuto, K. M.; Ribeiro, P. R. V.; de Brito, E. S.; Nascimento, M. M.; Zocolo, G. J.; Coutinho, J. P.; de Jesus, R. M. Chemical Profiling of Guarana Seeds (Paullinia Cupana) from Different Geographical Origins Using UPLC-QTOF-MS Combined with Chemometrics. Food Res. Int. 2017, 102, 700–709. DOI: 10.1016/j.foodres.2017.09.055.
- Cavanna, D.; Loffi, C.; Dall’Asta, C.; Suman, M. A Non-targeted High-resolution Mass Spectrometry Approach for the Assessment of the Geographical Origin of Durum Wheat. Food Chem. 2020, 317, 126366. DOI: 10.1016/j.foodchem.2020.126366.
- Díaz, R.; Pozo, O. J.; Sancho, J. V.; Hernández, F. Metabolomic Approaches for Orange Origin Discrimination by Ultra-high Performance Liquid Chromatography Coupled to Quadrupole Time-of-flight Mass Spectrometry. Food Chem. 2014, 157, 84–93. DOI: 10.1016/j.foodchem.2014.02.009.
- Shang, J.; Liu, J.; He, M.; Shang, E.; Zhang, L.; Shan, M.; Yao, W.; Yu, B.; Yao, Y.; Ding, A. UHPLC/Q-TOF MS-based Plasma Metabolic Profiling Analysis of the Bleeding Mechanism in a Rat Model of Yeast and Ethanol-induced Blood Heat and Hemorrhage Syndrome. J. Pharm. Biomed. Anal. 2014, 92, 26–34. DOI: 10.1016/j.jpba.2013.12.019.
- Song, X.; She, S.; Xin, M.; Chen, L.; Li, Y.; Vander Heyden, Y.; Rogers, K. M.; Chen, L. Detection of Adulteration in Chinese Monofloral Honey Using 1H Nuclear Magnetic Resonance and Chemometrics. J. Food Compost. Anal. 2020, 86, 103390. DOI: 10.1016/j.jfca.2019.103390.
- Liu, J.; Chen, N.; Yang, J.; Yang, B.; Ouyang, Z.; Wu, C.; Yuan, Y.; Wang, W.; Chen, M. An Integrated Approach Combining HPLC, GC/MS, NIRS, and Chemometrics for the Geographical Discrimination and Commercial Categorization of Saffron. Food Chem. 2018, 253, 284–292. DOI: 10.1016/j.foodchem.2018.01.140.
- Chung, I. M.; Kim, J. K.; Han, J. G.; Kong, W. S.; Kim, S. Y.; Yang, Y. J.; An, Y. J.; Kwon, C.; Chi, H. Y.; Jung, M. Y., et al. Potential Geo-discriminative Tools to Trace the Origins of the Dried Slices of Shiitake (Lentinula Edodes) Using Stable Isotope Ratios and OPLS-DA. Food Chem. 2019, 295, 505–513. DOI: 10.1016/j.foodchem.2019.05.143.
- Lavine, B. K.; Rayens, W. S. Statistical Discriminant Analysis. In Comprehensive Chemometrics: Chemical and Biochemical Data Analysis; Brown, S. D., Tauler, R., Walczak, B., Eds.; Elsevier: Amsterdam, Netherlands, 2009; Vol. 3, pp 517–540.
- Dugan, M. E. R.; Vahmani, P.; Turner, T. D.; Mapiye, C.; Juárez, M.; Prieto, N.; Beaulieu, A. D.; Zijlstra, R. T.; Patience, J. F.; Aalhus, J. L. Pork as a Source of Omega-3 (N-3) Fatty Acids. J. Clin. Med. 2015, 4, 1999–2011. DOI: 10.3390/jcm4121956.
- D’Arrigo, M.; Hoz, L.; Lopez-Bote, C. J.; Cambero, I.; Pin, C.; Ordóñez, J. A. Effect of Dietary Linseed Oil on Pig Hepatic Tissue Fatty Acid Composition and Susceptibility to Lipid Peroxidation. Nutr. Res. 2002, 22, 1189–1196. DOI: 10.1016/S0271-5317(02)00417-7.
- Alonso, V.; Najes, L. M.; Provincial, L.; Guillén, E.; Gil, M.; Roncalés, P.; Beltrán, J. A. Influence of Dietary Fat on Pork Eating Quality. Meat Sci. 2012, 92(4), 366–373. DOI: 10.1016/j.meatsci.2012.01.004.
- Park, S. W.; Seo, S. H.; Chang, M. B.; Shin, I. S.; Paik, I. K. Evaluation of Soybean Oil as a Lipid Source for Pig Diets. Asian-australas. J. Anim. Sci. 2009, 22, 1311–1319. DOI: 10.5713/ajas.2009.90104.
- Jasińska, K.; Kurek, M. A. The Effect of Oil Plants Supplementation in Pig Diet on Quality and Nutritive Value of Pork Meat: Review by Institute of Genetics and Animal Breeding. Anim. Sci. Papers Rep. 2017, 35, 137–146.
- Kralik, G.; Margeta, V.; Suchý, P.; Straková, E. Effects of Dietary Supplementation with Rapeseed and Linseed Oil on the Composition of Fatty Acids in Porcine Muscle Tissue. Acta Vet. Brno. 2010, 79(3), 363–367. DOI: 10.2754/avb201079030363.
- Zeisel, S. H.; Da Costa, K. A. Choline: An Essential Nutrient for Public Health. Nutr. Rev. 2009, 67, 615–623. DOI: 10.1111/j.1753-4887.2009.00246.x.
- Garrido, D.; Chanteloup, N. K.; Trotereau, A.; Lion, A.; Bailleul, G.; Esnault, E.; Trapp, S.; Quéré, P.; Schouler, C.; Guabiraba, R. Characterization of the Phospholipid Platelet-activating Factor as a Mediator of Inflammation in Chickens. Front. Vet. Sci. 2017, 4, 226. DOI: 10.3389/fvets.2017.00226.
- Howard, K. M. Platelet-activating Factor Receptor. In Encyclopedia of Biological Chemistry, 2nd ed.; Lennarz, W. J., Lane, M. D., Eds.; Elsevier: Amsterdam, Netherlands, 2013; pp 533–537.
- Kukharenko, A.; Brito, A.; Kozhevnikova, M. V.; Moskaleva, N.; Markin, P. A.; Bochkareva, N.; Korobkova, E. O.; Belenkov, Y. N.; Privalova, E. V.; Larcova, E. V., et al. Relationship between the Plasma Acylcarnitine Profile and Cardiometabolic Risk Factors in Adults Diagnosed with Cardiovascular Diseases. Clin. Chim. Acta. 2020, 507, 250–256. DOI: 10.1016/j.cca.2020.04.035.
- Reuter, S. E.; Evans, A. M. Carnitine and Acylcarnitines: Pharmacokinetic, Pharmacological and Clinical Aspects. Clin Pharmacokinet. 2012, 51(9), 553–572. DOI: 10.1007/BF03261931.
- Shimada, M.; Cheng, J.; Sanyal, A. Fatty Liver, NASH, and Alcoholic Liver Disease. In Pathobiology of Human Disease, 1st ed.; McManus, L., Mitchell, R., Eds.; Academic Press: Cambridge, MA, USA, 2014; pp 1817–1824.
- Cameron, N. D.; Enser, M.; Nute, G. R.; Whittington, F. M.; Penman, J. C.; Fisken, A. C.; Perry, A. M.; Wood, J. D. Genotype with Nutrition Interaction on Fatty Acid Composition of Intramuscular Fat and the Relationship with Flavour of Pig Meat. Meat Sci. 2000, 55, 187–195. DOI: 10.1016/S0309-1740(99)00142-4.
- Alfaia, C. M.; Lopes, P. A.; Madeira, M. S.; Pestana, J. M.; Coelho, D.; Toldrá, F.; Prates, J. A. M. Current Feeding Strategies to Improve Pork Intramuscular Fat Content and Its Nutritional Quality. Adv. Food Nut. Res. 2019, 89, 53–94.
- Mitchaothai, J.; Yuangklang, C.; Wittayakun, S.; Vasupen, K.; Wongsutthavas, S.; Srenanul, P.; Hovenier, R.; Everts, H.; Beynen, A. C. Effect of Dietary Fat Type on Meat Quality and Fatty Acid Composition of Various Tissues in Growing-finishing Swine. Meat Sci. 2007, 76, 95–101. DOI: 10.1016/j.meatsci.2006.10.017.
- Nasir, Z.; Wang, L. F.; Young, M. G.; Swift, M. L.; Beltranena, E.; Zijlstra, R. T. The Effect of Feeding Barley on Diet Nutrient Digestibility and Growth Performance of Starter Pigs. Anim. Feed Sci. Technol. 2015, 210, 287–294. DOI: 10.1016/j.anifeedsci.2015.10.014.
- Raes, K.; Smet, S. D.; Demeyer, D. Effect of Dietary Fatty Acids on Incorporation of Long Chain Polyunsaturated Fatty Acids and Conjugated Linoleic Acid in Lamb, Beef and Pork Meat: A Review. Anim. Feed Sci. Technol. 2004, 113(1–4), 199–221. DOI: 10.1016/j.anifeedsci.2003.09.001.
- Saeys, W.; Mouazen, A. M.; Ramon, H. Potential for Onsite and Online Analysis of Pig Manure Using Visible and near Infrared Reflectance Spectroscopy. Biosyst. Eng. 2005, 91(4), 393–402. DOI: 10.1016/j.biosystemseng.2005.05.001.
- Fujimura, Y.; Kurihara, K.; Ida, M.; Kosaka, R.; Miura, D.; Wariishi, H.; Maeda-Yamamoto, M.; Nesumi, A.; Saito, T.; Kanda, T., et al. Metabolomics-driven Nutraceutical Evaluation of Diverse Green Tea Cultivars. PLoS One. 2011, 6, e23426. DOI: 10.1371/journal.pone.0023426.