
 ?Mathematical formulae have been encoded as MathML and are displayed in this HTML version using MathJax in order to improve their display. Uncheck the box to turn MathJax off. This feature requires Javascript. Click on a formula to zoom.
ABSTRACT
It is significant to identify the moldy status of stored maize by fungi infection in the early stage. Hyperspectral imaging (HSI) combined with the sparse auto-encoders (SAE) and convolutional neural network (CNN) algorithms was used to classify the moldy grades of maize kernels. The HSI data were obtained in the range of 400–1000 nm, and four grades from health to heavy mildew were distinguished using the measured fungal spores of maize. The depth spectral features were represented using SAE and the image features were extracted by CNN. K nearest neighbors, support vector machine (SVM), and partial least squares discriminant analysis classifiers were combined with the spectral and image features to establish classification models to identify the different moldy grades of maize kernels. The comparison results indicated that the fusion of SAE and CNN combined with the SVM classifier to construct the SAE-CNN-SVM model had the most satisfactory identification result with high correct recognition rates of 99.47% and 98.94% for the training and testing sets, respectively, and the values of sensitivity and specificity were 0.95–1. The moldy grades were presented intuitively on the maize image based on pixels or kernel-wise. Therefore, the HSI with the SAE-CNN-SVM model had good recognition ability for the early detection of moldy maize kernels, which could potentially provide technical support for the development of online detection of moldy maize kernels during storage.
Introduction
Maize is one of the most widely planted and high-yield grain crops in the world, and it is also an important raw material for processing crops in feed, chemical, food, and other industries.[Citation1] However, maize is easy to be infected by the main fungus of Fusarium, Aspergillus, and Penicillium during postpartum to processing with high temperature and high humidity because of its large embryo, high water content, and rich nutrients, which will make its kernels moldy and further lead to the decline or loss of the edible and feeding quality.[Citation2,Citation3] More importantly, if the maize infected with fungi is not detected early, they will further produce mycotoxins that can threaten human and animal health.[Citation4,Citation5] Therefore, early detection of moldy kernels is one of the important tasks of grain quality inspection, which can be used to control and reduce grain loss.
The number of fungal spores is an important index to evaluate the early mildew status and grades of maize during storage and processing.[Citation6] In China, the detection of fungal spores, total plate count, and mycotoxins are very important to evaluate the quality and safety of grain.[Citation7] However, the related detection methods are mainly microbial experiments, such as spore counting, enzyme-linked immunosorbent assay, polymerase chain reaction, and high-performance liquid chromatography.[Citation8,Citation9] The accuracy and stability of the above methods can be guaranteed, but they are time-consuming, laborious, destructive, and difficult to meet the needs of on-line batch detection. So, quality inspectors urgently need a rapid, nondestructive, and batch detection method for the early mildew status of maize during grain collection, storage, and transportation.
Hyperspectral imaging (HSI) is a rapid and nondestructive testing technology with the characteristics of multi-wavelengths, high spectral resolution, and integration of image spectrum.[Citation10–12] HSI can simultaneously detect the changes of internal components and external properties of samples, which has been applied in the detection of cereal fungi and mycotoxins infection.[Citation13,Citation14] Such as the maize kernels infected with Fusarium verticillioides were detected by partial least squares (PLS) regression and principal component analysis (PCA).[Citation15] The maize kernels naturally infected by fungi were classified using PCA, successive projection algorithm (SPA), and SVM methods.[Citation16] Early detection of fungal infection (Aspergillus flavus and Penicillium commune) in five different pulses using HSI combined with linear discriminant analysis (LDA) and quadratic discriminant analysis (QDA) classifiers.[Citation17] The quantification of ergosterol and the classification of deoxynivalenol in wheat samples using HSI with prediction and classification models.[Citation18] Also, detection of different contamination levels of aflatoxin B1 (AFB1) on surfaces of maize kernels using HSI with classification methods.[Citation19] So, most of the above research studies used HSI technology combined with the traditional feature learning methods to detect grain mildew state.
However, the feature learning method needs to set too many parameters artificially, which leads to poor flexibility.[Citation20] It is also easy to over fitting in the process of training and the effect of the model transfer is not ideal.[Citation21] So, those methods are more suitable for homogeneity samples with salient features or small amounts of data. Generally, it is uneven and complex that maize kernels are infected by fungi during storage, and the characteristics of early mildew of kernel are not obvious, which is implied in the obtained big HSI data. In addition, it is a key problem to dig hidden features from massive HSI data to express grain mildew characteristics, which is difficult to achieve by feature learning methods.
Deep-learning algorithm can combine low-level features to form a more high-level abstract representation through layer-by-layer learning, which can replace the artificial feature learning method to solve the problem of poor adaptability of the model.[Citation22,Citation23] Many models have been applied in HSI data processing,[Citation24,Citation25] including convolutional neural network (CNN), deep belief network (DBN), sparse auto-encoder (SAE), etc. Such as the optimization of massive haploid maize seeds,[Citation26] the detection of early symptoms of infection rice by striped stem borer,[Citation27] and the identification of moldy peanut.[Citation28] The above studies have proved that the deep learning algorithm can effectively improve the prediction accuracy and the feature expression ability of the model.
From the above description, many research studies only use a single feature of spectrum or image for analysis, which fails to display the role of the integration of image-spectrum of HSI. Also, a few studies used the deep fusion features of the spectrum (extraction by SAE) and image (extraction by CNN) to establish models for the detection of the early moldy status of maize kernels. In this study, we mainly attempt to identify the moldy grades of the stored maize kernels using HSI technology with the combination of SAE and CNN algorithms. The specific aims of this study were (1) to collect the HSI data (400–1000 nm) of maize kernels during storage; (2) to inspect fungi spores of maize kernels and divide four moldy grades by these values; (3) to extract the deep spectral features using SAE and dig the deep image information by CNN; (4) to construct classification models using K nearest neighbors (KNNs), support vector machine (SVM), and partial least square discriminant analysis (PLS-DA) classifiers to distinguish the different moldy grades of maize kernels; and (5) to visualize the identification results on the image of maize kernels based on pixels-wise and kernel-wise.
Materials and methods
Preparation of moldy maize kernels
A total of 285 maize samples (each sample contained 500 g kernels of maize) were collected from some grain depots (bulk grain) in China, which were packed in airtight bags and firstly stored in an artificial climate chamber with low temperature (≤4°C) for sample separation. Samples were randomly selected and each sample was divided into two parts for the experiment, one for HSI data scanning (30–50 kernels in each HSI image) and the other for the detection of fungal spores that could be used to determinate the naturally moldy maize grades by the method of the inspection of grain and oil-storage fungal examination-enumeration spores of fungi (the developed grain industry standard of China).[Citation29] The standard specifies the maize samples could be divided into four moldy grades using the values of fungal spores data: grade1, grade2, grade3, and grade4, they correspond to health (value<1.0 × 10⁵), mild mildew (1.0 × 10⁵< value <9.9 × 10⁵), moderate mildew (1.0 × 10⁶< value < 9.9 × 10⁶), and heavy mildew (value >1.0 × 10⁷). After the statistical results, two-third of the samples (n = 190) was selected randomly as the training set and the remaining one-third (n = 95) was used as the testing set, which ensured independence between the two sets.
Detection methods of fungal spores
The fungal spores of maize were measured by the above standard methods, main steps include 10 g of maize kernels and 30 ml of deionized water were taken in a 50 ml test tube. The tube was plugged and shaken violently for 1 min (approximately 120–150 times) with manual way. After 5 min, the filtrate was collected for the nest trial using a filter cloth with 300 meshes. A hemocytometer with 25 middle squares was used to count the values of fungal spores (the number of spores in the middle square was recorded). The filtrate was dripped onto the hemocytometer plate with a 20 mm × 20 mm coverslip using a dropper pipette. After 30 s, the fungal spores on the plate were observed and counted under a microscope (eyepiece: 10×; objective lens: 10×–60×). EquationEq. (1)(1)
(1) is used to record spores in five squares <10 and EquationEq. (2)
(2)
(2) is used to record spores in 25 squares. Two parallel experiments were performed for each sample and the highest value was recorded.
where X1 was the number of fungal spores of maize kernel (count/g) and A represents the total number of fungal spores in 5 or 25 squares.
Hyperspectral imaging system
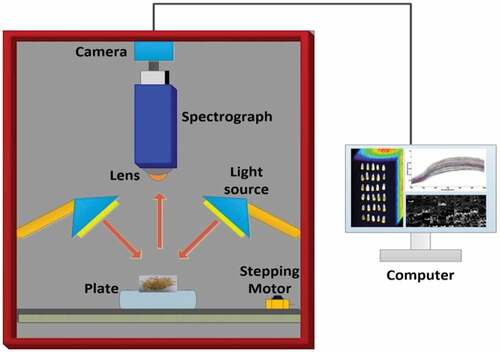
The HSI system in this study is shown in . The whole system is packed in a black box to avoid external light interference and the major components as: the transmission stage and a stepping motor (EZHR17EN; AllMotion Inc.,); a stable output halogen light source (21 V/150 W) with two branch linear light guide (3900-ER; Illumination Technologies Inc.); an imaging spectrograph (ImSpector VNIRV10E) with a spectral range of 325–1100 nm; a EMCCD camera (Andor Luca EMCCD DL-604 M; Andor Technology Ltd.) with 1608 × 1208 pixels and 6.15 mm x 14.2 mm for image size; a computer is used to collect HSI data by acquisition software (ACER N16Q1, Intel Core i7-6500 [email protected] GHz, RAM 12GB). The bands of the low signal-to-noise ratio were discarded because of the low quantum efficiency and dark current of the CCD detector at the edges of the spectral region. Only the band of 400–1000 nm (824 bands) was used for further processing. The acquired raw HSI was calibrated into reflectance mode
according to
Figure 1. Diagram of main components of the HSI system.
where is the white reference image obtained using a standard white Teflon tile (~100% reflectance) and
is the black reference image acquired by covering the camera lens completely with its own black cap (~0% reflectance).
A total of 30 maize kernels (endosperm facing up) were placed on a black cardboard for image acquisition. The distance between the lens and maize samples was 280 mm, the camera exposure time was 9 ms, and the movement speed of the stepping motor was 1.2 mm/s. So, it took about 90 s to collect a completed HSI image.
Identification of the region of interest and spectral data extraction
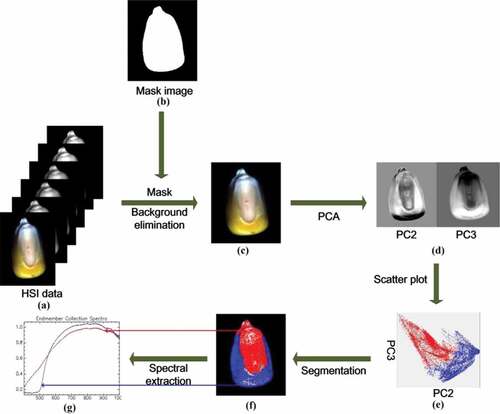
The spectral extraction process of a maize kernel is shown in . A single image with high reflectance intensity at 713 nm from HSI data was selected to form a binary image, which was used to remove the background of HSI data by mask processing. To differentiate the region of the embryo and endosperm on the kernel, HSI data was transformed by PCA, and the PC score images were obtained to generate a scatter plot. Compared with the scatter plot and original image, the region of the embryo was occupied by red and blue represented the region of the endosperm. Thus, the two regions can be effectively divided.[Citation30] Based on this, the regions of interest (ROI) were selected from the embryo location of the maize kernel, which corresponding to the area of the kernel was easy to be consumed by microorganisms. The average spectrum of ROIs was used to build models by the traditional feature extraction methods as well as a big data set composed of the spectrum of pixels in ROIs for training deep learning algorithms.
Figure 2. Selection region of interest and extraction of spectral information.
Established methods and models
Deeping network models of SAE and CNN
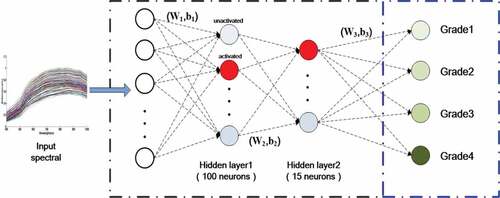
The SAE[Citation31]network mainly includes encoded and decoded layers, which is similar to multiple-layer neural network, and requires the output result to reconstruct the input data as much as possible. The structure of SAE is shown in . For a given input sample set {x1, x2, x3, …, xi}, where i represents the numbers of sample, xi is encoded to the hidden layer hi as
Figure 3. The architecture of sparse auto-encoder network with two hidden layers.
Then, hi is decoded to reconstruct the input data as output zi as
where fc represents the activation function and sigmoid function is used in this study, c = {wi1,bi1} and c´ = {wi2,bi2} are the net parameters of the encoded and decoded layers, respectively, w is the correlation weight matrixes, and b is the bias items. The cost function of SAE can be represented as
where represents the relative entropy of the Kullback–Leibler, ρ is a sparse coefficient,
is the average activation degree of the hidden layer neurons, λ is weight attenuation coefficient, and β is sparse penalty coefficient. The gray neurons represent the unactivated unit (sparse values may be close to zero) and red neurons are the activated unit (in ). The quasi-Newton with limited-memory methods for L-BFGS was used to train the optimal net parameters (c = {w, b}). The training was completed using the back propagation algorithm and the weight was updated with the batch gradient descent method during iteration. The SAE network with two hidden layers was constructed in this study for representing the abstract depth features of input spectra. A classification layer (e.g., SoftMax layer) is added at the end of SAE, and the net parameters (c = {w,b}) of each layer are adjusted by the way of fine-tuning combined with the labeled training data using the cost function for guidance. Finally, the input spectra xi can be represented as the sparse features h(xi) from the hidden layer output. Also, the sparse features h(xi) can be used to express the moldy status of maize kernels as the spectral features from SAE for modeling.
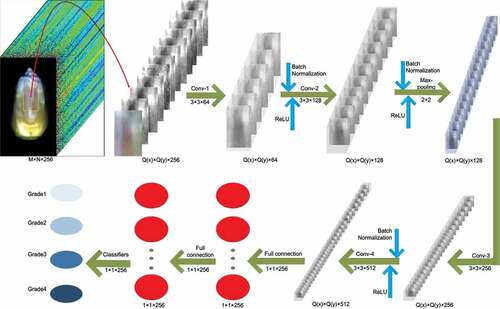
CNN is a kind of multi-layer perceptron similar to the artificial neural network, which is often used to analyze visual images.[Citation32,Citation33] Inspired by classical and successful VGG16, LeNet-5, and AlexNet, the architecture of CNN in this study is illustrated in . CNN was mainly composed of the following nine layers: input layer, four convolutional layers, one max pooling layer, two fully connected layers, and output layer. The input data (Q(x)×Q(y)×256) was the ROI image of maize, which was processed by PCA (Q(x)×Q(y) is the size of image and 256 represents the number of spectral bands). The 3 × 3 convolution kernels were used for each convolution layer (conv1˜conv4) and the number of channels was 64, 128, 256, and 512, respectively, and the stride was set to 1 and padding was 0. The 2 × 2 max-pooling layer was added to the conv2 layer, which was used to enhance the image features obtained by the convolution layer. Two connected layers (FC1 and FC2) of the size 1 × 1 × 256 were connected to the conv4 layer, which were used to express image features by weight. The output used the softmax function as a classifier. After each convolution operation, batch normalization was used to avoid overfitting and improve the generalization ability of the network; further, the nonlinear transformation was carried out by using the ReLU function.
Figure 4. The architecture of the proposed CNN.
The cross-entropy was taken as the cost function of the CNN model, and the gradient descent method was used to optimize the parameters of the network model. The equation is expressed as
where N is the number of samples, is the prediction value, and
is the true value. In the process of CNN training, the optimal CNN model was obtained according to the change trend of cost results during iterative training with different values of learning rate and the attenuation factor. The established CNN was used to extract the deep abstract features of images to express the moldy status of maize kernels.
Spectra and image features extraction algorithms
To further verify the feature dig and expression ability of SAE and the CNN model for the different moldy status maize. The traditional feature extraction method of successive projection algorithm (SPA)[Citation34,Citation35] was used to select optimal spectral wavelengths (18 spectral features were selected from original spectral data (824 bands) by SPA for modeling), and gray level co-occurrence matrix (GLCM) was used to extract texture features from the HSI image. We compared the recognition effects of the established classification models based on spectral features extracted by SAE and SPA algorithms based on image features by CNN and GLCM methods.
Classifiers
KNN is a common classifier based on a supervised learning algorithm.[Citation36] The principle of KNN is to judge the attribution of class according to the category of the nearest k points when predicting a new value. KNN has the characteristics of simple, fast, and insensitive to outliers. SVM is a nonlinear classifier.[Citation37] Its learning strategy is interval maximization, which can be formalized as a convex quadratic programming problem and also equivalent to the regularized minimization of the loss function. SVM has good robustness and generalization ability, which can effectively avoid “dimension disaster.” PLS-DA is a statistical method, which combines the advantages of principal component analysis, canonical correlation analysis, and multiple linear regression analysis.[Citation38] It is used to build a linear regression model by projecting the predicted variables and observed variables into a new space. The above three classifiers were combined with the spectral and image features to establish classification models for identifying moldy grades of maize kernels.
Model evaluation
In this study, the correct recognition rate (CRR) was considered as evaluation index to verify model performance, the equation was as follows:
where Nc is the number of correctly classified maize kernels in data sets and NT is the total number of maize kernels corresponding to the sets. The sensitivity and specificity were selected as another evaluation indexes[Citation39]:
where Tp is the true positive, Fn is the false negative, Tn is the true negative, and FP is the false positive. The model is considered to have strong recognition ability with the indexes that are close to one.
Results and discussion
Reference measurement of fungal spores
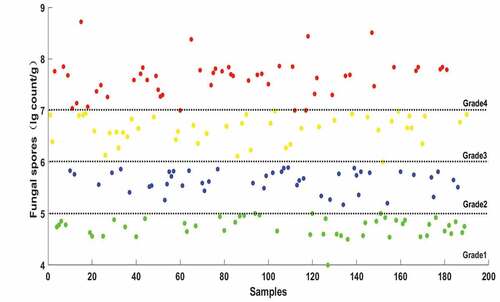
To facilitate statistics and modeling, all measured fungal spores were converted into logarithmic representation (lg count/g): grade1 (value <5 lg count/g), grade2 (5 lg count/g < value <6 lg count/g), grade3 (6 lg count/g < value <7 lg count/g), grade4 (value >7 lg count/g). The scatter plot of the measured values in the training set is shown in . The number of fungal spores increased gradually and the moldy status of maize kernel changed from grade1 (health) to grade4 (heavy mildew). In total, 72 samples were classified as grade1 and their values were in the range of 4.0–5.0 lg count/g and 66 samples were classified as grade2 (values: 5.1–5.9 lg count/g). For the first two grades, the growth rate of fungi was relatively slow and the nutrients in the kernels have not been absorbed completely.[Citation40] Furthermore, 75 samples were classified as grade3 (6.0 lg count/g < values <6.9 lg count/g) and another 72 samples were classified as grade4 (7.0 lg count/g < values <8.7 lg count/g), it meant that the fungal spores began to increase and the grains became mildewed seriously. In addition, the statistical results of fungal spores for all maize samples in the training and testing sets are shown in . In detail, the mean and standard deviations of the spores in the training set were 6.36 and 1.43 lg count/g and in the testing set were 6.58 and 1.89lg count/g, respectively. Moreover, the range of values (4.26–8.64) in the testing set was within the range in the training set (4.10–8.89). Therefore, the division of the training and testing set was beneficial for improving the robustness of the model.
Table 1. Measured values of fungal spores of maize in the training and testing sets
Figure 5. Scatter plot of fungal spores in training set samples.
Spectral analysis
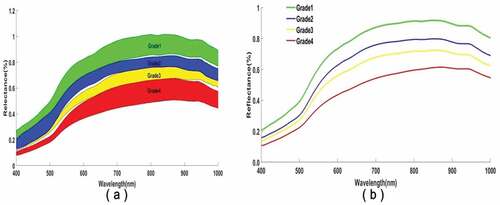
It could be seen from that the raw reflectance spectrum of all maize samples with different moldy grades showed a similar change tendency in the 400–1000 nm wavelength, and there were no obvious absorption peaks on the smooth spectral line. The reflectance intensities of kernels changed from high to low as the fungal spores and storage days increased. That was to say the mildewed kernel increased the absorption ability of light, and this phenomenon might be related to biochemical changes of maize kernel during storage, such as water, protein, starch, and other nutrients will decline, the surface loses luster, and the color becomes dark.[Citation41] Furthermore, the spectral line had low reflectance values in the range of 400–600 nm, which might be related to the light absorption intensity of pigment contents in maize, such as chlorophyll and carotenoids.[Citation42] The wavelength at approximately 500 nm might be referred to as the color changes of the maize kernel.[Citation43] The less clear peak relatively might be linked to water of the maize that was distributed at 960 nm. It is necessary to further analyze whether these feature wavelengths can be used to build classification models for expressing the characteristic of different moldy grade kernels.
Figure 6. Original spectra of all maize samples (a) and mean spectra at different moldy grades (b).
Training results of SAE and CNN
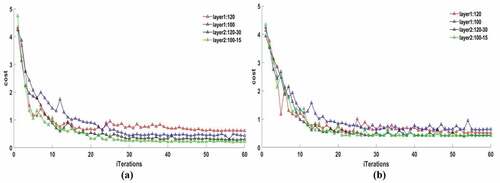
The SAE was established using the raw spectral wavelengths of the pixel in the ROI of maize kernels. Two hidden net layers were set in SAE, the neurons were considered as 120 or 100 for layer1 and 30 or 15 for layer2, sparse constraint p of 0.1 and 0.3; the SAE nets were trained based on the above network parameters and the optimal network obtained by results of cost value. The iterations were set to 250 for each net and the convergence trend of cost function tended to be stable after 55–60 iterations for all nets.
The training results of SAE nets are shown in . The convergence of the cost function of SAE with one hidden layer (layer1:120 or layer1:100) was inferior to that of SAE with two hidden layers (layer2:120–30 or layer2:100–15). With p as 0.1, the cost values of SAE for layer1:120 and layer1:100 were stable at 0.75 and 0.63, respectively, and the costs reduced to 0.45 and 0.31 for layer2:120–30 and layer2:100–15, respectively ()). By contrast, a similar trend with a p value of 0.3 is shown in ). The relatively better results of the SAE for layer2:120–30 and layer2:100–15 converged to 0.41 and 0.43, respectively. According to the comparison of cost values, the best ideal architecture of SAE was layer2:100–15 with a p value of 0.1. So, the 15 output neuron features from hidden layer2 of SAE net(layer2:100–15) could be as the abstract spectral features of the original input spectra for modeling.
Figure 7. The cost of different hidden layers of SAE network with p of (a) 0.1 and (b) 0.3.
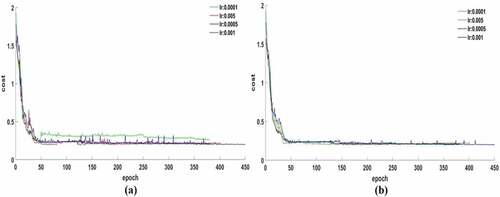
The optimal CNN net was obtained according to the change trend of cost results during iterative training (). In the process of CNN training, the initial learning rates were set as 0.0001, 0.005, 0.0005, and 0.001, two attenuation factors were 0.75 and 0.85, and the number of epochs were set as 380, 402, 382, and 450, respectively. With the attenuation factor set as 0.75 ()), the cost function with different learning rates had obvious volatility in the early stage of training. Among them, the convergence effect under a learning rate of 0.0001 was obviously inferior to others and its value was stable at 0.33, a good convergence result with a learning rate of 0.001 was obtained and value reached to 0.21. For the attenuation factor of 0.85 ()), the overall convergence effects were satisfactory and the cost values converged to the range of 0.19–0.21. So, the learning rate of 0.001 and the attenuation factor of 0.85 were considered as the best parameters for the CNN model.
Figure 8. The cost of different learning rates with attenuation factor of (a) 0.75 and (b) 0.85.
Identification results based on spectral features from SAE and SPA
The identification results of different mildew grades from maize kernels based on spectral features used the deep model of SAE and the traditional models of KNN, SVM, and PLS-DA (only use spectral features by SPA) and are shown in . For the SAE model, the overall CRRs of the training and testing sets were 96.31% and 93.68%, respectively, which had a significant performance. The recognition effect of grade1 and grade4 datasets (only one sample was wrongly classified in both sets) was better than that of grade2 and grade3. The recognition result of the KNN model (CRRs of 88.42%) was close to that of the SVM model (CRRs of 88.94%) in the training set, and their CRRs decreased to 83.15% and 81.05% in the testing set, respectively. The recognition ability of the two models was less than that of the SAE model, and the CRRs for the KNN and SVM were lower by 10.53% and 12.63% than SAE for the testing set. The performance of the PLS-DA model (CRRs was only 74.73% for the testing set) was not as good as that of KNN and SVM models, even less than that of the SAE model. In other words, the PLS-DA model is not suitable for the identification of moldy grades of maize kernel because of its weak stability. Therefore, based on spectral data, the classification ability shows that the SAE model performed better than others, which suggests that it may have significant potential for the identification of the mildew status of maize kernels. The expression effect of the mildew status of the maize kernels using the mined depth spectral features was better than that of shallow features from traditional methods.
Table 2. The identification results of moldy grades of maize based on spectral features
Identification results based on image features from CNN and GLCM
The identification results of different mildew grades from maize kernels based on image features used the deep model of CNN and the traditional models of KNN, SVM, and PLS-DA (only use image features by GLCM) and are shown in . Compared with the results of models based on spectral features, the deep model of CNN also had the best performance with CRRs of 95.78% and 94.73% for the training and testing sets, respectively. There was no significant difference between CNN and SAE models for CRRs, but the recognition effect of CNN was slightly better than that of SAE for the grade2 and grade3 datasets. Furthermore, the overall CRRs of SVM were slightly higher than the KNN in both the training set (CRRs of 91.05% vs 90.52%) and testing set (CRRs of 85.26% vs 84.21%), but these were 4.73% and 9.47% of the training and testing sets less than the corresponding CRRs for the CNN model. The recognition effect of the PLS-DA model was obviously inferior to that of other models, the overall CRRs of the training and testing sets were only 84.73% and 75.78% respectively, which were lower by 11.05% and 18.995% than the CNN model. So, the established CCN model with image features had the significant superiority for the identification of the mildew status of maize kernels than other models. The deep image features were more representative than brightness, color, and texture features for different mildew kernels.
Table 3. The identification results of moldy grades of maize based on imaging features
Identification results based on fusion features from SAE and CNN
On the basis of the above analysis, it is feasible to use spectral or image features alone combined with deep models (SAE and CNN) to identify the degree of mildew kernels, and the performance of the model is better than the traditional feature learning methods. To improve the accuracy and stability of the model, the abstract spectral features from SAE and deep image features from CNN were fused to build the recognition models using KNN, SVM, and PLS-DA classifiers (the models were named SAE-CNN-KNN, SAE-CNN-SVM, and SAE-CNN-PLS-DA). The results obtained using these models are shown in .
Table 4. The identification results of moldy grades of maize based on fusion features
The performance of models based on fusion features had a significant improvement over the models with the single feature. The best SAE-CNN-SVM model with high CRRs of 99.47% and 98.94% in the training and testing sets respectively. One sample from grade4 was mistakenly classified into grade3 in the training set, so did the testing set. The CRRs of the SAE-CNN-KNN model in both the training set (CRRs of 98.94%) and testing set (CRRs of 96.84%) were slightly lower than that of the SAE-CNN-SVM model. For grade2 and grade3 in the training set, only one sample was misclassified to opposite grade. For the testing set, three samples from 95 samples were wrongly classified and the CRR for the grade2 samples was 100%. For the SAE-CNN-PLS-DA model, its recognition ability was obviously inferior to that of SAE-CNN-SVM and SAE-CNN-KNN models, but its CRRs were high by 10.53% and 8.95% than the PLS-DA with spectral feature (from 83.15% to 93.68%) and PLS-DA with image feature (from 84.73% to 93.68%) in the training set, and the increased values of CRRs were 15.79% and 14.74% in the testing set.
In addition, compared with spectral features, the CRRs of the SAE-CNN-SVM model were improved by 5.26% and 17.89% than SAE (from 93.68% to 98.94%) and SVM models (from 81.05% to 98.94%) in the testing set. For the image features and based on the testing set, the increased values of CRRs were 15.79% and 14.74% than CNN (from 94.73% to 98.94%) and SVM models (from 85.26% to 98.94%). So, the established deep model based on fusion features could effectively improve the recognition ability of mildew maize kernels. It can also explain that maize mildew is a comprehensive result of the changes of internal components and external attributes.
On the basis of above analysis, SAE-CNN-SVM and SAE-CNN-KNN models were selected to further evaluation by the values of sensitivity and specificity in . For the SAE-CNN-SVM model, the values of the sensitivity and specificity were very satisfactory for grade1 and grade2 in both training and testing sets, which were all 1. The minimum sensitivity for the grade4 samples was 0.95 in the testing set and others were 0.98–0.99. By comparison, the SAE-CNN-KNN model expressed an acceptable result. For the training set, the values of the sensitivity and specificity for grade1 and grade4 were all 1, and other grades were 0.97–0.99. For the testing set, the values were slightly reduced to the range of 0.95–1, and only the specificity values for grade1 and grade4 were 1. Therefore, it can be further confirmed that the overall performance of the SAE-CNN-SVM model is superior to the SAE-CNN-KNN model by the results of the sensitivity and specificity.
Table 5. The results of sensitivity and specificity based on the SAE-CNN-KNN and SAE-CNN-SVM models
Visualization of the identification results
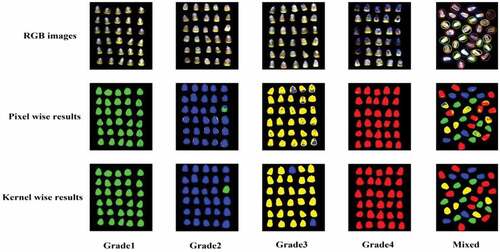
The identification results of the different moldy grades were visualized based on the pixel-wise and object-wise of the maize kernel in . Different grades were marked with corresponding colors: green for grade1, blue for grade2, yellow for grade3, and red for grade4. Grade1 and grade4 from the original images were significantly different and there was no significant difference between grade2 and grade3. These characteristics were also expressed intuitively in visualization images. For the pixel-wise, the kernel images of grade1 and grade4 were mainly occupied by green and red, respectively, which was a satisfactory result. Grade2 and grade3 were dominated by blue and yellow, respectively, but some pixels were misjudged as other grades and mixed colors appeared in kernels, such as green was mistakenly mixed with blue in grade2 and blue was mistakenly mixed with yellow in grade3. That is to say, the changes of moldy status on the maize kernel surface caused by fungi infection were not uniform during storage. For the kernel-wise, the recognition results were presented intuitively with different colors. Only one kernel from grade2 was misclassified into grade1, and the CRR could be expressed as 96.66% (29/30 × 100% = 96.66%); two kernels from grade3 were mistakenly classified into grade2 and CRR was 93.33% (28/30 × 100% = 93.33%). For the mixed kernels of maize classification, the identification results based on pixel-wise had not yet got more excellent effect; many pixels on kernel were misclassified into other grades and the mixed colors were found to be distributed on the surface of maize kernel. By comparison, an acceptable result based on kernel-wise was obtained and only one kernel from grade3 (yellow) was misclassified into grade4 (red). So, it is feasible to use the best classification model to visualize the moldy grades of maize kernel. That is difficult to achieve by chemical methods or naked eye observation.
Figure 9. Visualization results of different moldy maize based on pixel and kernel wise.
Conclusion
In this study, the accurate classifications of the moldy grades of contaminated maize kernels by fungi were investigated using HSI technology combined with deep learning algorithms of SAE and CNN. The maize samples were classified into four grades (health, mild mildew, moderate mildew, and heavy mildew) using the values of measured fungi spores as the reference. The deep spectral features were represented by SAE and optimal wavelengths were selected using SPA, the deep image features were dug by CNN network and texture features were extracted by GLCM. Based on spectral, image, and their fusion features, three classifiers of KNN, SVM, and PLS-DA were used to establish the recognition models for identifying the different moldy grades of kernels. Among them, the fusion features of SAE and CNN combined with SVM classifier to build the SAE-CNN-SVM model expressed the optimal classification performance with high CRRs of 99.47% and 98.94% for the training and testing sets, respectively. Also, the values of sensitivity and specificity were 0.95–1. The visualization results could be displayed intuitively the moldy grades of maize kernel, which was difficult to achieve by chemical methods or naked eye observation. So, the established deep model based on fusion features could effectively improve the recognition ability of mildew maize kernels than that of traditional learning methods. This research is expected to provide theoretical guideline for the equipment development of online batch testing of maize moldy kernels in the field, also to produce a new idea for the research of data dimension reduction and feature mining from HSI data.
Author contributions
Methodology, modeling, validation, writing-original of the manuscript by Dong Yang; software by Junyi Jiang; data collection and preprocessing by Yu Jie and Qianqian Li; supervision and revision of manuscript by Tianyu Shi. All authors have read and agreed to the published version of the manuscript. All authors of the present paper declare that they have no conflicts of interest. Informed consent was obtained from all individual participants included in the study.
Disclosure statement
No potential conflict of interest was reported by the author(s).
Additional information
Funding
References
- Manu, N.; Osekre, E. A.; Opit, G. P.; Arthur, F. H.; Campbell, J.; Armstrong, P.; Danso, J. K.; McNeill, S. G.; Campbell, J. Moisture Content, Insect Pests and Mycotoxin Levels of Maize on Farms in Tamale Environs in the Northern Region of Ghana. J. Stored Prod. Res. 2019, 83, 153–160. DOI: 10.1016/j.jspr.2019.05.015.
- Da Conceição, R. R. P.; Simeone, M. L. F.; Queiroz, V. A. V.; de Medeiros, E. P.; de Araújode Araújo, J. B.; Coutinho, W. M.; Da Silva, D. D.; de Araújo Miguel, R.; de Paula Lana, U. G.; de Resende Stoianoff, M. A. Application of Near-infrared Hyperspectral (NIR) Images Combined with Multivariate Image Analysis in the Differentiation of Two Mycotoxicogenic Fusarium Species Associated with Maize. Food Chem. 2021, 344, 128615. DOI: 10.1016/j.foodchem.2020.128615.
- Schmidt, M.; Horstmann, S.; Colli, L. D.; Danaher, M.; Speer, K.; Zannini, E.; Arendt, E. K. Impact of Fungal Contamination of Wheat on Grain Quality Criteria. J. Cereal Sci. 2016, 69, 95–103. DOI: 10.1016/j.jcs.2016.02.010.
- Jia, B.; Wang, W.; Ni, X. Z.; Chu, X.; Yoon, S. C.; Lawrence, K. C. Detection of Mycotoxins and Toxigenic Fungi in Cereal Grains Using Vibrational Spectroscopic Techniques: A Review. World Mycotoxin J. 2020, 13(2), 163–178. DOI: 10.3920/WMJ2019.2510.
- Shen, F.; Wu, Q.; Liu, P.; Jiang, X.; Fang, Y.; Cao, C. Detection of Aspergillus Spp. Contamination Levels in Peanuts by near Infrared Spectroscopy and Electronic Nose. Food Control. 2018, 93, 1–8. DOI: 10.1016/j.foodcont.2018.05.039.
- Shen, F.; Huang, Y.; Jiang, X.; Fang, Y.; Li, P.; Liu, Q.; Hu, Q.; Liu, X. On-line Prediction of Hazardous Fungal Contamination in Stored Maize by Integrating Vis/NIR Spectroscopy and Computer Vision, Spectrochimica Acta Part A. Mol. Biomol. Spectrosc. 2020, 229, 118012. DOI: 10.1016/j.saa.2019.118012.
- Cheng, X.; Vella, A.; Stasiewicz, M. Classification of Aflatoxin Contaminated Single Corn Kernels by Ultraviolet to near Infrared Spectroscopy. Food Control. 2019, 98, 261. DOI: 10.1016/j.foodcont.2018.11.037.
- Kandpal, L. M.; Lee, S.; Kim, M. S.; Bae, H.; Cho, B.-K. Short Wave Infrared (SWIR) Hyperspectral Imaging Technique for Examination of Aflatoxin B1 (AFB1) on Corn Kernels. Food Control. 2015, 51, 171–176. DOI: 10.1016/j.foodcont.2014.11.020.
- Senthilkumar, T.; Jayas, D. S.; White, N. D. G.; Fields, P. G.; Gräfenhan, T. Detection of Fungal Infection and Ochratoxin A Contamination in Stored Wheat Using Near-infrared Hyperspectral Imaging. J. Stored Prod. Res. 2016, 65, 30–39. DOI: 10.1016/j.jspr.2015.11.004.
- Yang, D.; He, D.; Lu, A.; Ren, D.; Wang, J. Combination of Spectral and Textural Information of Hyperspectral Imaging for the Prediction of the Moisture Content and Storage Time of Cooked Beef. Infrared Phys. Technol. 2017, 83, 206–216. DOI: 10.1016/j.infrared.2017.05.005.
- Yang, G.; Wang, Q.; Liu, C.; Wang, X.; Fan, S.; Huang, W. Rapid and Visual Detection of the Main Chemical Compositions in Maize Seeds Based on Raman Hyperspectral Imaging, Spectrochimica Acta Part A. Mol. Biomol. Spectrosc. 2018, 200, 186–194. DOI: 10.1016/j.saa.2018.04.026.
- Zhang, D.; Xu, L.; Wang, Q.; Xi, T.; Li, J. The Optimal Local Model Selection for Robust and Fast Evaluation of Soluble Solid Content in Melon with Thick Peel and Large Size by Vis-NIR Spectroscopy. Food Anal. Methods. 2018, 12, 1–12.
- Femenias, A.; Gatius, F.; Ramos, A. J.; Sanchis, V.; Marín, S. Use of Hyperspectral Imaging as A Tool for Fusarium and Deoxynivalenol Risk Management in Cereals: A Review. Food Control. 2020, 108, 106819. DOI: 10.1016/j.foodcont.2019.106819.
- Orina, I.; Manley, M.; Williams, P. J. Non-destructive Techniques for the Detection of Fungal Infection in Cereal Grains. Food Res. Int. 2017, 100, 74–86. DOI: 10.1016/j.foodres.2017.07.069.
- Williams, P. J.; Geladi, P.; Britz, T. J.; Manley, M. Investigation of Fungal Development in Maize Kernels Using NIR Hyperspectral Imaging and Multivariate Data Analysis. J. Cereal Sci. 2012, 55(3), 272–278. DOI: 10.1016/j.jcs.2011.12.003.
- Chu, X.; Wang, W.; Ni, X.; Li, C.; Li, Y. Classifying Maize Kernels Naturally Infected by Fungi Using Near-infrared Hyperspectral Imaging. Infrared Phys. Technol. 2020, 105(1), 103242. DOI: 10.1016/j.infrared.2020.103242.
- Karuppiah, K.; Senthilkumar, T.; Jayas, D. S.; White, N. D. G. Detection of Fungal Infection in Five Different Pulses Using Near-infrared Hyperspectral Imaging. J. Stored Prod. Res. 2016, 65, 13–18. DOI: 10.1016/j.jspr.2015.11.005.
- Femenias, A.; Gatius, F.; Ramos, A. J.; Sanchis, V.; Marín, S. Near-infrared Hyperspectral Imaging for Deoxynivalenol and Ergosterol Estimation in Wheat Samples. Food Chem. 2021, 341, 128206. DOI: 10.1016/j.foodchem.2020.128206.
- Kimuli, D.; Wang, W.; Lawrence, K. C.; Yoon, S.-C.; Ni, X.; Heitschmidt, G. W. Utilisation of Visible/near-infrared Hyperspectral Images to Classify Aflatoxin B1 Contaminated Maize Kernels. Biosyst. Eng. 2018, 166, 150–160. DOI: 10.1016/j.biosystemseng.2017.11.018.
- Lu, Y.; Yi, S.; Zeng, N.; Liu, Y.; Zhang, Y. Identification of Rice Diseases Using Deep Convolutional Neural Networks. Neurocomputing. 2017, 267, 378–384. DOI: 10.1016/j.neucom.2017.06.023.
- Kong, W.; Zhang, C.; Cao, F.; Liu, F.; Luo, S.; Tang, Y.; He, Y. Detection of Sclerotinia Stem Rot on Oilseed Rape (Brassica Napus L.) Leaves Using Hyperspectral Imaging. Sensors. 2018, 18(6), 1764. DOI: 10.3390/s18061764.
- Gao, Z.; Shao, Y.; Xuan, G.; Wang, Y.; Liu, Y.; Han, X. Real-time Hyperspectral Imaging for the In-field Estimation of Strawberry Ripeness with Deep Learning. Artif Intell Agric. 2020, 4, 31–38. DOI: 10.1016/j.aiia.2020.04.003.
- Ni, C.; Li, Z.; Zhang, X.; Sun, X.; Huang, Y.; Zhao, L.; Wang, D.; Wang, D. Online Sorting of the Film on Cotton Based on Deep Learning and Hyperspectral Imaging. IEEE Access. 2020, 8, 93028–93038. DOI: 10.1109/ACCESS.2020.2994913.
- Seo, Y.; Kim, G.; Lim, J.; Lee, A.; Kim, B.; Jang, J.; Mo, C.; Kim, M. S. Non-Destructive Detection Pilot Study of Vegetable Organic Residues Using VNIR Hyperspectral Imaging and Deep Learning Techniques. Sensors (Basel). 2021, 21(9), 2899. DOI: 10.3390/s21092899.
- Kamilaris, A.; Prenafeta-Boldú, F. X. Deep Learning in Agriculture: A Survey. Comput. Electron. Agric. 2018, 147(1), 70–90. DOI: 10.1016/j.compag.2018.02.016.
- Altuntaş, Y.; Cömert, Z.; Kocamaz, A. F. Identification of Haploid and Diploid Maize Seeds Using Convolutional Neural Networks and a Transfer Learning Approach. Comput. Electron. Agric. 2019, 163, 104874. DOI: 10.1016/j.compag.2019.104874.
- Fan, Y.; Zhang, C.; Liu, Z.; Qiu, Z.; He, Y. Cost-sensitive Stacked Sparse Auto-encoder Models to Detect Striped Stem Borer Infestation on Rice Based on Hyperspectral Imaging. Knowledge-Based Sys. 2019, 168, 49–58. DOI: 10.1016/j.knosys.2019.01.003.
- Liu, Z.; Jiang, J.; Qiao, X.; Qi, X.; Pan, X. Using Convolution Neural Network and Hyperspectral Image to Identify Moldy Peanut Kernels, LWT. Food Sci. Technol. 2020, 132, 109815.
- A.o.n.f.a.s.r. administration. LS/T 6132-2018 Inspection of Grain and oils-Storage Fungal examination-Enumeration Spores of Fungi, Grain industry standard of the People's Republic of China, 2018.
- Barbin, D.; Elmasry, G.; Sun, D. W.; Allen, P. Near-infrared Hyperspectral Imaging for Grading and Classification of Pork. Meat Sci. 2012, 90(1), 259–268. DOI: 10.1016/j.meatsci.2011.07.011.
- Hinton, G. E.; Jaitly, N. Using an Autoencoder with Deformable Templates to Discover Features for Automated Speech Recognition[c]. Interspeech 2013:Proceedings of the 2013 14th Annual Conference of the International Speech Communication Association. Lyon: CEUR Workshop, 2013, 1737–1740.
- Jiang, B.; He, J.; Yang, S.; Fu, H.; Li, T.; Song, H.; He, D. Fusion of Machine Vision Technology and AlexNet-CNNs Deep Learning Network for the Detection of Postharvest Apple Pesticide Residues. Artif Intell Agric. 2019, 1, 1–8. DOI: 10.1016/j.aiia.2019.02.001.
- Deng, F.; Pu, S.; Chen, X.; Shi, Y.; Yuan, T.; Pu, S. Hyperspectral Image Classification with Capsule Network Using Limited Training Samples. Sensors. 2018, 18(9), 3153. DOI: 10.3390/s18093153.
- Yang, D.; Lu, A.; Ren, D.; Wang, J. Rapid Determination of Biogenic Amines in Cooked Beef Using Hyperspectral Imaging with Sparse Representation Algorithm. Infrared Phys. Technol. 2017, 86, 23–34. DOI: 10.1016/j.infrared.2017.08.013.
- Zhang, L.; Sun, H.; Rao, Z.; Ji, H. Non-destructive Identification of Slightly Sprouted Wheat Kernels Using Hyperspectral Data on Both Sides of Wheat Kernels. Biosyst. Eng. 2020, 200, 188–199. DOI: 10.1016/j.biosystemseng.2020.10.004.
- Huang, K.; Li, S.; Kang, X.; Fang, L. Spectral–Spatial Hyperspectral Image Classification Based on KNN. Sens Imaging. 2016, 17(1), 1–13. DOI: 10.1007/s11220-015-0126-z.
- Lloyd, B. G. R.; Lloyd, G. R. Support Vector Machines for Classification and Regression. Analyst. 2010, 135(2), 230–267. DOI: 10.1039/B918972F.
- Yang, D.; He, D.; Lu, A.; Ren, D.; Wang, J. Detection of the Freshness State of Cooked Beef during Storage Using Hyperspectral Imaging. Appl Spectrosc. 2017, 71(10), 2286–2301. DOI: 10.1177/0003702817718807.
- Parikh, R.; Mathai, A.; Parikh, S.; Sekhar, G. C.; Thomas, R. Understanding and Using Sensitivity, Specificity and Predictive Values. Indian J Ophthalmol. 2008, 56(1), 45–50. DOI: 10.4103/0301-4738.37595.
- Guo, Z.; Wang, M.; Wu, J.; Tao, F.; Chen, Q.; Wang, Q.; Ouyang, Q.; Shi, J.; Zou, X. Quantitative Assessment of Zearalenone in Maize Using Multivariate Algorithms Coupled to Raman Spectroscopy. Food Chem. 2019, 286(JUL.15), 282–288. DOI: 10.1016/j.foodchem.2019.02.020.
- Shen, F.; Zhao, T.; Jiang, X.; Liu, X.; Fang, Y.; Liu, Q.; Hu, Q.; Liu, X. On-line Detection of Toxigenic Fungal Infection in Wheat by Visible/near Infrared Spectroscopy. LWT. 2019, 109, 216–224. DOI: 10.1016/j.lwt.2019.04.019.
- Salas, E.; Henebry, G. M. Separability of Maize and Soybean in the Spectral Regions of Chlorophyll and Carotenoids Using the Moment Distance Index. Israel J. Plant Sci. 2012, 60(1), 65–76. DOI: 10.1560/IJPS.60.1-2.65.
- Wang, W.; Lawrence, K. C.; Ni, X.; Yoon, S.-C.; Heitschmidt, G. W.; Feldner, P. Near-infrared Hyperspectral Imaging for Detecting Aflatoxin B1 of Maize Kernels. Food Control. 2015, 51, 347–355. DOI: 10.1016/j.foodcont.2014.11.047.