
 ?Mathematical formulae have been encoded as MathML and are displayed in this HTML version using MathJax in order to improve their display. Uncheck the box to turn MathJax off. This feature requires Javascript. Click on a formula to zoom.
ABSTRACT
Fish protein hydrolyzates (FPH) are breakdown products of hydrolysis and are gaining importance in the field of nutraceuticals and functional foods due to their bioactive properties, high nutritional value, solubility, and digestibility. This study aimed to evaluate the effect of hydrolysis time (1–5 h) on the functional properties of FPH prepared from ribbon fish by using the alcalase enzyme. Results showed that the enzymatic hydrolysis time affected the protein content, degree of hydrolysis (DH) and properties of protein hydrolyzates. The protein content of hydrolyzates was significantly (P < .05) increased with an increase in time from 1 to 5 h. Similarly, a trend was observed in the case of DH% (P < .05) as well. Enzyme hydrolysis time had substantially changed the secondary structure of the protein that decreased the crystalline structure of protein hydrolyzate as reported in FT-IR results. On the other hand, a significant reduction in the hydrolyzates’ particle size was noticed with increased hydrolysis time. Furthermore, protein hydrolyzates (1–5 h) exhibited an enhanced solubility, oil-holding capacity, ACE-I inhibitory, and DPPH radical scavenging activity. Statistical results showed an inverse correlation between hydrolysis time and particle size (r = – 0.969), while other parameters such as DH% (r = 0.994), OHC (r = 0.984), ACE-I inhibitory (r = 0.948) and DPPH radical scavenging properties (r = 0.928) presented a positive correlation with hydrolysis time. Therefore, the present work reveals that protein hydrolyzates, when subjected to a greater enzymatic hydrolysis time, enhanced certain properties of the hydrolyzate, which may be beneficial for functional food development.
Introduction
All over the world, 401 billion tons of fish are caught yearly. Among which 20–40% is used for the consumption and remaining is used in the food industries to develop the functional foods and protein hydrolyzates, as fish is highly nutritious food to have a role in development and functioning of the heart and brain..[Citation1] It contains nutrients like protein, vitamins, minerals and omega 3 fatty acids, which plays a vital role in the brain’s functioning and other parts of the body. Fish protein contains all the essential amino acids, and it provides a wide range of health benefits such as neurological development, cardiovascular health, reduced risk of autoimmune diseases.[Citation1] Hence, fish is an ideal raw material for the production of nutritionally rich products (protein-rich food products).
Besides the nutritional quality, structural, functional, and bioactive properties of proteins are also crucial for the food products formulation. The significance of these properties depends on the type of raw material and technique used to purify the protein. Since most innate proteins do not exhibit the desirable functionality and bioactivities required to develop functional food products in the food industries, their modification for improving these properties needs to be addressed.[Citation2] Enzyme technology is known to improve the functional properties of dietary protein without affecting its nutritional values[Citation3] by converting it into protein hydrolyzate (polypeptides) with desirable size, charge, and surface properties.[Citation4] Moreover, enzymatic hydrolysis also helps to remove the anti-nutritional factors.[Citation5]
In recent times, fish protein hydrolyzates (FPH) are gained more attention due to their high protein content. FPH can be prepared by different hydrolysis methods, namely acid, alkali, thermal, and enzymatic hydrolysis, to recover proteins from these underutilized fishes and fish by-products. Enzymatic hydrolysis is the most controllable method compared to the other hydrolysis techniques, as it can diminish undesirable reactions and improve the functional properties of proteins. Enzymatic hydrolysis is similar to the natural digestive process, which efficiently breaks down the fish proteins into smaller fragments called peptides. Proteolytic enzymes used to extract fish protein hydrolyzates are flavourzyme, alcalase, neutrase, trypsin, chymotrypsin, pepsin, and papain. Enzymatic hydrolysis is the potential to modify the protein structure to improve the bioactive properties. The properties of enzymatic hydrolysis by-products are influenced by enzyme type and conditions (pH, time, temperature, and enzyme concentration).[Citation6] Alcalase is the most common enzyme used for protein hydrolyzate preparation. Alcalase, an endopeptidase extracted from Bacillus licheniformis, has a broad catalytic activity and cleaves the peptide bonds in the interior of the polypeptide.
Recent studies have reported that enzymatically obtained FPH has good bioactive properties like antioxidant, antihypertensive, antithrombotic, antibacterial, and antiobesogenic activity problems.[Citation7–9] Some other studies reported that proteolytic enzymes release the potent antioxidant and antihypertensive peptides during the different duration of hydrolysis.[Citation10,Citation11] These bioactive peptides are inactive within the parent protein sequence and release during the enzymatic hydrolysis of proteins.[Citation12,Citation13]
The rate of enzymatic hydrolysis of protein is measured in terms of the degree of hydrolysis (DH). DH is an impotent parameter in determining protein hydrolyzate preparation’s functional and bioactivity properties.[Citation14] Xu et al.[Citation6] reported that DH affects the solubility, size, structure, and functional properties of protein hydrolyzates. These authors also explained the different DH% effects on the antioxidant properties. Tang et al.[Citation15] reported higher DH% and was dominated by a low molecular weight peptide. Some other reports are mentioned that low molecular weight peptides (<3 kDa) showed higher ACE-I inhibitory and DPPH radical scavenging activity than high molecular weight peptides (>10 kDa).[Citation7,Citation8,Citation13] Hydrolysis time positively affects the nutritional and antioxidant properties but shows negative effect on functional properties.[Citation6] Therefore, the study’s objective is to investigate the effect of hydrolysis time on structural, functional, and bioactive properties of ribbon fish protein hydrolyzates and understand the relationship between the hydrolysis time and properties of the hydrolyzates extracted by different time (1–5 h) intervals.
Materials and methods
Materials
Ribbon fish (Lepturacanthus savala), was purchased from the local market in Mangalore, Karnataka, India, and was immediately dissected for separation of visceral waste. The collected visceral sample was homogenated separately and stored at −20°C for further analysis. Enzymes used for hydrolysis, namely Alcalase EC.3.4.21.14 (Bacillus licheniformis ≥2.4 U/g). 2, 2-diphenyl-1-picrylhydrazyl (DPPH), 3-(2-pyridyl)-5, 6-bis (4-phenyl-sulfonic acid)-1, 2, 4-triazine (ferrozine), and rabbit lung ACE (1 U/mL) were used for in vitro antioxidant and ACE inhibitory activity analyses. Captopril, hippuryl-L-histidyl-leucine (HHL) substrate, acetonitrile, trifluoroacetic acid (TFA) and other chemicals were purchased from Sigma-Aldrich, Steinheim, Germany.
Preparation of fish protein hydrolyzate
Protein hydrolyzate was prepared according to the method described by Azizi Khesal et al.[Citation16] with slight modifications. A 50 g of minced viscera was heated at 90°C for 20 min on a boiling water bath to inactivate the endogenous enzyme and microbes. The samples were mixed with an equal volume of water (1:1 w/v). Enzymatic hydrolysis was carried out for 1–5 h with a 1- time interval at 1.5% (w/v) level of enzyme concentration under the optimal temperature and pH conditions based on the enzyme activity (alcalase – pH 8.5 at 50°C). At the end of every hour of hydrolysis, the enzyme was inactivated at 90°C for 20 min, followed by cooling and centrifugation at 10,000 rpm (20 min at 4°C). The supernatant was checked for the protein content and DH%. The remaining is lyophilized and stored at −20°C for further analysis.
Degree of hydrolysis (DH)
The DH was analyzed by the method of Azizi Khesal et al.[Citation16] with slight modifications. At the end of the hydrolysis time, the reaction was terminated using 10% trichloroacetic acid (TCA) and then centrifuged to collect the 10% TCA soluble material from the supernatant for analysis nitrogen content (N) by the Kjeldahl method. The DH% was calculated using the following equation:.
DH% = (10% TCA soluble N in sample/Total N in the sample) × 100
Particle size distribution
Particle size distribution was estimated by master sizer (Mastersizer 3000, Malvern Instruments Ltd., UK) laser particle method followed by da Rosa Zavareze et al.[Citation17] Briefly, 1–5 h hydrolyzates sample was dispersed in soybean oil and then delivered to the Mastersizer 3000 optical unit using Aero dispersion units and a vacuum extraction system. Results were analyzed with Mastersizer 3000 software.
Fourier transform infrared spectroscopy (FT-IR)
The FT-IR analysis of hydrolyzate samples was performed using an earlier method.[Citation6] Briefly, 10 mg of the samples were mixed with a pinch of potassium bromide (using a mortar) to a fine powder and pressed (5000–10000 psi) to obtain transparent pellets. The pellets were placed on the crystal of the FT-IR spectrometer (Bruker Optik GmBH, Germany), and the spectra were recorded. The spectra were analyzed for different functional groups in the region between 4000 and 400 cm−1 wavenumbers.
Solubility
The solubility of hydrolyzate samples was estimated at different pH ranges (2, 4, 6, 8,10, and 12). A 200 mg sample was dissolved in 10 mL of distilled water. The pH was adjusted using 1 N HCl and 1 N NaOH. The mixture was stirred continuously at 37°C for 30 min and then centrifuged at 8000 rpm for 10 min. The content of soluble proteins in the supernatant was estimated after solubilization of the sample in 0.5 M NaOH by the Kjeldahl method. The solubility of the samples was calculated using the following equation.
Solubility (%) = (Protein content in supernatant/Total protein content in the sample) × 100
Oil-holding capacity
The oil-holding capacity (OHC) of the hydrolyzate samples was analyzed using the Leni et al.[Citation18] method with slight modification. Briefly, 1 g of hydrolyzate sample taken in the 50 mL of falcon tube and add 10 g of corn oil. The solution was mixed by using a shaking incubator for 5 min at 60 rpm. After 30 min, the mixture was centrifuged at 2000 g for 30 min at 20°C. The sample was re-weighed after 10 min of decantation upside-down (45° angle), and OHC was calculated using the following equation:
OHC (g Oil/g of the sample) = W2 – W1/W0
W0; Weight of the sample (g), W1; Weight of the sample with falcon tube, W2; weight of sample after decantation.
ACE-I inhibitory activity
ACE-I inhibitory assay: The ACE-I inhibitory activity of hydrolyzate samples was measured using the method of Chen et al.[Citation19] with slight modification. A 30 µL of 5 mM HHL solution was mixed with 20 µL of hydrolyzate samples at the concentration of 40 µg/mL. Captopril was used as standard. Samples were incubated for 5 min at 37°C. Twenty microliters of ACE (0.1 U/mL) was added and incubated at 37°C for 60 min. The reaction was stopped by adding 100 µL of 1 N HCL. The control was prepared by replacing the standard or sample with borate buffer.
Determination of ACE-I inhibitory activity by RP-HPLC: ACE-I inhibitory activity was performed by using Waters RP-HPLC system (Model-1525 photodiode array detector 2998, USA). All the samples were filtered using a 0.45-µM nylon syringe filter prior to injection and quantified using a C18 column (4.6 × 150 mm, 5 µM) in a mobile phase containing 70% acetonitrile containing 0.005% TFA at the flow rate of 0.5 mL/min. Both HA and HHL were detected at 228 nm. However, the peak area of HA was used to quantify ACE inhibition. The degree of ACE-I inhibition was calculated as percentage inhibition by using the following equation.
ACE-I inhibition (%) = [1- (A inhibitor/A control)] × 100
where A is peak area of HA.
Determination of IC50 value: The IC50 value is referred to as a concentration of standard or hydrolyzate samples capable of inhibiting 50% of the ACE activity. Different concentrations of captopril (0.10, 0.20, 0.30, 0.40, and 0.50 µg/mL) and hydrolyzate samples (2, 4, 6, 8, 10, and 12 µg/mL) were prepared in 50 mM borate buffer to test their percentage of ACE inhibitory activity by RP-HPLC. The linear regression was performed for inhibitor concentration and inhibition percentage. The obtained linear correlation was used to calculate the concentration corresponding to 50% inhibition, i.e., the IC50 value.
DPPH-radical scavenging activity
Sample preparation: Methanol is used to dissolve DPPH and standard antioxidants. Methanolic solutions of the hydrolyzate samples were prepared using 70% methanol. A 200 µL of different concentrations of standard antioxidant or hydrolyzate samples were added to 100 µL of 1 mM DPPH solution. The mixture was vortex for few seconds, and then incubated for 20 min at 37°C in the dark.
HPLC analysis: Antioxidant activity was performed by using Waters RP-HPLC system (Model-1525 separation module and model 2998, photodiode array detector).[Citation20] All the samples were filtered by using a 0.20-µM nylon syringe filter prior to injection. The samples were quantified using a C18 column (4.6 × 150 mm, 5 µM) in a mobile phase containing 80:20% acetonitrile: the flow rate of distilled water was adjusted to 1 mL/min. The DPPH peaks were monitored at 517 nm and the percentage of the radical scavenging activity was determined using the difference in the reduction of DPPH peak area (PA) between the control and the sample. The control was prepared by adding 100 µL of methanol to 100 µL of DPPH stock solution
whre PA is the peak area of DPPH.
Determination of IC50 value: Different concentrations of ascorbic acid (20, 40, 60, 80 and 100 µg/mL) and hydrolyzate samples (200, 400, 600, 800, 1000, and 1200 µg/mL) were prepared in methanol to test their percentage of DPPH radical activity by RP-HPLC. The linear regression was performed for inhibitor concentration and inhibition percentage. The obtained linear correlation was used to calculate the concentration corresponding to 50% inhibition, i.e., the IC50 value.
Statistical analysis
Statistical analysis was done by one-way ANOVA, and Duncan’s multiple range test was used to calculate the significant difference (P < .05) among the parameters. An IC50 value was calculated by linear regression using the Microsoft Excel version 2003. The covariance relationships between hydrolysis time and properties was evaluated by Pearson’s correlation coefficient (r).
Result and discussion
The effect of hydrolysis time (1, 2, 3, 4, and 5 h) on the protein content at 1.5% enzyme concentration is shown in . The result indicates that increasing the hydrolysis time from 1 to 5 h increased the protein content in the samples. The protein content of the hydrolyzates samples was significantly increased from 1 to 5 h of enzymatic treatment. At the end of alcalase, hydrolysis (5 h) resulted in 84.62% hydrolyzate protein content. However, the increase in protein content registered from the fourth to fifth hour is not significant. The first hours of (1–3 h) enzymatic hydrolysis presented a considerable increase in protein content while rate subsequently decreased, similar to the typical hydrolysis curve reported in earlier studies.[Citation21,Citation22] The time required to release protein tends to have an initial rapid phase during the 1 h, followed by a slow increase after hydrolyzed core protein. The decrease in the rate was due to the decreases in substrate concentration. Increasing the time above 4 h did not cause any significant increase in the protein content.
Figure 1. Protein content (a) and DH% (b) of hydrolyzate extracted in different time intervals (1–5 h). The values are mean ± SD from triplicate determinations (n = 3) and significant difference (P < .05).
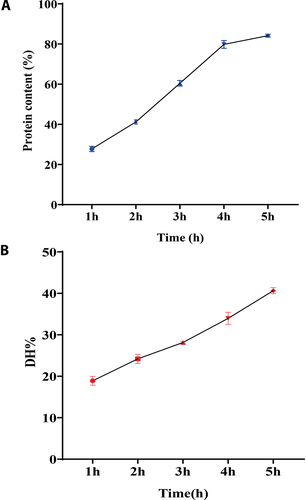
DH% was carried out in hydrolyzates to find out the peptide concentration. The extent of protein degradation by proteolytic enzymes was measured by the degree of hydrolysis. The DH% is the widely used technique for comparing different protein hydrolyzates. The results reveal that hydrolyzates showed an increasing trend in DH% value from 18.98% to 41.15%, respectively, with hydrolysis time (1–5 h) (). It is clear from the results that enzymatic hydrolysis time is directly proportional to the DH%.
Further, statistical analysis confirmed a positive correlation between DH% and enzymatic hydrolysis time (r = 0.994) (). A similar study was reported in the literature,[Citation6] where an absolute positive correlation (r = 1.000) was observed between enzymatic hydrolysis time and DH%. Alkaline proteases like alcalase have been reported to exhibit higher activity than acid proteases or neutral proteases, such as pepsin or papain.[Citation21] Moreover, higher DH% in alcalase extracted samples could increase bioactivity due to the breakdown of peptides.[Citation23] Therefore, hydrolysis of protein at different time intervals is the key to its bioactivity. According to Rivero-Pino et al.,[Citation24] protein hydrolyzates with DH% higher than 10% could be applied as ingredients in nutritional supplements and medical diets. The study was supported by Bhaskar et al.,[Citation25] where alcalase was used to optimize the preparation of protein hydrolyzates from the fish waste of Catla fish (Catla catla) by the RSM method. The authors have stated that alcalase exhibit higher proteolytic activity than acid proteases or neutral proteases. Bao et al.[Citation26] also reported that the alcalase enzyme showed a higher DH% value than the neutrase flavourzyme. In addition, the authors demonstrated that bioactive and functional properties are affected by the molecular weight distribution due to the higher DH% value.
Table 1. Correlation between enzymatic hydrolysis time and properties of hydrolyzates
Particle size distribution
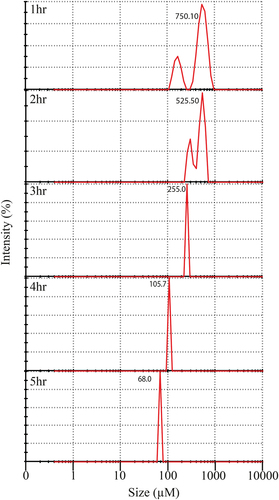
The particle size distribution of fish protein hydrolyzates extracted from different time intervals (1–5 h) is shown in . The particle size of the protein hydrolyzates obtained after 1–2 h of enzymatic hydrolysis showed bimodal distribution ranging from 100 µM to 1000 µM with average sizes 750.1 and 525.5 µM, respectively. In contrast, enzymatic hydrolysis beyond 2 h presented a unimodal distribution with a particle size ranging between 255.0 and 68.06 µM. The result of the study showed that hydrolysis time affects the morphological structure of hydrolyzates. Moreover, a negative correlation (r = −0.969) () was observed between the particles size and hydrolysis time. Similar results were reported by Xu et al.,[Citation6] in chickpea where hydrolysis time positively influenced the DH%, functional (r = 0.881) and antioxidant property (r = 0.951) while inversely affected (r = −0.940) the structural properties. This rise may be due to the structural modification of protein and removal of the non-protein molecule from the protein moiety. The proportion of the coarse particles of protein hydrolyzate becomes smaller due to increased hydrolysis time. Bao et al.[Citation26] demonstrated an inverse relation between hydrolysis time and particle size of the protein hydrolyzates. In addition, results showed that alcalase treatment produced hydrolyzate with low particle size (10–20 µM), which may be ascribed to its higher degree of hydrolysis. In the same study, Bao et al.[Citation26] also observed a single distinct peak in milk protein isolate due to the less dispersibility. The authors observed decreased powder dispersibility due to an increased percentage of fine particles (<90 μm).[Citation14,Citation27] Kurozawa et al.[Citation28] reported that crude chicken protein hydrolyzate powder exhibited the bimodal size distribution after 1 h enzymatic hydrolysis. Further, he described that the size distribution of purified protein did not contain two distinct peaks. Sridharan et al.[Citation29] studied the particle size distribution of purified pea powder (98% purified protein content) and showed a single distinct peak at the 100 µM range. Dehkordi et al.[Citation30] reported an average size distribution of the purified fish protein isolate in the range of 10–100 µM. Therefore, the current study results reveal that the decrease in the particle size of the hydrolyzates increases the hydrolysis time with increasing in DH%.
Figure 2. Particle size distribution of hydrolyzates extracted in different time intervals (1–5 h).
Fourier transform infrared spectroscopy (FT-IR) analysis
FT-IR analysis of hydrolyzate samples (1–5 h) was ranged from 400 to 4000 cm-1 wavenumbers (). This study is based on the previously published FT-IR analysis of protein and peptides.[Citation6] Some of the brands have been shown to be essential for monitoring the proteolytic reactions. These include I amid bands (~1700–1600 cm−1) and II (~1590–1520 cm−1), the N-terminal (NH3+, ~1510 cm−1) and the C-terminal (COO−, ~1400 cm−1), but changes can also be observed in other FT-IR graphs.
Figure 3. FT-IR analysis of hydrolyzates extracted in different time intervals (1–5 h).
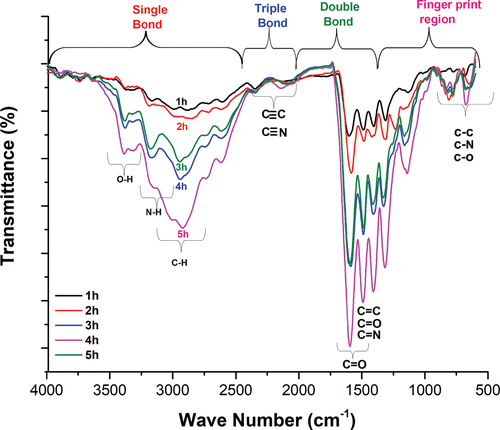
In the present study, hydrolyzates (1–5 h) showed bands at the fingerprint region (500–1000 cm−1), which were formed due to the bending of C-N, C-H, C-C and C-O. A similar study was reported by Xu et al.[Citation6] FT-IR spectrum varied in all the hydrolyzates (1–5 h), which may be due to the hydrolysis time and degree of the hydrolysis. When comparing the spectrum of hydrolyzates (1–5 h), the most dominant peaks were observed in 3–5 h hydrolyzates at 1000–1700 cm−1 wavenumber region. The peak was observed at 1600 cm-1 due to the presence of C = O stretching vibrations. Similar results were observed by Elavarasan et al.,[Citation31] where the peak at 1630 cm-1 was mainly due to imide residue/-OH bonding with water molecules. However, the value 1645 cm−1 reflects the typical random coil state corresponding to the amine residue. He also reported that hydrolyzate extracted by enzymatic hydrolysis exhibited bands between 1638 and 1655 cm−1, and it is indicating the β-pleated sheet and secondary structure of the protein. The β-sheets are characteristic of interruption of the native structure of protein during enzymatic hydrolysis.
Furthermore, the current study showed that α-helix and β-sheet accounted for all the hydrolyzate samples (1–5 h). After 3 h hydrolysis (3–5 h hydrolyzates) formed extended peaks at 1643–1645 cm−1 is due to an increase in enzymatic hydrolysis. This affects the structure of protein hydrolyzate by changing α-helix and β sheets into β turns and random coiling, indicating smaller peptides. The II amide bands are the main component of hydrolyzates indicated by peaks at wavenumber raging between 1500 and 1600 cm−1 wave number.[Citation31] Therefore, in our study, these II amide bands are dominated in 3–5 h hydrolyzate samples. These amide bands are corresponding to the C-N stretching vibration of the primary amide group. A similar study has shown that II amide bands are associated with N-H bending and C-N stretching vibration in the range of 1480–1575 cm−1 wave number.[Citation31] In addition, 3–5 h hydrolyzates are also dominating in the 2500–3000 cm−1 wavenumber region. These peaks are arising mainly due to the N-H and C-H stretching.
Similarly, peak expressed in the range of 3000–3300 cm−1 wave number due to OH group is hydrogen bonded with other functional groups and not in the free form. The overall FT-IR analysis of the hydrolyzate samples reveal that post 3 h hydrolyzed samples clearly showed the formation of the smaller peptides. Therefore, the current study evidently indicates that protein hydrolyzate structure was mainly affected by the hydrolysis time.
Solubility
The solubility of hydrolyzate samples (1–5 h) at different pH ranging from 2 to 12 is depicted in . The pH presented a significant effect on the solubility of hydrolyzate samples. A higher solubility was observed at a pH range of 6–8 and a minimum at a pH 4. The results showed that 4 and 5 h hydrolyzate samples have higher solubility at pH 6 (80.77% and 82.74%) and 8 (82.35% and 81.55%) than their counterparts. Thus, results reveal that increasing the hydrolysis time and DH% affects the solubility of the protein and further showed a positive correlation between them (). Xu et al.[Citation6] reported that DH% affects the solubility size, stricture and functional properties of protein hydrolyzates. Another study reported by Fan et al.[Citation32] was enhanced higher solubility of the hydrolyzates, which could form a smaller peptide with more hydrophilic nature than the intact protein. Naqash et al.[Citation33] reported excellent solubility of protein hydrolyzate at higher DH%. Other authors also have reported the high solubility of fish protein hydrolyzates at different DH% over a wide range of pH.[Citation16,Citation34] In the current study, all the hydrolyzate extracts showed low solubility at pH 4. Tang et al.[Citation15] supported this result, who demonstrated that the effect of lower solubility of the partially hydrolyzed protein at a pH range of 3–4 could be due to a shift in the isoelectric point (pI).
Figure 4. Solubility (a) and OHC (b) of hydrolyzates extracted in different time intervals (1–5 h). The values are mean ± SD from triplicate determinations (n = 3) and significant difference (P < .05).
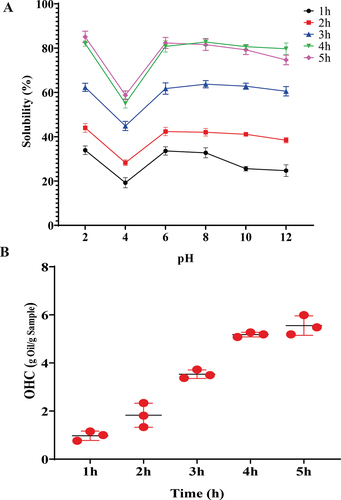
Similarly, the solubility of protein hydrolyzate from pink perch (Nemipterus japonicus) muscle showed a relatively low solubility at pH 4.[Citation33] The author also reported that the charge in the weakly acidic and basic side chain groups is affected by pH, and hydrolyzates have poor solubility at their isoelectric points. The net charge of free peptides increases as pH moves away from pI, and surface hydrophobicity promotes aggregation through hydrophobic interaction. This may be responsible for variations in solubility. Therefore, the study reveals that hydrolysis time with higher DH% affects protein solubility. The higher solubility of protein hydrolyzate over a wide range of pH will have many applications in the food formulation industries.
Oil-holding capacity
The oil-holding capacity (OHC) of all the hydrolyzate samples were correlated with enzymatic hydrolysis time (1–5 h) showed in . The lowest OHC value was observed in 1 h hydrolyzate sample (0.972 g/g). After increasing the enzymatic hydrolysis time from 2 to 5 h, the OHC of hydrolyzates gradually increased, ranging between 1.826 and 5.583 g/g. This result is on par with the results registered for hydrolyzate of lesser mealworm where OHC of the hydrolyzate extracted by 30 min enzymatic hydrolysis was substantially lower (1.4 g/g) than the sample produced 300 min of enzymatic hydrolysis (6.8 g/g). According to the authors, a possible reason could be modifying the protein structure and exposure of hydrophobic amino acids. Hydrolysis modifies protein folding, promoting the physical entrapment of oil.[Citation18] Purschke et al.[Citation35] noticed a positive correlation (r = 0.984) between OHC of all the hydrolyzate samples and enzymatic hydrolysis time. The study revealed that hydrolysis time is the critical factor for OHC of the hydrolyzate.
ACE-1 inhibitory activity
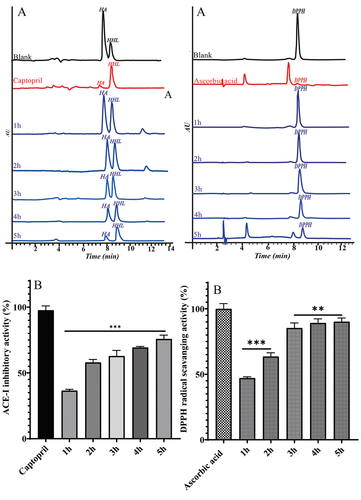
ACE-I inhibitory activity of captopril and hydrolyzates (1–5 h) are represented in the chromatogram (1). The substrate HHL hydrolyzed by ACE (in 0.1 N HCL) results in HA. The overestimated peak area of HA indicates an overestimation of ACE activity. 1 shows the peak area of HA affected by captopril and hydrolyzates (1–5 h) samples, respectively. The first peak is controlled (without inhibitors). The study showed a 5 h hydrolyzate sample with a higher ACE-I inhibitory activity of 75.74% compared to 1, 2, 3, and 4 h hydrolyzate samples (36.50%, 57.92%, 62.79%, and 69.30%) (1). IC50 values of the samples (1–5 h) are calculated as 12.28, 8.91, 7.28, 6.16, and 5.91 µg/mL, respectively. However, captopril showed IC50 values of 0.214 µg/mL (). The present study results showed an increase in the ACE-I inhibitory activity with an increase in hydrolysis time. This could be due to the increase in DH%. Jamdar et al.[Citation22] reported that protein hydrolyzates were prepared from peanuts in different degree of hydrolysis (10%, 20%, 30%, and 40%) by using the alcalase enzyme. This study higher DH% (40%) was achieved at 7th h and showed higher ACE-I inhibitory activity than other samples. Finally, author concluded that the inhibition capacity increased with an increase in hydrolysis time due to higher DH%. Increasing the hydrolysis time to increase DH% produced small molecular weight peptides (<3kDa).[Citation7] Other researchers also reported that small molecular weight peptides showed higher ACE-I inhibitory activity.[Citation36,Citation37] A similar study was reported by Dewi et al.,[Citation38] where protein hydrolyzate was extracted from sea cucumber by an alcalase enzyme. Further, he explained that hydrolyzate was fractionated by using different molecular weight cutoff membranes (3, 5, and 10 kDa) for ACE-I inhibitory activity, in which the 3 kDa fraction showed the highest ACE-I inhibitory activity. de Oliveira Filho et al.[Citation39] reported that alcalase extracted hydrolyzate showed a higher ACE inhibitory activity than flavourzyme and papain. The author discussed this due to the higher DH% and was dominated by a small molecular size fraction (189–686 Da). Other reports also mentioned that low molecular weight peptides (<3 kDa) showed higher ACE-I inhibitory activity than high molecular weight peptides (>10 kDa).[Citation7,Citation40] On the other hand, Zhao et al.[Citation41] reported that different DH% also affected the morphological structure of the hydrolyzate. They explained, changes in morphological characters affect the functional and bioactive properties of soybean protein hydrolyzate. Increased ACE-I inhibitory activity depends on the physicochemical properties of the hydrolyzates.[Citation41] Proteins from any food sources do not only serve as nutrients but also perform physiochemical roles that promote health. Most of the physiological activities of proteins are performed by peptide sequences encrypted in the parent protein, which become active when cleaved intact.[Citation1,Citation7] Bioactive peptides are released during enzymatic proteolysis (gastrointestinal digestion, in vitro hydrolysis using proteolytic enzymes) of proteins and also during food processing (cooking, fermentation, ripening). Bioactive peptides are known for their ability to inhibit protein–protein interactions due to their small size and specificity.[Citation7] Therefore, particle size analysis of the present study revealed that increasing the hydrolysis time (1–5 h) reduced the particle size of the hydrolyzates. This could be the reason 5 h samples showed higher ACE-I inhibitory activity. In addition to this, some others also reported that smaller molecular weight peptides (<3 kDa) had better access to active site of ACE.[Citation27,Citation37] Therefore, this study reveals that ACE-I inhibitory activity mainly depends on the enzyme type, hydrolysis time, and DH%. The current study followed person’s correlation analysis, where the samples showed positive correlation (r = 0.899) () between hydrolysis time with ACE-I inhibitory activity.
Table 2. IC50 value of ACE-I inhibitory and antioxidant activity of hydrolyzate samples
Figure 5. HPLC chromatograms represent the HA and DPPH peaks were affected by standard and hydrolyzates (1–5 h) samples (a1 and a2) and ACE-I and DPPH radical scavenging activity of standard and hydrolyzates samples (b1 and b2). Values are mean ± SD from triplicate determinations (n = 3) and significant differences (P < .01; P < .001).
DPPH radical scavenging activity
Ascorbic acid and hydrolyzate (1–5 h) samples were effects the peak area of the DPPH, as shown in 2. In the present analysis, 3, 4, and 5 h hydrolyzate samples were shown to have higher levels of DPPH radical scavenging activity (85.33%, 89.16%, and 90.14%) compare to the 1 and 2 h hydrolyzed samples (47.063, and 63.54%) (2). The IC50 values of the hydrolyzate samples (1–5 h) are calculated as 938, 625, 411, 386, and 308 µg/mL, respectively. However, ascorbic acid used as standard (IC50 = 68.386 µg/mL) (). The current study showed DPPH radical scavenging activity increases (47 to 85%) in 1 to 3 h hydrolyzate sample where DH% is 19 to 28%. Further, increasing the time (3–5 h) with DH% from 28% to 41% showed no significant increase in radical scavenging activity. Jamdar et al.[Citation22] supported this study by mentioning that the protein hydrolyzates were prepared from peanuts with different DH% (10, 20, 30, 40%). As the DH% increased from 10% to 20%, the radical-scavenging activity increased from 21 to 51% at a 2.0 mg/ml concentration. However, further increase in the DH%, from 20 to 40%, showed no significant increase in the activity. López-Pedrouso et al.[Citation42] reported that, increase in the DPPH radical-scavenging activity with an increase in DH% for porcine collagen hydrolyzate. Another study reported by Klompong et al.[Citation21] showed DPPH radical scavenging activity of yellow stripe trevalley protein hydrolyzate decreased due to increased DH%. Therefore, enzymatically obtained fish protein hydrolyzate is reported to have good antioxidant properties. The antioxidant activity of protein hydrolyzates depends on the type of protease used and the condition of the hydrolysis employed. A variety of smaller peptides and free amino acids are generated during hydrolysis processes, depending on enzyme specificity. Other studies showed that changes in size, level and composition of small peptides affect antioxidant activity.[Citation43,Citation44] This assay (DPPH) is considered to be both the H-atom transfer reaction and electron transfer reaction.[Citation45] Reports of the present study confirms that protein hydrolyzates (3–5 h duration) would eliminate fre radiclas. Further, free radicle scavenging potential was found to be substantially higher for the samples with higher degree of hydrolysis which may be ascribed to its low molecular weight peptide formation.[Citation46,Citation47] Nevertheless, there are no clear scientific relation between molecular weight and antioxidant potential. The antioxidant properties of protein hydrolyzates primarily depends on their amino acid sequence and type of proteases and hydrolysis conditions used. Therefore, results are suggested that the 3–5 h hydrolysis time require to release the good antioxidant peptides, which could scavenge the free radicals and are used as natural antioxidants. The person’s correlation reveals that enzymatic hydrolysis time showed positive effects (r = 0.862) on the DPPH radical scavenging activity ().
Conclusion
This study reveals that protein hydrolyzates extracted from ribbon fish using alcalase in different time intervals (1–5 h) were significantly affected by the hydrolysis time in terms of positively altering the protein structure and size, thereby enhancing the functional and bioactive properties further retaining its nutritional value. Moreover, hydrolysis time had a considerable impact on the size and structure of protein and on functional properties such as oil-holding capacity, solubility, and bioactive properties (ACE-I inhibitory and DPPH radical scavenging activity). Thus, to obtain appropriate protein hydrolyzates with functional and bioactivity properties, controlled hydrolysis is necessary. On the other hand, it is revealing that changes in results of correlation analysis present information on the relationship between dependent and independent variables. Therefore, the findings of this study suggest a possible use of fish bioactive peptides to prepare protein-rich supplements or as an ingredient for a formulation of functional food.
Acknowledgments
The authors are grateful to the Department of Science and Technology (DST) – Scientific Engineering Research Board (SERB), New Delhi, India, for financial support through the project [No-YSS/2015/001301]. The authors extend their thanks to Prof. Dr Anirban Chakraborty, the Director, Nitte University Centre for Science Education and Research (NUCSER), for his constant support.
Disclosure statement
No potential conflict of interest was reported by the author(s).
Additional information
Funding
References
- Tiwari, A.; Melchor-Martínez, E. M.; Saxena, A.; Kapoor, N.; Singh, K. J.; Saldarriaga-Hernández, S.; Parra-Saldívar, R.; Iqbal, H. M. N. Therapeutic Attributes and Applied Aspects of Biological Macromolecules (Polypeptides, Fucoxanthin, Sterols, Fatty Acids, Polysaccharides, and Polyphenols) from Diatoms — A Review. Int. J. Biol. Macromol. 2021, 171, 398–413. DOI: 10.1016/j.ijbiomac.2020.12.219.
- Lafarga, T.; Hayes, M. Bioactive Protein Hydrolysates in the Functional Food Ingredient Industry: Overcoming Current Challenges. Food Rev. Int. 2017, 33, 217–246. DOI: 10.1080/87559129.2016.1175013.
- Ucak, I.; Afreen, M.; Montesano, D.; Carrillo, C.; Tomasevic, I.; Simal-Gandara, J.; Barba, F. J. Functional and Bioactive Properties of Peptides Derived from Marine Side Streams. Mar. Drugs. 2021, 19, 71. DOI: 10.3390/md19020071.
- Dey, P.; Kadharbasha, S.; Bajaj, M.; Das, J.; Chakraborty, T.; Bhat, C.; Banerjee, P. Contribution of Quasifibrillar Properties of Collagen Hydrolysates Towards Lowering of Interface Tension in Emulsion-Based Food Leading to Shelf-Life Enhancement. Food Bioprocess Technol. 2021, 1–21. DOI: 10.1007/s11947-021-02640-z.
- Kowalczewski, P. Ł.; Olejnik, A.; Rybicka, I.; Zielińska-Dawidziak, M.; Białas, W.; Lewandowicz, G. Membrane Filtration-Assisted Enzymatic Hydrolysis Affects the Biological Activity of Potato Juice. Molecules. 2021, 26, 852. DOI: 10.3390/molecules26040852.
- Xu, Y.; Galanopoulos, M.; Sismour, E.; Ren, S.; Mersha, Z.; Lynch, P.; Almutaimi, A. Effect of Enzymatic Hydrolysis Using Endo- and Exo-proteases on Secondary Structure, Functional, and Antioxidant Properties of Chickpea Protein Hydrolysates. J. Food Meas. Charact. 2020, 14, 343–352. DOI: 10.1007/s11694-019-00296-0.
- Yathisha, U. G.; Bhat, I.; Karunasagar, I.; Mamatha, B. S. Antihypertensive Activity of Fish Protein Hydrolysates and Its Peptides. Crit Rev. Food Sci. Nutr. 2019, 59, 2363–2374. DOI: 10.1080/10408398.2018.1452182.
- Hemker, A. K.; Nguyen, L. T.; Karwe, M.; Salvi, D. Effects of Pressure-assisted Enzymatic Hydrolysis on Functional and Bioactive Properties of Tilapia (Oreochromis niloticus) By-product Protein Hydrolysates. LWT. 2020, 122, 109003. DOI: 10.1016/j.lwt.2019.109003.
- Kaur, A.; Kehinde, B. A.; Sharma, P.; Sharma, D.; Kaur, S. Recently Isolated Food-derived Antihypertensive Hydrolysates and Peptides: A Review. Food Chem. 2021, 346, 128719. DOI: 10.1016/j.foodchem.2020.128719.
- Noorani, K. P. M.; Nazeer, R. A. Enzymatic Production of Two Tri-peptides on ACE-I Inhibition and Antioxidant Activities. Int. J. Pept. Res. Ther. 2020, 26, 2365–2377. DOI: 10.1007/s10989-020-10037-3.
- Osman, A.; El-Hadary, A.; Korish, A. A.; AlNafea, H. M.; Alhakbany, M. A.; Awad, A. A.; Abdel-Hamid, M. Enzymatic Production of Two Tri-peptides on ACE-I Inhibition and Antioxidant Activities. Foods. 2021, 10, 1–11. DOI: 10.3390/foods10020468.
- Mann, B.; Athira, S.; Sharma, R.; Kumar, R.; Sarkar, P. Bioactive Peptides from Whey Proteins. In Whey Proteins from Milk to Med; Elsevier, 2018; pp 519–547. DOI: 10.1016/B978-0-12-812124-5.00015-1.
- Daroit, D. J.; Brandelli, A. In Vivo Bioactivities of Food Protein-derived Peptides – A Current Review. Curr. Opin. Food Sci. 2021, 39, 120–129. DOI: 10.1016/j.cofs.2021.01.002.
- Kumar, D.; Mishra, A.; Tarafdar, A.; Kumar, Y.; Verma, K.; Aluko, R.; Trajkovska, B.; Badgujar, P. C. In Vitro Bioaccessibility and Characterisation of Spent Hen Meat Hydrolysate Powder Prepared by Spray and Freeze-drying Techniques. Process Biochem. 2021, 105, 128–136. DOI: 10.1016/j.procbio.2021.03.029.
- Tang, S.; Zhou, X.; Gouda, M.; Cai, Z.; Jin, Y. Effect of Enzymatic Hydrolysis on the Solubility of Egg Yolk Powder from the Changes in Structure and Functional Properties. LWT. 2019, 110, 214–222. DOI: 10.1016/j.lwt.2019.04.070.
- Azizi Khesal, M.; Sharifan, A.; Hoseini, E.; Ghavami, A. Optimization of Enzymatic Hydrolysis Conditions of Caspian Kutum (Rutilus Frisii Kutum)ˮ By-product for Production of Bioactive Peptides with Antioxidative Properties. Int. J. Pept. Res. Ther. 2020, 26, 1829–1838. DOI: 10.1007/s10989-019-09981-6.
- Da Rosa Zavareze, E.; Telles, A. C.; Mello El Halal, S. L.; Da Rocha, M.; Colussi, R.; Marques de Assis, L.; Suita de Castro, L. A.; Guerra Dias, A. R.; Prentice-Hernández, C. Production and Characterization of Encapsulated Antioxidative Protein Hydrolysates from Whitemouth Croaker (Micropogonias furnieri) Muscle and Byproduct. LWT - Food Sci. Technol. 2014, 59, 841–848. DOI: 10.1016/j.lwt.2014.05.013.
- Leni, G.; Soetemans, L.; Caligiani, A.; Sforza, S.; Bastiaens, L. Degree of Hydrolysis Affects the Techno-functional Properties of Lesser Mealworm Protein Hydrolysates. Foods. 2020, 9, 381. DOI: 10.3390/foods9040381.
- Chen, J.; Wang, Y.; Ye, R.; Wua, Y.; Xia, W. Comparison of Analytical Methods to Assay Inhibitors of Angiotensin I-converting Enzyme. Food Chem. 2013, 141, 3329–3334. DOI: 10.1016/j.foodchem.2013.06.048.
- Chandrasekar, D.; Madhusudhana, K.; Ramakrishna, S.; Diwan, P. V. Determination of DPPH Free Radical Scavenging Activity by Reversed-phase HPLC: A Sensitive Screening Method for Polyherbal Formulations. J. Pharm. Biomed. Anal. 2006, 40, 460–464. DOI: 10.1016/j.jpba.2005.07.042.
- Klompong, V.; Benjakul, S.; Kantachote, D.; Shahidi, F. Antioxidative Activity and Functional Properties of Protein Hydrolysate of Yellow Stripe Trevally (Selaroides Leptolepis) as Influenced by the Degree of Hydrolysis and Enzyme Type. Food Chem. 2007, 102, 1317–1327. DOI: 10.1016/j.foodchem.2006.07.016.
- Jamdar, S. N.; Rajalakshmi, V.; Pednekar, M. D.; Juan, F.; Yardi, V.; Sharma, A. Influence of Degree of Hydrolysis on Functional Properties, Antioxidant Activity and ACE Inhibitory Activity of Peanut Protein Hydrolysate. Food Chem. 2010, 121, 178–184. DOI: 10.1016/j.foodchem.2009.12.027.
- Sousa, P.; Borges, S.; Pintado, M. Enzymatic Hydrolysis of Insect Alphitobius Diaperinus Towards the Development of Bioactive Peptide Hydrolysates. Food Funct. 2020, 11, 3539–3548. DOI: 10.1039/D0FO00188K.
- Rivero-Pino, F.; Espejo-Carpio, F. J.; Guadix, E. M. Evaluation of the Bioactive Potential of Foods Fortified with Fish Protein Hydrolysates. Food Res. Int. 2020, 137, 109572. DOI: 10.1016/j.foodres.2020.109572.
- Bhaskar, N.; Benila, T.; Radha, C.; Lalitha, R. G. Optimization of Enzymatic Hydrolysis of Visceral Waste Proteins of Catla (Catla catla) for Preparing Protein Hydrolysate Using a Commercial Protease. Bioresour. Technol. 2008, 99, 335–343. DOI: 10.1016/j.biortech.2006.12.015.
- Jie Bao, Z.; Zhao, Y.; Ying Wang, X.; Chi, Y. J. Effects of Degree of Hydrolysis (DH) on the Functional Properties of Egg Yolk Hydrolysate with Alcalase. J. Food Sci. Technol. 2017, 54, 669–678. DOI: 10.1007/s13197-017-2504-0.
- Yin, T.; Du, H.; Zhang, J.; Xiong, S. Preparation and Characterization of Ultrafine Fish Bone Powder. J. Aquat. Food Prod. Technol. 2016, 25, 1045–1055. DOI: 10.1080/10498850.2015.1010128.
- Kurozawa, L. E.; Park, K. J.; Hubinger, M. D. Effect of Carrier Agents on the Physicochemical Properties of a Spray Dried Chicken Meat Protein Hydrolysate. J. Food Eng. 2009, 94, 326–333. DOI: 10.1016/j.jfoodeng.2009.03.025.
- Sridharan, S.; Meinders, M. B. J.; Bitter, J. H.; Nikiforidis, C. V. Pea Flour as Stabilizer of Oil-in-water Emulsions: Protein Purification Unnecessary. Food Hydrocoll. 2020, 101, 105533. DOI: 10.1016/j.foodhyd.2019.105533.
- Dehkordi, S. S.; Alemzadeh, I.; Vaziri, A. S.; Vossoughi, A. Optimization of Alginate-Whey Protein Isolate Microcapsules for Survivability and Release Behavior of Probiotic Bacteria. Appl. Biochem. Biotechnol. 2020, 190, 182–196. DOI: 10.1007/s12010-019-03071-5.
- Elavarasan, K.; Shamasundar, B. A.; Badii, F.; Howell, N. Angiotensin I-converting Enzyme (ACE) Inhibitory Activity and Structural Properties of Oven- and Freeze-dried Protein Hydrolysate from Fresh Water Fish (Cirrhinus mrigala). Food Chem. 2016, 206, 210–216. DOI: 10.1016/j.foodchem.2016.03.047.
- Fan, Y.; Yu, Z.; Zhao, W.; Ding, L.; Zheng, F.; Li, J.; Liu, J. Identification and Molecular Mechanism of Angiotensin-converting Enzyme Inhibitory Peptides from Larimichthys Crocea Titin. Food Sci. Hum. Wellness. 2020, 9, 257–263. DOI: 10.1016/j.fshw.2020.04.001.
- Naqash, S. Y.; Nazeer, R. A. Antioxidant and Functional Properties of Protein Hydrolysates from Pink Perch (Nemipterus japonicus) Muscle. J. Food Sci. Technol. 2013, 50, 972–978. DOI: 10.1007/s13197-011-0416-y.
- Ma, F. F.; Wang, H.; Wei, C. K.; Thakur, K.; Wei, Z. J.; Jiang, L. Three Novel ACE Inhibitory Peptides Isolated from Ginkgo Biloba Seeds: Purification, Inhibitory Kinetic and Mechanism. Front. Pharmacol. 2019, 9, 1579. DOI: 10.3389/fphar.2018.01579.
- Purschke, B.; Meinlschmidt, P.; Horn, C.; Rieder, O.; Jäger, H. Improvement of Techno-functional Properties of Edible Insect Protein from Migratory Locust by Enzymatic Hydrolysis. Eur. Food Res. Technol. 2018, 244, 999–1013. DOI: 10.1007/s00217-017-3017-9.
- Cian, R. E.; Salgado, P. R.; Mauri, A. N.; Drago, S. R. Pyropia Columbina Phycocolloids as Microencapsulating Material Improve Bioaccessibility of Brewers’ Spent Grain Peptides with ACE-I Inhibitory Activity. Int. J. Food Sci. Technol. 2020, 55, 1311–1317. DOI: 10.1111/ijfs.14397.
- Tao, M.; Wang, C.; Liao, D.; Liu, H.; Zhao, Z.; Zhao, Z. Purification, Modification and Inhibition Mechanism of Angiotensin I-Converting Enzyme Inhibitory Peptide from Silkworm Pupa (Bombyx mori) Protein Hydrolysate. Process Biochem. 2017, 54, 172–179. DOI: 10.1016/j.procbio.2016.12.022.
- Dewi, A. S.; Patantis, G.; Fawzya, Y. N.; Irianto, H. E.; Sa’diah, S. Angiotensin-Converting Enzyme (ACE) Inhibitory Activities of Protein Hydrolysates from Indonesian Sea Cucumbers. Int. J. Pept. Res. Ther. 2020, 26, 2485–2493. DOI: 10.1007/s10989-020-10035-5.
- de Oliveira Filho, J. G.; Rodrigues, J. M.; Valadares, A. C. F.; de Almeida, A. B.; Valencia-Mejia, E.; Fernandes, K. F.; Lemes, A. C.; Alves, C. C. F.; de Figueiredo Sousa, H. A.; Da Silva, E. R., et al. Bioactive Properties of Protein Hydrolysate of Cottonseed Byproduct: Antioxidant, Antimicrobial, and Angiotensin-Converting Enzyme (ACE) Inhibitory Activities. Waste Biomass Valorization. 2021, 12, 1395–1404. DOI: 10.1007/s12649-020-01066-6.
- Lammi, C.; Aiello, G.; Boschin, G.; Arnoldi, A. Multifunctional Peptides for the Prevention of Cardiovascular Disease: A New Concept in the Area of Bioactive Food-derived Peptides. J. Funct. Foods. 2019, 55, 135–145. DOI: 10.1016/j.jff.2019.02.016.
- Zhao, X.; Zhu, H.; Zhang, B.; Chen, J.; Ao, Q.; Wang, X. XRD, SEM, and XPS Analysis of Soybean Protein Powders Obtained through Extraction Involving Reverse Micelles. JAOCS J. Am. Oil Chem. Soc. 2015, 92, 975–983. DOI: 10.1007/s11746-015-2657-9.
- López-Pedrouso, M.; Borrajo, P.; Pateiro, M.; Lorenzo, J. M.; Franco, D. Antioxidant Activity and Peptidomic Analysis of Porcine Liver Hydrolysates Using Alcalase, Bromelain, Flavourzyme and Papain Enzymes. Food Res. Int. 2020, 137, 109389. DOI: 10.1016/j.foodres.2020.109389.
- Gallego, M.; Mauri, L.; Aristoy, M. C.; Toldrá, F.; Mora, L. Antioxidant Peptides Profile in Dry-cured Ham as Affected by Gastrointestinal Digestion. J. Funct. Foods. 2020, 69, 103956. DOI: 10.1016/j.jff.2020.103956.
- Xu, Y.; Bao, T.; Han, W.; Chen, W.; Zheng, X.; Wang, J. Purification and Identification of an Angiotensin I-converting Enzyme Inhibitory Peptide from Cauliflower By-products Protein Hydrolysate. Process Biochem. 2016, 51, 1299–1305. DOI: 10.1016/j.procbio.2016.05.023.
- Platzer, M.; Kiese, S.; Herfellner, T.; Schweiggert-Weisz, U.; Miesbauer, O.; Eisner, P. Common Trends and Differences in Antioxidant Activity Analysis of Phenolic Substances Using Single Electron Transfer Based Assays. Molecules. 2021, 26, 1244. DOI: 10.3390/molecules26051244.
- Elavarasan, K.; Shamasundar, B. A. Antioxidant Properties of Papain Mediated Protein Hydrolysates from Fresh Water Carps (Catla catla, Labeo rohita and Cirrhinus mrigala) and Its Application on Inhibition of Lipid Oxidation in Oil Sardine Mince during Ice Storage. J. Food Sci. Technol. 2021, 1–10. DOI: 10.1007/s13197-021-05053-0.
- Yathisha, U. G.; Karunasagar, I.; BS, M. Bioactivity and Functional Properties of Protein Hydrolysate from Muscle and Visceral Waste of Ribbon Fish (Lepturacanthus savala) Extracted by Three Different Proteolytic Enzymes. J. Biologi. Activ. Comp. Natur. 2021, 11 (4), 363–379. DOI: 10.1080/22311866.2021.1953399.