
 ?Mathematical formulae have been encoded as MathML and are displayed in this HTML version using MathJax in order to improve their display. Uncheck the box to turn MathJax off. This feature requires Javascript. Click on a formula to zoom.
ABSTRACT
Four improved varieties of haricot bean flour prepared by soaking, autoclaving, germination, and germination followed by autoclaving were investigated. The objective was to obtain information on the effect of varieties, processing methods and their interactions on flour quality. The moisture, crude protein, crude fat, crude fiber, ash, and carbohydrate contents of flours were from 8.05 to 9.72%, 23.11 to 27.96%, 1.33 to 2.87%, 3.82 to 5.97%, 3.45 to 5.52%, and 51.79 to 57.14%, respectively. The flour produced through germination followed by the autoclaving method showed a significant reduction in tannin, phytate, and oxalate contents with less acceptability by the consumer while the one that produced through germination increased in total flavonoids (2.79 to 3.69 mg QE/g), total phenol content (0.72 to 1.04 mg GAE/g) and DPPH scavenging activities (EC50). Germination showed increased foaming and emulsifying capacity; however, autoclaving and germination followed by autoclaving noticeably reduced foaming capacities.
Introduction
Legume seeds are important staple foods, especially in developing countries, due to their accessibility, relatively low cost, long conservation time, and high nutritional value. Legumes are a major source of cheap protein and minerals when compared with animal products such as meat, fish, and egg,[Citation1] and the less affluent people in many tropical countries, especially in Africa and Asia, utilize legumes as an alternative to other expensive protein sources. Beans contain a variety of phenolic compounds,[Citation2] which are considered to be natural antioxidants and an important part of bioactive components in foods, which can inhibit the development of various diseases such as diabetes mellitus, coronary heart disease, and colon cancer.[Citation3] There is a wide range of haricot bean types grown in Ethiopia, including variegated, red, white, and black varieties. The most commercial varieties are pure red beans and pure white-colored beans, which are becoming the most frequently planted varieties as market demand increases. Despite the wide range of varieties available, widespread production is restricted to a relatively small set of commodity varieties. Processing haricot beans into flour would help to increase its use as there is growing interest in the consumption of flours from different types of legumes.[Citation4] The low consumption of haricot beans for food purposes is due in part to the presence of anti-nutritional factors and low community awareness of the nutritional benefit. Therefore, reducing anti-nutritional factors before consumption is a better solution to the problem. The fact that dry beans are not only nutrient-dense but also gluten-free offers important opportunities to utilize flour in different food systems. To use the potential of haricot beans in food, it is mandatory to study its properties as affected by processing treatments, to improve the nutritional quality of beans by decreasing the content of anti-nutritional factors and, at the same time, spreads their use as ingredients by changing their functional properties.
This work was aimed at determining the physicochemical and functional properties as well as sensory characteristics of soaked, autoclaved, germination, and germination followed by autoclaved haricot beans flour intending to provide information toward the effective utilization of seeds in various food applications and generate relevant data that would improve awareness on their potential for consumers food formulations.
Materials and method
Chemicals
Standards and reagents used were gallic acid (97.5–102.5% sigma Aldrich, China), Quercetin (≥98%, sigma Aldrich, Germany), folin-Ciocalteu’s (2 N,Sigma Aldrich,USA), (+-) Catechin hydrate (≥96.0%, Sigma Aldrich, China), 2,2-Diphenyl-1-picrylhydrazyl (sigma Aldrich,Germany), Phytic acid sodium salt hydrate (sigma Aldrich, Switzerland), Vanillin (≥ 99.5%, UNI-CHEM,Roth, France), Aluminum Chloride (99% Loba chemie, India), Sodium carbonate (≥99.5% Carl Roth GmbH,Karlsruhe) Methanol (M.wt. = 34.02 g/mol, Biochem chemopharma, France), and Nitric acid (69% Loba chemic, India) . All chemicals used were of analytical grade.
Material collection and preparation
Haricot bean (Phaseolus Vulgaris L.) varieties ((Awash-2, SER 119, SAB 632, and SER 125)) were collected from Awash Melkasa Agricultural Center. The seeds were cleaned and the extraneous materials were carefully removed by hand sorting. From each variety, the good sample was separated into four parts. One portion was soaked (S) dehulled and served as control. The others were processed using the following processing methods; germination (G), autoclaving (A), and germination followed by autoclaving (GA). It was set in a 4 × 4 factorial arrangement prior to drying and milling. The resulting flours were sealed and placed in plastic bags and were stored at 4°C in a desiccator before use.
Soaking
The flour was prepared according to the method of Ugwu & Oranye[Citation5] with some modifications. During preparation, 500 g of seeds which were free of dirt and other extraneous materials were, weighed, and soaked in 2 L of distilled water for 24 h at room temperature (25 ± 2°C). The soaked seeds are then drained and dehulled by rubbing in between palms to remove the husk. The dehulled seeds were rinsed, spread on the trays, and dried in a hot air oven (Model 10-D1391/AD, SCA) at 60°C for 10 h with occasional stirring of the seeds at intervals of 30 min to ensure uniform drying. The dried seeds were milled into flour using a hammer mill (Model BH24 1DY, Armfield, England) and sieved through a 500-micron mesh sieve. The flour produced was packaged in airtight plastic bags and stored at 4°C in a desiccator until needed for further analysis.
Autoclaving
It was prepared according to the method of Ugwu & Oranye[Citation5] with some modifications. During preparation, 500 g of seeds free of dirt and other extraneous materials were cleaned, weighed, and soaked in 2 L of distilled water for 24 h at room temperature (25 ± 2°C). The soaked seeds were then drained, rinsed, and dehulled manually by rubbing between palms to remove the husk. Placed the dehulled seeds in a beaker and autoclaved in an autoclave (Model 75xG) at a temperature of 121°C and a pressure of 6 atmospheres for 40 min. Spread the autoclaved seeds on the tray and dry in a hot air oven (Model 10-D1391/AD, SCA) at 60°C for 8 h, stirring the seeds occasionally every 30 min to ensure even drying. Dried seeds were milled to flour by a hammer mill (Model BH24 1DY, Armfield, England) and sieved through a 500-micron mesh screen. The flour produced was packaged in airtight plastic bags and stored at 4°C in a desiccator until needed for further analysis.
Germinating
Accurately weighed 1000 g seeds into a large plastic Petri-dishes and soaked in distilled water (1:5 w/v bean to water ratio) for 24 h at room temperature. Petri-dishes were covered with perforated aluminum foil and placed in the dark room for germination in filter paper lined petri dishes for 4 days. Leaching losses were minimized by collecting all drips at the bottom of the petri-dish. Spray the seeds with distilled water for 10 min every 24 h to avoid mold contamination. At the end of the germination period, non-germinated seeds were discarded; one half of germinated seeds were dehulled manually, dried in an air circulation oven at 60°C for 12 h (Model 10-D1391/AD, SCA) and milled into flour using a hammer mill (Model BH24 1DY, Armfield, England) then sieved through a 500-micron mesh sieve. The other half was autoclaved, dried, and milled as described above. The flour produced was packaged in airtight plastic bags and stored at 4°C in a desiccator until needed for further analysis.
Physical properties
Color
Color analysis was performed using Hunter Lab Colorimeter, Minolta. The color readings were displayed as L*, a*, b*, c*, h* format where a* value extends from −100 (greenness) to +100 (redness), the b* value ranges from −100 (blueness) to +100 (yellowness), whereas the L* value, pointing out the degree of lightness, ranges from 0 (black) to 100 (white).[Citation6] Black and white tiles are used for instrument calibration before color measurement.
Water activity and pH
The water activity of the legume flours was measured by a water activity meter (HD-3A, NanBei, China). Balanced and dissolved 10 g of the sample in a beaker filled with 25 mL of distilled water to form a slurry. It was allowed to stand for 10 min with constant stirring. The pH was then determined with a pH meter (BANTE Multiparameter/China) according to official methods AOAC.[Citation7]
Chemical properties
Proximate composition
The Proximate composition of the flour samples was determined according to the official methods AOAC.[Citation8] Moisture content (MC) was determined by drying the samples in an oven (Model 10-D1391/AD, SCA) at 105°C for 18 h until constant weight. The percentage crude protein found out using an automatic Kjeldahl analyzer (K1160, Hanon, China), and the percent crude protein (% CP) was used to calculate the using the obtained percentage nitrogen (N) with 6.25 as a multiplication factor. Fat content was determined using the Soxhlet extractor technique. The percent of ash (%) was determined after incinerating the samples in a muffle furnace (MKF-07,natek, Turkey) at 550°C for 4 h and calculating the mass difference. Crude fiber percentage (% CF) was assessed by dilute acid and alkali hydrolysis (BXB-06Guangzhou, China). Carbohydrate was calculated by difference.
Phytate content
The phytate content in the samples was determined according to the method described in Deme et al.[Citation9] Extract 100 mg of sample with 10 mL of 0.2 N HCl in a mechanical shaker for 1 h at room temperature. Centrifuged the extract at 3000 rpm for 30 min. The clarified supernatant was used for phytate estimation. Add 1 mL of Wade reagent (containing 0.03% solution of FeCl3· 6H2O and 0.3% of sulfosalicylic acid in water) to 3 mL of the sample solution (supernatant) and vortexed for 5 s. Absorption readings at 500 nm (Perkin Elmer Lambda 950 UV/Vis/NIR, UK) were taken against a blank solution (3 mL extract solution mixed with 2 mL of 2.4% HCl). The sodium salt of phytic acid (5–36 mg/mL) was used as a standard for the construct calibration curve. Phytate concentration was determined from a standard curve and results were expressed as phytic acid in mg per 100 g dry matter.
Tannin content
Tannin content was ascertained by the Burns (1971) method modified by Gemed,[Citation10] using catechin as the tannin standard. Approximately 1.0 g of each treatment samples were weighed in triplicates in screw cap test tube and extracted with 10 mL of 1% HCl in methanol for 24 h at room temperature with mechanical shaking. After 24 h of shaking, the solution was centrifuged at 1000 rpm for 5 min. Mix 1 mL of supernatant with 5 mL of vanillin-HCl reagent (prepared by combining an equal volume of 8% concentrated HCl in methanol and 4% Vanillin in methanol). D-catechin was used as a standard for tannin determination. A 0.01 g of D- catechin was measured and dissolved in 50 mL of 1% HCl in methanol, which was served as a stock solution. A 0, 0.2, 0.4, 3, 0.6, 0.8, and 1 mL of stock solution were taken in a test tube and the volume of each test tube was regulated to 1 mL with 1% HCl in methanol. To each test tube added 5 mL of vanillin-HCl reagent. After 20 min, the absorbance of sample solutions and the standard solution were evaluated at 500 nm (Perkin Elmer Lambda 950 UV/Vis/NIR, UK) zero the spectrophotometer by using distilled water, and the calibration curve was formed from the series of standard solution as absorbance versus concentration and the slope and intercept were used for calculation.
Oxalate content
Oxalate was assessed by the AOAC[Citation8] method. A 1 g of the sample was measured in a 100 mL conical flask. A 75 mL of 3 mol/L H2SO4 was added, the solution was stirred intermittently with a magnetic stirrer for about 1 h and then filtered using Whatman No. 1 filter paper. The sample filtrate (extract) (25 mL) was collected and titrated with hot (80–90°C) 0.1 N KMnO4 solution until a pale pink color was observed for at least 30s. Results were summarized as mg of oxalate per g of sample, and the concentration of oxalate in each sample was assessed by following the calculation:
Antioxidant activities
Sample extraction
Samples were extracted according to the procedures previously defined by Ferreira et al.[Citation11] Briefly, 10 g of flour was extracted with 100 mL of methanol using incubator shaker (ZHWY-103B) at 25°C, 150 rpm for 24 h, and then passed through Whatman No. 1 paper. The sediment was then extracted with two additional 100 mL portions of methanol as described above. The combined methanolic extracts were evaporated to dryness at 40°C using a rota evaporator (R-300, Buchi, Switzerland) and redissolved in methanol at the concentration of 50 mg/mL and stored at 4°C for further use.
Total phenolic content
The total phenolic content (TPC) was assessed using the Folin Ciocalteu assay and using gallic acid (GA) as the standard according to Xu & Chang.[Citation12] The mixture of the sample solution (50 µL), distilled water (3 mL), 250 µL of Folin-Ciocalteu’s reagents solution, and 7% NaCO3 (750 µL) was vortexed and incubated for 8 min at room temperature. Then, a dose of 950 µL of distilled water was added. The mixture was allowed to stand at room temperature for 2 h. The absorbance was measured at 765 nm (Perkin Elmer Lambda 950 UV/Vis/NIR, UK) against distilled water as a blank. Gallic acid was used to draw the standard curve of 20–100 µg/mL (r = 0.99). The results were mean ± standard error of mean and indicated as mg of gallic acid equivalents/g of extract (GAEs). The total phenolic content of the flour extracts in gallic acid equivalent (GAE) was determined by the following formula:
where C is the total content of phenolic compounds, mg/g fresh material, in GAE; c is the concentration of gallic acid determined from the calibration curve; V the volume of extract, L; m is the weight of extract, g.
Total flavonoid content
Total flavonoid content was determined using the colorimetric method previously described by Xu & Chang.[Citation12] Briefly, 0.25 mL of the flour extract or quercetin standard solution was mixed in a test tube with 1.25 mL of distilled water, followed by 75 µL of 5% NaNO2 solution. After 6 min, added 150 µL of 10% AlCl3.6H2O solution, let stand for an additional 5 min, and then adding 0.5 mL of 1 M NaOH. The mixture was adjusted to 2.5 mL with distilled water and mixed well. The absorbance was evaluated immediately against the blank (the same mixture without the sample) using a UV-Visible Spectrophotometer (Lamda 950 UV/Vis/NIR, Perkin Elmer, UK) at 510 nm. Results were calculated and expressed as quercetin equivalents (mg of CE/g sample) using the calibration curve of (+)-catechin. The Linear range of the calibration curve was 25 to 200 µg/mL (r = 0.99). The extraction was conducted in triplicate.
Free radical scavenging activity
The effect of methanolic extracts on the DPPH (2,2- diphenyl-1-picrylhydrazyl) radical was estimated according to Woldegiorgis et al.[Citation13] A 0.004% solution of DPPH radical solution in methanol was prepared and then 4 mL of this solution was blended with 1 mL of various concentrations (2–14 mg/mL) of the extracts in methanol. Finally, incubated the samples for 30 min at room temperature in the dark. Scavenging capacity was read spectrophotometrically (UV/Vis/NIR, Lambda 950 Perkin Elmer, UK) by checking the decrease in absorbance at 517 nm. The absorption maxima were first confirmed by scanning freshly prepared DPPH from 200 to 800 nm by the scan mode of the spectrophotometer. Ascorbic acid was used as a standard without extract and used as the control. Inhibition of free radical DPPH in percent (I%) was then calculated:
where A0 is the absorbance of the control and A1 is the absorbance of the sample. EC50 (µg/mL) was defined as the half-maximal effective concentration of the amount of sample necessary to decrease the absorbance of DPPH by 50%. It was obtained by interpolation from the linear regression analysis.
Functional properties
Water absorption capacity (WAC) and water solubility index (WSI)
Suspension was prepared by adding 10 mL of distilled water to 1 g of flour and stirring for 5 min in centrifuge tubes. The tubes were then centrifuged at 3000*g (TGL-16, Sichuan Shock, China) for 30 min, and the supernatant was collected in an evaporating dish to determine its solid content and the sediment was balanced. The weight of dry solids was recovered by evaporating the supernatant overnight at 105°C. The weight of solids obtained after evaporation of the supernatant was used to calculate the water solubility index (EquationEquation. 5(5)
(5) ), and the water absorption index (EquationEquation. 4)
(4)
(4) was determined from the amount of water absorbed by the sediments.[Citation14]
Foaming properties
A suspension was prepared by putting on a known weight of the sample to 100 mL of distilled water. The suspension was homogenized for 5 min. The mixture was transferred immediately into a 250 mL measuring cylinder and the volume was recorded after the 30s. Foam capacity (FC) was expressed as a % increase in volume by the formula (EquationEq. 6(6)
(6) ), and the change in volume of foam after 60 min of standing at room temperature was documented as foam stability (Eq. 7).[Citation15]
where FC is the foaming capacity, FS is the foaming stability, V1 is the volume of the suspension, V2 is the volume of suspension and foam formed and V3 is the volume of the foam formed after it is permitted to stand for 60 min, all volumes measured in mL.
Oil absorption capacity (OAC)
The OAC of flour was assayed according to Niangoran et al.[Citation16] method with some modification. A 1 g of the flour (Mo) was mixed with 10 mL oil in a centrifuge tube and allowed to stand at room temperature for 1 h followed by centrifugation at 3000 for 30 min. The resulting precipitate (M1) was weighed and the OAC was calculated as follows:
Gel formation
Gelation was investigated according to Adebowale et al.[Citation14] Suspensions of 4, 6, 8, 10, 12, and 14 g sample/100 mL were prepared in distilled water and mixed in a Waring Blender (XTY-767, Starsun, China) at the highest speed for 2 min. A 10 mL of each dispersion was transferred into a test tube. Heated in a boiling water bath for 1 h, then rapidly cooled in a cold water bath. The tubes were further cooled at 4°C for 2 h. The least gel concentration was found. Concentration at which the sample in an inverted test tube did not slip.
Emulsifying properties
Emulsifying properties (emulsifying capacity and stability) were calculated according to the method defined by Butt & Batool.[Citation17] A 1.8 g flour was added to 25 mL of distilled water (pH 7) and dispersed at maximum speed in a blender (XTY-767, Starsun, China). Corn oil (12.5 mL) was added and unified at high speed for 1 min; the resulting emulsion was equally divided into two 12 mL centrifuge tubes and centrifuged at 5200 rpm for 5 min using a centrifuge (TGL-16, Sichuan Shock, China). Emulsion capacity was calculated as follows:
The evaluation of emulsion stability was similar to that of emulsion capacity, except that the emulsion was first heated in a water bath at 85 °C for 30 min and then cooled to 25 °C before centrifugation.
Bulk density
The bulk density of each flour sample was determined according to the method of Siddiq et al.[Citation6] Place a 50 g sample in a 100 mL graduated measuring cylinder and tapped the cylinder gently several times to a constant volume on a laboratory bench.
Sensory evaluation
The sensory evaluation of flour was conducted using 20 panelists. Preference analysis using a nine (9) point Hedonic Scale, where 1 = like extremely, 5 = neither like nor dislike and 9 = dislike extremely was adopted according to Iwe.[Citation18] Color, Odor, texture, and overall acceptability were evaluated.
Statistical analysis
Statistical analysis was done using software package SAS version 9.0 was applied (SAS Institute, Inc., Cary, North Carolina, USA) by using two factors analysis of variance (ANOVA). Tukey’s test at 5% significance level (P < .05) was used to determine significant differences among means of samples. Pearson’s correlation was calculated to study the relationship between various properties.
Result and discussion
Physical properties
As revealed in , the water activity implies an indication of the shelf-stability of a product exhibited relatively has no significant impact on the flour as a result of processing methods (p < .05); while the pH value indicates a sign of acidity or alkalinity ranged from 6.36 ± 0.06 to 6.68 ± 0.00 for flour samples of 125A and 125G respectively, indicating low acidity. Higher acidic flours (pH < 4) are particularly unsuitable for processing into bakery and pastry products as compared to the flour that has been produced as to nurture a lower acidic property. The pH values of the flour in an aqueous suspension is important because some functional properties such as solubility and emulsion properties are highly affected by pH changes.[Citation19]
Table 1. Effects of interaction between varieties and processing methods on Water activity, pH, and color properties of haricot beans flour
Values are mean ± standard deviation. Means sharing the same letters in columns are not significantly different from each other (Tukey’s HSD test, p < .05). *** Significant effect at p < .05, NS, Not significant. L*, whiteness; a*, redness; b*, yellowness; c, chroma; h, hue angle. A, Awash-2 Variety; 119, SER 119 Variety; 632, SAB 632 Variety; 125, SER 125 Variety; S, Soaking Processing method; A, Autoclaving processing method; G, Germination processing method; GA, Germination followed Autoclaving processing method
The Hunter color L*, a*, and b* values of the flour samples varied significantly (P < .05) due to differences in varieties and processing methods, as shown in . The L* and h values were highest for flour produced by the soaking method and the lowest for flour produced by the GA method. As can be seen in , all flour samples had positive values for a* and b* with the highest value was recorded for flour samples of AGA 5.63 ± 0.56 and 19.70 ± 0.76, indicating a greater degree of redness and yellowness respectively. The highest value of L* reflects its lighter black, while the lowest represents a darker black.[Citation20] Soaking, and germination processes increased the lightness of haricot bean flour. Germination, autoclaving, and germination followed by autoclaving increased the b* value of haricot bean flour as compared to the flour through the soaking method. Chromaticity depicted a similar trend to that observed for b* values. Flours from the soaking method had the lowest chroma and highest hue angle values: chroma symbolizes ‘richness of color,’ color intensity and hue angle illustrate how an average person will recognize that color.[Citation6] Differences in hunter color values may be due to genetic differences among the cultivars.[Citation21]
Chemical properties
Proximate composition
The effects of varieties and flour processing methods on haricot bean nutrients are presented in . The top three moisture and fat content of 119 GA, 632 GA, 632A and 119S, 119A, and 119 GA flour samples were 9.72 ± 0.17, 9.36 ± 0.24, 9.28 ± 0.37 and 2.87 ± 0.34, 2.66 ± 0.21, 2.50 ± 0.43, respectively. On average, flour obtained from the SAB 632 variety had the highest moisture and crude fiber content, while flour obtained from the Awash-2 variety recorded the lowest. The 125 GA and 632 G flour samples had the highest crude protein and crude fiber contents, 27.96 ± 0.26 and 5.97 ± 0.10, respectively, as whereas the AS flour samples had the lowest, 23.11 ± 1.18 and 3.82 ± 0.10, respectively. The crude protein content of the flour in the soaked flour sample was significantly (p < .05) lower than in the other three flour samples. The top two carbohydrate content with no significant difference between them were 57.14 ± 1.21 and 56.66 ± 1.88 for flour samples of AA and AS while the lowest two were 51.79 ± 0.27 and 51.80 ± 0.91 recorded for flour samples of 119 GA and 125 GA, respectively. Processing of seeds relatively showed significant variation in crude fat content, while germination significantly (P < .05) reduced moisture, crude fat, and carbohydrate content, instead, it relatively increases crude protein, crude fiber, and ash content of the flour as compared to soaked flour. Moisture content was below the maximum 15.5% specified for wheat flour.[Citation22] This is an important parameter for flour stability in storage. Products with reduced moisture were generally stored longer due to reduced microbial and chemical activity. The reduction in crude fat content was due to the energy expended by the seeds for germination.[Citation23] Mubarak[Citation24] reported a similar case that sprouting mung bean reduced fat content. These findings are also consistent with an increase in crude fiber content during sprouting in American sweet lupine.[Citation25] The increase in protein content on germination was possible because of the degradation of high molecules of the protein to simple peptides and the use of other components in the seeds during the germination process and also by releasing the bound nitrogenous compounds (e.g.-tannin-protein complexes).[Citation24] An increase in protein content during high-temperature treatments or autoclaving might be because of the high digestibility of proteins during processing.[Citation26]
Table 2. Proximate composition of haricot bean flour as affected by interactions of variety and processing methods % (g/100 g dry weight basis)
Decreased carbohydrate levels of the germinated seeds may be due to increased amylase activity, which breaks down complex carbohydrates into assimilable sugars required for seedling growth in the early stages of germination.[Citation27] These findings are also consistent with Hooda & Jood,[Citation28] who reported that germination decreased crude fat and total carbohydrates, thereby increasing crude fiber, sugars, and crude protein levels.
Phytochemical properties
The phytate, tannin, oxalate, total phenol contents, and DPPH scavenging (EC50) of all flour samples were relatively significantly influenced by the interaction of variety and processing method (P < .05) (). The AS flour sample had the highest phytate level (143.21 ± 16.41 mg/100 g), while the flour sample 119 GA had the lowest phytate level (122.26 ± 98.24 mg/100 g). Likewise, AGA (0.82 ± 0.01 mg/100 g) and 632 GA (3.15 ± 0.63 mg/g) flour samples had the lowest tannin and oxalate contents, respectively. The level of phytates observed in this study is lower than phytate content (10–60 mg/g) which could pose a health problem to humans.[Citation29] The result showed that all the processing methods significantly reduced phytate, tannin, and oxalate contents in haricot beans, among which germination followed by autoclaving were the most effective. Autoclaving partially affected phytate content due to the thermal stability of phytate. On the other hand, the breakdown of phytate during germination is attributed to the amplification activity of endogenous phytase (enzyme activity). Likewise, the observed reduction in tannin content in germinated seeds flour could be attributed to the hydrophobic binding of tannins with seed proteins and enzymes. Also, some loss of tannins during germination may be because of the leaching of tannins into the water.[Citation30] This result is in agreement with the lower value reported by Mubarak[Citation24] in which tannins and phytate in mung bean seeds were significantly (p < 0:05) reduced by germination processes. Similar findings were made by Manez et al[Citation31] for the phytate content of raw haricot beans (0.61–2.38 g/100 g)
Table 3. Effects of interaction between varieties and processing methods on phytochemical composition of haricot beans flour
In terms of TFC, as shown in , the total flavonoids (TFC) of the flour samples were not significantly different among varieties and as a result of the interaction between variety and processing method (P < .05), but there were significant differences in total phenols. The highest total flavonoid content (3939.45 ± 787.31 mgQE/g) was recorded for the flour produced by germination of the Awash-2 variety, but the lowest value (1253.88 ± 419.24) belonged to flour produced by the autoclaving method of the SER 119 variety. This shows that the effect of processing method is better than that of the variety. The contents of the top two phenolic compounds were (1145.59 ± 73.31 and 1106.61 ± 115.58 mg GAE/g), which belonged to the AG and 125 G flour samples, respectively. Unlike autoclaving, which reduces the total flavonoids and phenolic content of flour, germination improved its content. This indicated that autoclaving had a higher degree of damage to the active phenolic compounds of the flour than the germination treatment. According to (Luthria & Pastor-Corrales[Citation32] total phenolic contents among dry beans can be attributed to a variety of factors including: genotype, agronomic practices, maturity at harvest, post-harvest storage, and climatic conditions, as well as growing and storage conditions; but not restricted to these once only. In the present study, the total phenolic contents of flour were in the range of 0.39 ± 9.50 to 1.15 ± 73.31 mg GAE/g (); whereas, according to Ombra et al.[Citation33] the total phenolic content of the common bean is in the range of 0.14–1.29 mg GAE/g. 125 G flour had better antioxidant properties with lower EC50 values of 0.1 mg/mL while AA, 119A, 632A, 125A flours had higher EC50 values of 0.19 mg/mL.
The synthetic antioxidant (L-Ascorbic acid), which was used as a positive control, had a superior performance with the least EC50 in all the tests. As can be inferred from , on the difference in free radical scavenging activity of methanolic extracts of the flours, the scavenging effect increased with concentration and was the highest for flour 125 G with 80% inhibition at 0.2 mg/mL concentration.
Figure 1. Free radical scavenging of methanolic extract of haricot beans flour and controls for scavenging respectively.
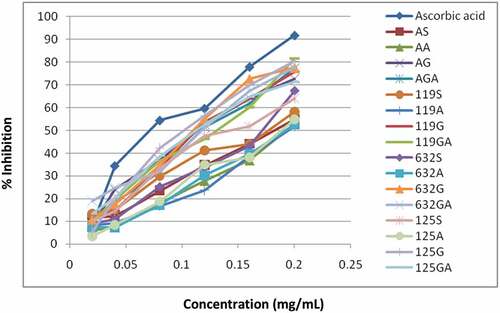
In all samples analyzed, flour samples of 119A had the least scavenging power with only 51.8% inhibition at 0.2 mg/mL. The synthetic antioxidant L-ascorbic acid was 90% scavenged at a concentration of 0.2 mg/mL. This study is consistent with other studies in the literature. For example, Oboh[Citation34] reported that the antioxidant activity of legumes was positively correlated with phenolic compounds. From the determination of total phenolic, total flavonoid contents, and antioxidant activity in this study, the content of sprouted flour was higher than that of soaked flour.
Functional properties
The functional properties determine the application and use of food material in various foods. As shown in the data in , with the exception of bulk density, there were significant differences (p < .05) between the different cultivars (Awash-2, SER 119, SAB 632, and SER 125) and the processing method studied flour functional properties. The top four water absorption capacities were 3.71 ± 0.03, 3.68 ± 0.01, 3.59 ± 0.05, and 3.57 + 0.00 g/g for flour samples of 125 GA, 119 GA, 632 GA, and AGA, respectively. The water solubility index of AA and 119 GA flours increased from 0.10 ± 0.02 to 0.31 ± 0.01 g/g, while the oil absorption capacities of 632 GA and 632 G flour samples ranged from 1.67 ± 0.07 to 1.89 ± 0.10 g/g, respectively. Flour samples of 125 G, 632 G, 632S, AG, and 119 G had the highest foaming capacity and lowest foaming stability (). Emulsion capacity exhibited a significant difference among the flours with the highest score (34.72 ± 2.41%) for 119 G and 632 G; and the lowest (16.67%) for 125S flour sample, but emulsion stability showed that there was no significant difference (p < .05) between the flour samples except for the AS, AG, and AGA samples. In general, the SER 119 and Awash-2 varieties had the lowest foaming and emulsion capacity, while the SAB 632 variety had the lowest emulsion Stability. Sprouting increased the WSI, OAC, FC, EC and LGC of flour compared to soaking.
Table 4. Effects of interaction between varieties and processing methods on functional properties of haricot beans flour
The reason for the increment of water absorption during the autoclaving method could be due to the denaturation of proteins on heating leading to improve water imbibing capacity as a result of greater porosity, better fluid entrapment, and greater water-binding properties by amino acid residues exposed as a result of denaturation.[Citation23] According to Aguilera et al.[Citation35] in addition to starch gelatinization, the swelling of crude fiber during heating may also contribute to increasing WAC. Autoclaving of germinated seed may lead to denaturation of haricot bean protein, thus higher water absorption capacity values were obtained in this study. But the solubility index, which is related to the presence of soluble molecules like amylose and albumins in the flour, were increased during germination, possibly due to increased amylolytic and proteolytic activity.[Citation14]
The efficacy of lipid binding in pulse flours mainly depends on the surface hydrophobicity of protein, which can be enhanced by germination as this process increases the exposure of nonpolar parts from the interior of protein molecules.[Citation36,Citation37] These findings are consistent with Ghavidel & Prakash.[Citation37] It has been reported that germination of beans increases oil holding and foaming capacity while reducing the foaming stability of flours. The more pronounced reduction in foaming capacity in autoclaving samples may be due to protein denaturation.[Citation38] It is also an indication of precipitation of proteins due to the temperature and time of the heat treatment used in the present study. The higher foaming stability values may be due to the denaturation of proteins present in the flour, which may lead to an increase in viscosity thereby making the interfacial film rigid and thus stabilizing the foam of flour.[Citation39] Germination leads to partial unfolding and dissociation of proteins, which tend to make proteins more surface-active, especially since it is associated with surface hydrophobicity leading to enhanced emulsification capacity.[Citation37] As suggested by Dzudie et al.,[Citation19] the high emulsion stability may be related to the globular nature of the major protein of the beans. The significant decrease in LGC values observed in germinated flour may be due to the interaction of amylase and starch in seeds during germination.[Citation38] The higher the LGC, the higher the amount of flour required to form the gel.[Citation14] However, gelation is not only related to the amount of protein, but also to the type of protein and non-protein components in the flour.[Citation40] The lower the least gelation concentration, the better the ability of proteins to gel, because protein gels are aggregated of denatured molecules.[Citation41]
Sensory evaluation
Sensory evaluation is one of the methods of evaluating the quality of a product and can be used to evaluate its acceptance by consumers (ie, consumer acceptance or preference).[Citation42] shows the results of sensory properties of flours due to the interaction between varieties and processing methods. As shown in the data in , there was no significant effect on the sensory evaluation of flours due to variety differences, but the processing methods and the interactions showed some significant differences. The top three flour samples for color and overall acceptability were AS (8.60 ± 0.52), 632S (8.50 ± 0.53), 125S (8.40 ± 0.70) and AS (8.40 ± 0.51), 125S (8.40 ± 0.70) and 632S (8.10 ± 0.99) during consumer testing, respectively. Except for 125S, AS, 125 G, 125S, and AGA flour samples, the other flour samples did not differ significantly in odor and texture, respectively. Low odor means that it adds odor to the food during manufacture of this flour, in this finding it is the SER 125 variety through germination. Flour from an autoclaving method doesn’t show a significant difference in terms of odor and texture when compared to soaked one. The sensory evaluation indicated a higher preference for flours produced through soaking methods (control) when compared to other flour samples.
Table 5. Effects of interaction between varieties and processing methods on sensory properties of haricot beans flour
Correlation
shows, the correlation between the physicochemical and functional properties of flours produced by different processing methods. The crude proteins of flour were positively correlated with functional properties but significantly negatively correlated with LGC (r = −0.605) (P < .01 and P < .05) negatively. Crude fiber (r = 0.543), crude protein (r = 0.695), and carbohydrate (r = 0.618) were strongly associated with emulsion capacity, although carbohydrates were negatively correlated. The crude Protein content was negatively correlated with whiteness (r = −0.652) of the flour and positively correlated with redness (r = 0.506) and yellowness (r = 0.492) of the flour. However, carbohydrates were significantly positively correlated with whiteness (r = −0.643) and yellowness (r = −0.491) but negatively correlated with redness (r = 0.485). Water absorption capacity was significantly correlation with water solubility index (r = −0.822), foaming stability (r = 0.605), and hunter colors but negatively correlated with foaming stability and L* (r = −0.746) (P < .01 and (P < .05). Foaming capacity was significantly negatively correlated (P < .01 and P < .05) with foaming stability (r = −0.858) but positively correlated with emulsion capacity. Likewise, negative correlations were observed between oil absorption capacity and foaming stability (r = −0.317) as well as WSI and foaming stability (r = −0.698).
Table 6. Correlation between various properties of haricot bean flours
Conclusion
Common bean (Phaseolus vulgaris L.) is one of the most important pulses because of its nutritional value and beneficial effects. The data obtained in this study show that the quality of processed haricot seeds differs in its physical, chemical, functional, and organoleptic properties as a result of varieties, processing methods, and the interactions of both. However, the flour produced by the soaking method (control) was more brighter, while the flour produced by germination and then autoclaving was darker and less saturated than the other flour samples. Germination increases crude protein, crude fiber, antioxidant content, and functional properties (such as WSI, foaming capacity, emulsion properties, and gelling strength significantly). Nevertheless, germination followed by autoclaving reduces the levels of antinutrients compared to the soaking method. The observed chemical composition and functional properties of flour indicated that sprouted flour has the potential to be used as a nutritional supplement and functional ingredient in the preparation of various food products compared to other flour samples. Except with LGC and whiteness, crude protein content of flour was significantly positively correlated with functional and hunter color properties. Sensory panelists’ ratings indicated all flour samples produced were above the acceptability limit provided that the flour produced by soaking is more preferred and the one that is produced through germination followed by the autoclaving is less preferred. The results of this study provides useful data on haricot beans flour, an underutilized crop, for its potential use in different food products.
Acknowledgments
Author Derese Wodajo would like to thank Addis Ababa University Center of Food Science and Nutrition and Wolkite University for providing laboratory facilities.
Disclosure statement
No potential conflict of interest was reported by the author(s).
References
- Subuola, F.; Widodo, Y.; Kehinde, T. Processing and Utilization of Legumes in the Tropics. Trends Vital Food Control Eng. 2012, April.
- Duen˜ as, M.; Herna´ndez, T.; Estrella, I. Phenolic Composition of the Cotyledon and the Seed Coat of Lentils (Lens Culinaris L). Eur. Food Res. Technol. 2002, 215(6), 478–483. DOI: 10.1007/s00217-002-0603-1.
- Tharanathan, R. N.; Mahadevamma, S. Grain Legumes - A Boon to Human Nutrition. Trends Food Sci. Technol. 2003, 14(12), 507–518. DOI: 10.1016/j.tifs.2003.07.002.
- Mahajan, A.; Dua, S. Salts and pH Induced Changes in Functional Properties of Amaranth (Amaranthus Tricolor L.) Seed Meal. Cereal Chem. 2002, 79(6), 834–837. DOI: 10.1094/CCHEM.2002.79.6.834.
- Ugwu, F.; Oranye, N. Effects of Some Processing Methods on the Toxic Components of African Breadfruit (Treculia Africana). Afr. J. Biotechnol. 2006, 6, 234–246.
- Siddiq, M.; Ravi, R.; Harte, J. B.; Dolan, K. D. LWT - Food Science and Technology Physical and Functional Characteristics of Selected Dry Bean (Phaseolus Vulgaris L .) Flours. LWT - Food Sci. Technol. 2010, 43(2), 232–237. DOI: 10.1016/j.lwt.2009.07.009.
- AOAC. Official Methods of Analysis., Association of Official Analytical Chemist, 15th Editi ed.; Washington D.C, 1990.
- AOAC. Association of Official Analytical Chemists, 17th edn ed.; Washington DC, 2005.
- Deme, T.; Haki, G. D.; Retta, N.; Woldegiorgis, A.; Geleta, M. Mineral and anti-nutritional Contents of Niger Seed (Guizotia Abyssinica (L.f.) Cass., Linseed (Linumusitatissimum L.) and Sesame (Sesamumindicum L.) Varieties Grown in Ethiopia. Foods. 2017, 6(4), 1–10. DOI: 10.3390/foods6040027.
- Gemed, H. F. Effects of Boiling Methods on Anti-nutritional Factors of Anchote (Coccinia Abyssinica (Lam.) Cogn) Tubers Grown in Western Ethiopia. Food Sci. Qual. Manag. 2014, 27.
- Ferreira, I. C. F. R.; Baptista, P.; Vilas-boas, M.; Barros, L.; Pigna, G.; Paoletti, V.; Antonini, R.; Barillà, F.; Tanzilli, G., and Vestri, A. Food Chemistry Free-radical Scavenging Capacity and Reducing Power of Wild Edible Mushrooms from Northeast Portugal : Individual Cap and Stipe Activity. The American j cardiol. 2007, 100(10), 1511–1516. DOI: 10.1016/j.amjcard.2007.06.049.
- Xu, B. J.; Chang, S. K. C. A Comparative Study on Phenolic Profiles and Antioxidant Activities of Legumes as Affected by Extraction Solvents. J. Food Sci. 2007, 72(2), S159–S166. DOI: 10.1111/j.1750-3841.2006.00260.x.
- Woldegiorgis, A. Z.; Abate, D.; Haki, G. D.; Ziegler, G. R. Antioxidant Property of Edible Mushrooms Collected from Ethiopia. Food Chem. 2014, 157, 30–36. DOI: 10.1016/j.foodchem.2014.02.014.
- Adebowale, Y. A.; Adeyemi, I. A., and Oshodi, A. A. Functional and Physicochemical Properties of Flours of Six Mucuna Species. African Journal of Biotechnolog. 2005, 4(12), 1461–1468. DOI: 10.4161/cc.4.11.2115.
- Khattab, R. Y.; Arntfield, S. D.; Nyachoti, C. M. Nutritional Quality of Legume Seeds as Affected by Some Physical Treatments, Part 1: Protein Quality Evaluation. LWT - Food Sci. Technol. 2009, 42(6), 1107–1112. DOI: 10.1016/j.lwt.2009.02.008.
- Niangoran, N.; Marie, A.; Edmond, D. A.; Koné, F. M. T., and Patrice, K. L. Functional Properties of Seed Flours from Different Cultivars of Citrullus Lanatus (Cucurbitaceae) Cultivated in Côte D ’ Ivoire. International Journal of Research Studies in Agricultural Sciences (IJRSAS). 2015, 1(5), 32–48.
- Butt, S. M.; Batool, R. Nutritional and Functional Properties of Some Promising Legumes Protein Isolates. Pakistan J. Nutr. 2010, 9(4), 373–379. DOI: 10.3923/pjn.2010.373.379.
- MO, I.;. Handbook of Sensory Methods and Analysi; . Rojoint Communication Services Ltd.Enugu, 2010.
- Dzudie, T.; Hardy, J., and Les Nancy, V. Physicochemical and Functional Properties of Flours Prepared from Common Beans and Green Mung Beans. Journal of agricultural and food chemistry. 1996, 44(10), 3029–3032.
- Jideani, V. A.; van Wyk, J.; Cruywagen, M. H. Physical Properties of Tylosemia Esculentum and the Effect of Roasting on the Functional Properties of Its Flour. African J. Agric. Res 2009, 4(11), 1208–1219.
- Wani, I. A.; Sogi, D. S.; Gill, B. S. Physicochemical and Functional Properties of Flours from Three Black Gram (Phaseolus Mungo L.) Cultivars. Int. J. Food Sci. Technol. 2013, 48(4), 771–777. DOI: 10.1111/ijfs.12025.
- CAC. Codex Standard for Wheat Flour: Codex Stan 152-1985. Codex Alimentarius Commission; CAC Press: Italy.
- Sharma, P.; Kaur, A.; Alam, M. S. Effect of Processing on physico-chemical and Functional Properties of Flours from Cluster or Guar Bean (Cyamopsis Tetragonoloba) Varieties. J. Appl. Nat. Sci. 2016, 8(4), 2120–2127. DOI: 10.31018/jans.v8i4.1101.
- Mubarak, A. E. Nutritional Composition and Antinutritional Factors of Mung Bean Seeds (Phaseolus Aureus) as Affected by Some Home Traditional Processes. Food Chem. 2005, 89(4), 489–495. DOI: 10.1016/j.foodchem.2004.01.007.
- Rumiyati, J.; Jayasena, V. Effect of Germination on the Nutritional and Protein Profile of Australian Sweet Lupin (Lupinus Angustifolius L.). Food Nutr. Sci. 2012, 03(5), 621–626.
- Rajni Mittal, H. P. S. N.; Sharma, P.; Sharma, S.; Sharma, S. Effect of Processing on Chemical Composition and Antinutritional Factors in Chickpea Flour. J. Food Sci. Eng. 2012, 2(3), 180–186. DOI: 10.17265/2159-5828/2012.03.008.
- Mabrouki, S.; Omri, B.; Abdouli, H. Chemical, Functional and Nutritional Characteristics of Raw, Autoclaved and Germinated Fenugreek Seeds. J. new Sci. Agric. Biotechnol 2015, 16(1), 541–551.
- HOODA, S.; JOOD, S. Effect of Soaking and Germination on Nutrient and Antinutrient Contents of Fenugreek (Trigonella Foenum Graecum L.). J. Food Biochem. 2003, 27(2), 165–176. DOI: 10.1111/j.1745-4514.2003.tb00274.x.
- Thompson, L. U. Potential Health Benefits and Problems Associated with Antinutrients in Foods. Food Res. Int. 1993, 26(2), 131–149. DOI: 10.1016/0963-9969(93)90069-U.
- Shimelis, E. A.; Rakshit, S. K. Effect of Processing on Antinutrients and in Vitro Protein Digestibility of Kidney Bean (Phaseolus Vulgaris L.) Varieties Grown in East Africa. Food Chem. 2007, 103(1), 161–172. DOI: 10.1016/j.foodchem.2006.08.005.
- Manez, G.; Alegria, A.; Farre, R.; Frigola, A. Effect of Traditional, Microwave and Industrial Cooking on Inositol Phosphate Content in Beans, Chickpeas and Lentils. Int. J. Food Sci. Nutr. 2002, 53(6), 503–508. DOI: 10.1080/09637480220164343.
- Luthria, D. L.; Pastor-Corrales, M. A. Phenolic Acids Content of Fifteen Dry Edible Bean (Phaseolus Vulgaris L.) Varieties. J. Food Compos. Anal. 2006, 19(2–3), 205–211. DOI: 10.1016/j.jfca.2005.09.003.
- Ombra, M. N., et al. Phenolic Composition and Antioxidant and Antiproliferative Activities of the Extracts of Twelve Common Bean (Phaseolus Vulgaris L.) Endemic Ecotypes of Southern Italy before and after Cooking. Oxid. Med. Cell. Longev. 2016, 2016, 1–12. DOI: 10.1155/2016/1398298.
- Oboh, G. Antioxidant Properties of Some Commonly Consumed and Underutilized Tropical Legumes. Eur. Food Res. Technol. 2006, 224(1), 61–65. DOI: 10.1007/s00217-006-0289-x.
- Aguilera, Y.; Esteban, R. M.; Benítez, V.; Mollá, E.; Martín-Cabrejas, M. A. Starch, Functional Properties, and Microstructural Characteristics in Chickpea and Lentil as Affected by Thermal Processing. J. Agric. Food Chem. 2009, 57(22), 10682–10688. DOI: 10.1021/jf902042r.
- Menon, L.; Majumdar, S. D.; Ravi, U. Development and Analysis of Composite Flour Bread. J. Food Sci. Technol. 2015, 52(7), 4156–4165. DOI: 10.1007/s13197-014-1466-8.
- Ghavidel, R. A.; Prakash, J. Effect of Germination and Dehulling on Functional Properties of Legume Flours. J. Sci. Food Agric. 2006, 86(8), 1189–1195. DOI: 10.1002/jsfa.2460.
- Obatolu, V. A.; Fasoyiro, S. B.; Ogunsumi, L. Effect of Processing on Functional Properties of Yam Beans (Sphenostylis Stenocarpa). Food Sci. Technol. Res. 2001, 7(4), 319–322. DOI: 10.3136/fstr.7.319.
- Ma, Z.; Boye, J. I.; Simpson, B. K.; Prasher, S. O.; Monpetit, D.; Malcolmson, L. Thermal Processing Effects on the Functional Properties and Microstructure of Lentil, Chickpea, and Pea Flours. Food Res. Int. 2011, 44(8), 2534–2544.
- Jideani, V. A.; Van Wyk, J.; Cruywagen, M. H.; Nakamura, E. Physical Properties of Tylosemia Esculentum and the Effect of Roasting on the Functional Properties of Its Flour. Chem. Asian J. 2009, 4(11), 1208–1219. DOI: 10.1002/asia.200900155.
- Oyewole, A.; Abu, T., and Enujiugha, V. Emulsification and Foaming Properties of Locust Bean (Parkiabiglobosa) and Pigeon Pea (Cajanuscajan) Seed Flours and Their Protein Isolates. Nutr. Food Sci. Int. J. 2017, 2(3). DOI:10.19080/NFSIJ.2017.02.555590.
- Mkanda, A. V.; Minnaar, A.; De Kock, H. L. Relating Consumer Preferences to Sensory and Physicochemical Properties of Dry Beans (Phaseolus Vulgaris). J. Sci. Food Agric. 2007, 87(15), 2868–2879. DOI: 10.1002/jsfa.3046.