
ABSTRACT
Freshness of tilapia stored under cold storage was studied by utilizing gas sensor array combined with convolutional neural network (CNN) pattern recognition model in this paper. Total volatile basic nitrogen (TVBN) index was conducted to supply a freshness mark for tilapia sample. A portable electronic nose was designed and fabricated. The sensor array responses to tilapia sample were recorded. Principal component analysis (PCA) was used for gas sensor array data treatment, and this method could not discriminate all the samples. CNN model was optimized. The structure of CNN model had one input layer, four convolutional layers, two pooling layers, one Dropout layer, one fully connected layer and one output layer. The predicting accuracy of optimized CNN was 92.31%. The method investigated in this paper presented some advantages including rapid, easy operation, high sensitivity, high precision, etc. This method can be promising in aquatic food quality evaluating applications.
Introduction
Tilapia is a kind of medium-sized fish. Its delicious meat was widely accepted by people. Moreover, the content of protein and a variety of unsaturated fatty acid is very rich. Many researchers conducted work on its high nutrition content. China is the world’s largest country with the biggest tilapia harvest and exports. So the quality determination for cold-stored tilapia is of great significance.
At present, fish freshness determination ways include physical discrimination, chemical examination, microbial detection, and sensory evaluation.[Citation1,Citation2] The traditional detection ways have disadvantages including tedious, time-consuming, high cost, etc. So a simple, accurate, and easy method is urgently needed in fish freshness rapid detection In recent years, gas sensor array analysis technique develops quickly.[Citation3] It is widely used in food quality, food production, and other industries, etc.[Citation4–6] This technique presents some advantages including rapid detection and stability.[Citation7–10] Meanwhile, with the development of machine learning technique in recent years, more methods, such as supporting virtual machine (SVM), CNN, etc., are effectively applied in food quality examination occasions. However, there is little literature on reporting on the application of gas sensor array combined with machine learning models in tilapia quality rapid monitoring.
In this work, a portable electronic nose system was designed and fabricated using eight kinds of gas sensors. The electronic nose was used to measure the tilapia samples of different storage time under cold storage. The TVBN index was examined to supply a sufficient index reference for electronic nose detection. PCA method was used to conduct classification of fish samples. CNN model was optimized and used to predict the fish freshness.
Materials and methods
Materials and pretreatment
Tilapia was obtained from a agricultural market in Hangzhou. The tilapia was wased with ice water, and the viscera and tail were removed: scale, head and tail. According to the fish spine line, the fish was divided into small pieces (each piece weighted at 25 g ± 5 g), and stored in 277 K in a refrigerator. The fish samples were randomly taken to conduct TVBN tests and gas sensor array experiments for continuous eight days.
TVBN
TVBN examinations were referred to the national standard of SC/T 3032–2007.
Gas sensor array
System setup
is schematic diagram of gas sensor array system adopted in this experiment, and mainly consisted of gas collection device, sensor array, signal processing system. Sample gas collection chamber and clean air collection chamber are two different and mutually separate chambers, which is beneficial to improve the purity of sample gas, improving the accuracy of the experimental data. This experiment adopted eight gas sensor arrays, which is listed in .
Table 1. Gas sensor array.
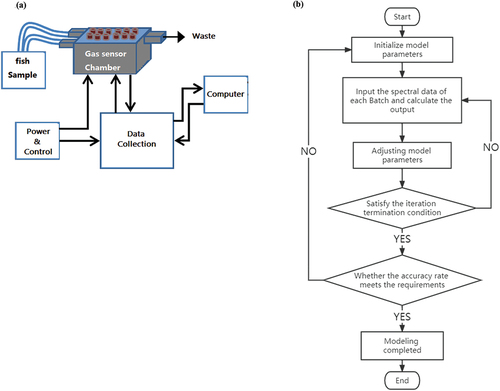
Figure 1. Diagram of the system: (a) elecronic nose system; (b) prediction diagram; (c) CNN model diagram.
Gas sensor array experiments
Fish samples (10 g) were taken out of refrigerator randomly whose temperature is 277 k, and put into 100 ml sample bottle, then packaged with sealing membrane. Half an hour later, the sampling pinhead and zero gas pinhead are placed into the head-space of the beaker. Volatile gas sucked into the E-nose and reacted with gas sensors. The experiments lasted for 50s. The E-nose real-time responses were recorded. Each time after the end of the experiment, continuously feeding the clean air until the gas sensor array recover to initial value. Set 5 parallel experiments and each experiment repeats 3 times.
CNN model development and optimization
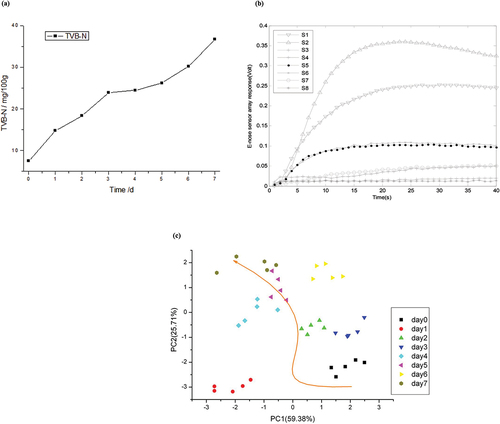
CNN model structure could be referred in . The development of CNN model follows four steps: (i) CNN model is developed according to the initial structure and parameters, and the parameters are initialized.[Citation11,Citation12] (ii) The training data set is input to the model at batch size, and the output results of each layer are obtained, and the model parameters are amended based on the output results. (iii) Whether the accuracy of the testing data set reaches the standard? If yes, execute the next step. If no, return to step (i). (iv) Save the model parameters and end training, and CNN model development is finished.
CNN model has input layer, convolutional layer, pooling layer, dropout layer, and fully connected layer, etc. The input layer absorbs input data. The convolutional layer extracts features. The pooling layer reduces the dimensionality of the features extracted from the convolutional layer and accelerate the convergence of the model. The dropout layer prevents CNN model from over fitting by randomly zeroing out the data. The fully connected layer reduces the output features and passes features to output layer, which outputs the model discrimination results. Considering the practical requirements, CNN model is designed as (see ). The model contains one input layer, four convolutional layers, two pooling layers, one dropout layer, one fully connected layer, and one output layer.
Based on the model structure, the parameters of each layer are initialized. Model parameters are optimized by four steps. (i) Convolution kernel size determination. The accuracy of the model with different convolutional kernel sizes could be referred to . The opzimized convolutional kernel size is 9. (ii) Number of convolution kernels. When the convolutional kernel size is 9, the effect of different numbers of convolutional kernels on the accuracy of the model is evaluated, and the results could be referred to . The optimized number of convolutional kernels is 100. (iii) Batch_size. With the convolutional kernel size of 9 and the number of convolutional kernels of 100, the optimized batch_size value is 400. (iv) Dropout optimization. The dropout parameter is used to prevent model over fitting by randomly setting part of the data to 0. shows the model discrimination results for different Dropout values. The optimized dropout is 0.5. After optimization, the model parameters were finally determined as shown in .
Table 2. Model parameter Setting.
Table 3. Optimized CNN model.
Results and discussion
Results of TVBN
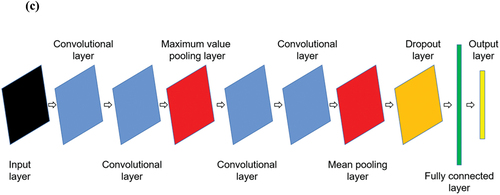
When functioned by microorganism and endogenous enzymes, the protein of tilapia decomposes into ammonia, amine, and other alkaline nitrogen content, presenting certain volatile properties. Through the volatile base nitrogen method,[Citation13] the volatile based nitrogen content in fish could be determined, and the freshness of fish could be approximately evaluated. The examination results are displayed in . The results indicate that TVBN index increases with the increase of storage time. It can’t accurately characterize the freshness changes of tilapia during cold storage.[Citation2] According to GB 2733–2005, the fish meat begins to corrupt.[Citation14] The reason to this phenomena lies in that the fat content of fish meat is easily to be oxidized to a certain extent. From the experimental results, the growth rate of volatile base nitrogen content increases in 7th day. TVBN reaches the maximum and the fish seriously contaminates.
Figure 2. Testing results: (a) TVBN results; (b) electronic nose original responses; (c) PCA results.
Gas sensor array data analysis
Gas sensor array responses
is the original responding chart of gas sensor array. This gas sensor array is equipped with a total of eight gas sensors. From this figure, responses of S1 and S2 are the much larger than other sensors. The responses of S5 and S6 follow in turn. Sensor S8 presents the weakest responses. Results indicate that tilapia meat sample produces feature sensor array responses.
PCA results
The measurement data to tilapia meat samples under different storage time generated by sensor array system is multi-dimensional matrix with sufficient data reductance.[Citation15] PCA method could reduce the dimensionality of such complex data set. Several important index, which is the linear combination of the original data to generalize the most important feature is selected. PCA results are shown in , indicating that the freshness of fish meat in the experiment procedure changes a lot. The total contribution of the first component (PC1 and PC2) is about 85.09%. PC1 has the declining trend in 8 days, and PC2 presents an increasing trend. Generally, the total changing trend of PC1 combined with PC2 is from southeast to northwest. On each day, the gathering degree of the samples declines with the increase of storage days, indicating that the corrupted degree of the sample in the same day has much difference. Generally speaking, PCA analysis is not suitable for characterization on freshness of tilapia samples.
CNN prediction results
The training set has 3500 groups of data, and the predicting set has 2000 groups of data. The predicting experiments are conducted by randomly using data from predicting set. CNN model without optimization was used as the performance comparison to optimized CNN model. Results are displayed in . The accuracy of the CNN model without optimization is 85.19%. The predicting accuracy of the optimized CNN model is 92.31%. Moreover, BP network method was also conducted to make a comparison toward CNN and optimized CNN methods. However, BP method only presented an accuracy of 61.54%. Results indicated that the optimized CNN model is more suitable for the prediction. Moreover, the optimized model need shorter processing time. In field application, two important factors are usually considered for food quality analysis. One is the testing accuracy, the other is the testing efficiency. Some models present better predicting accuracy, but the testing efficiency is relatively low, which prevents these models from wide applications. The optimized CNN model makes a compromise scheme between detection time and detection accuracy. In this work, tilapia freshness monitoring method using gas sensor array combined with machine learning model (CNN) was proposed and validated. The gas sensor array generated abundant examination data. CNN model was trained and the trained model was used for testing data set prediction. The novelty of this method lies in the combination between gas sensor array hardware and CNN software. The gas sensor array provided efficient measurement data, and the data was divided into training set and testing set. CNN model was trained and the optimized model was obtained. The optimized model was utilized to finish the tilapia freshness determination. This method presents some advantages including rapid detection and good accuracy.
Table 4. Predicting results comparison.
Conclusion
In this paper, freshness monitoring on tilapia stored under cold storage utilizing gas sensor array and pattern recognition method was studied. The following results were reached. (i) TVBN index provided freshness reference for tilapia samples. This index increases with the increase of storage time, demonstrating that the meat quality continuously decreased during the experiments. (ii) A portable gas sensor array system was designed and fabricated. The sensor array responses to tilapia sample were recorded. PCA was used for sensor array data treatment. This method could not discriminate all samples in different days. (iii) The optimized CNN model was designed. The structure of designed model had one input layer, four convolutional layers, two pooling layers, one dropout layer, one fully connected layer and one output layer. CNN model parameters were decided by experiments results. The predicting accuracy of optimized CNN is 92.31%. (iv) The method explored in this work has some advantages including rapid, easy operation, high sensitivity, high precision etc, and it is promising in aquatic quality rapid analysis.
Acknowledgments
This work is aided by Science and Technology Research Project of Hangzhou Dianzi University.
Disclosure statement
No potential conflict of interest was reported by the author(s).
References
- Chinese agricultural product export product guide. The Ministry of Commerce of the People’s Republic of China, 2008.
- Zengqi, P., and Chengchu, L. Deng Shanggui.Aquatic Products Processing; Beijing: China Light Industry Press, 2010; pp 1.
- Huanlv, S. Food Flavor Chemistry; Beijing: Chemical Industry Press(CIP), 2007; pp 12.
- Hui, G.; Chen, Y. Investigation of Chilled-Stored Grass Carp Quality Predicting Method Utilizing Electronic Nose[J]. Chin. J. Struct. Chem. 2012, 25(2), 157–161.
- Yi, T.; Jing, X.; Hong, X. The Predicting Model of the Shelf Life of Hairtail Utilizing Electronic Nose[J]. Trans. CSAE. 2010, 26(2), 356–360.
- Zhang, J.; Li, X.; Wang, W. The Test Parameters Optimization of Silver Carp Freshness Utilizing Electronic Nose[J]. J. Agric. Mach. 2009, 129~132, 142.
- Zheng, H.; Wang, S.; Ping, X.; Shao, C.; Zhou, H.; Xiang, B.; Li, J.; Lou, X.; Yi, X.; Guohua, H., et al. Study of Spinyhead Croaker (Collichthys Lucidus) Fat Content Forecasting Model Based on Electronic Nose and Non-linear Data Resolution Model[J]. Food Anal. Methods. 2019, 12(9), 1927–1937.
- Zheng, H.; Ying, X.; Wenxin, W.; Chen, Z.; Shao, C.; Zhou, H.; Wang, S.; Ping, X.; Li, J.; Yi, X., et al. Study of Sensitivity Evaluation on Ridgetail White Prawn (Exopalaemon Carinicauda) Quality Examination Methods. Int. J. Food Prop. 2019, 22(1), 942–951.
- Shao, C.; Haonan, Z.; Zhou, Z.; Li, J.; Lou, X.; Hui, G., and Zhao, Z. Ridgetail White Prawn (Exopalaemon Carinicauda) K Value Predicting Method by Using Electronic Nose Combined with Non-linear Data Analysis Model[J]. Food Anal. Methods. 2018, 11(11), 3121–3129.
- Zhiyi, H.; Chenchao, H.; Jiajia, Z.; Jian, L., and Guohua, H. Electronic Nose System Fabrication and Application in Large Yellow Croaker (Pseudosciaena Crocea) Fressness prediction[J]. J. Food Meas. Charact. 2017, 11(1), 33–40.
- Di, Z.; Zhuang, X., and Hongfu, Z. A Hybrid Deep Neural Network Based on multi-time Window Convolutional Bidirectional LSTM for Civil Aircraft APU Hazard identification[J]. J. Chin. Aerosp. 2022, 35 (4), 344–361.
- Bennett, M.; Demaine, K.; Milroy, C., Stark, B. The Retina Metric CNN (Convolutional Neural Network) Study: Using An Artificial Intelligence Platform To Learn And Improve Patient Outcomes[J]. Invest. Ophthalmol. Visual Sci. 2018, 59(9), 1725.
- Lv, X., Du, J., Jie, Y., Zhang, B., Bai, F., Zhao, H., Li, J. Purification and antibacterial mechanism of fish-borne bacteriocin and its application in shrimp (Penaeus vannamei) for inhibiting Vibrio parahaemolyticus [J]. World J Microbiol Biotechnol. 2017, 33(8): 156.
- Chen, X., Liu, H., Li, X., Wei, Y., Li, J. Effect of ultrasonic-assisted immersion freezing and quick-freezing on quality of sea bass during frozen storage [J]. Lwt-Food Science and Technology, 2021, 154: 112737.
- Peris, M.; Escuder-Gilabert, L. A 21st Century Technique for Food Control: Electronic noses[J]. Anal. Chim. Acta. 2009, 638(1), 1–15. DOI: 10.1016/j.aca.2009.02.009.