
 ?Mathematical formulae have been encoded as MathML and are displayed in this HTML version using MathJax in order to improve their display. Uncheck the box to turn MathJax off. This feature requires Javascript. Click on a formula to zoom.
ABSTRACT
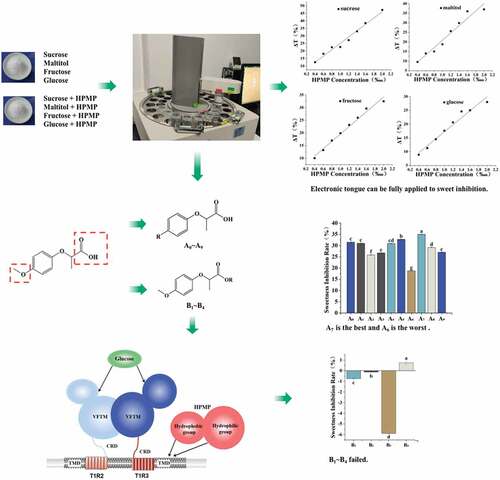
The current study applied 2-(4-methoxyphenoxy) propionic acid (HPMP) to prepare its alkylated and esterified derivatives and then investigated their corresponding sweetness inhibitory effect. The structure of these substituted derivatives were characterized by NMR and IR for ensuring their individual modification. The electronic tongue was used to predict the sweetness inhibitory effect of the derivatives, and a sweet prediction model was established via a three-dimensional measurement in term of sweetener type, sweetener and derivative concentrations. Furthermore, the interaction of sweetness inhibition with other taste properties was also studied. The current results indicated that, for alkylated derivatives, the sweetness inhibition rate of methyl-modified derivatives was higher than that of ethyl and propyl derivatives, and the inhibition rate of para-substituted derivatives was greater than that of ortho- and meta-positions. Interestingly, this study revealed that the esterification led to a minor sweetness inhibitory effect. Based on the current results, it is proposed that the ratio of hydrophobic and hydrophilic groups on the HPMP molecules plays the key role in regulating their corresponding sweetness inhibition via a binding capacity with the active site of sweet taste receptors.
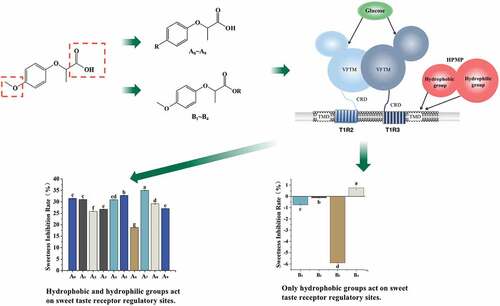
Graphical Abstract
Introduction
The formation of sweetness requires the G protein-coupled receptor (GPCR) family on the cell membrane of taste cells, which includes T1R1, T1R2 and T1R3.[Citation1,Citation2] Among them, T1R2+ T1R3 dimer is an intermediary for artificial sweeteners and sugar solutions.[Citation3] In addition, it is known that the allosteric binding sites also exist in GPCRs. One of the transmembrane domains (TMD) can interact with positive allosteric modulators (PAM) and negative allosteric modulators (NAMs).[Citation4]
Figure 1. Synthetic route of HPMP alkylated derivatives (a) and esterified derivatives (b).
The NAM has the effect of suppressing sweetness and can be used to solve the problem of over sweetness in some foods to avoiding their unacceptance due the over-sweetness. For example, lactose-free milk is sweeter than skimmed milk, because lactose is broken down into simple sugars by enzymes, and the addition of the NAM can reduce the sweetness of dairy-free milk.[Citation5] Lactitol, gymnemic acid, 2-(2,4-dichlorophenoxy) propionic acid (2,4-DP) and other compounds can be used as NAM to interact with T1R3-TMD.[Citation6–8] Furthermore, the NAM has certain medical potential in treating diabetes and lowering blood lipids. The T1R2+ T1R3 is expressed in pancreatic β cells, and the activation of this receptor induces insulin secretion through Ca2+ and cAMP-dependent mechanisms.[Citation9–12] The T1R2+ T1R3 is expressed in adipocytes and mediates anti-adipogenic signals.[Citation13,Citation14] The T1R3 inhibitor sodium lactitol increases the response of plasma glucose “area under the curve” (AUC) to glucose load.[Citation15] This effect is consistent with the reduction of insulin stimulation by T1R.[Citation16,Citation17]
Compound 2-(4-Methoxyphenoxy) Propionic acid (HPMP) is a natural substance in coffee beans, showing a significant sweetness inhibitory effect, and its small amount can improve the sweetness acceptance. It has been used in moon cakes, candies, ice cream, jams and fillings. Relevant studies have shown that the action site of lactitol has been located in the transmembrane domain of human T1R3,[Citation6] and the carboxyl group of HPMP is close in space to the hydrophilic amino acid side chain residues of transmembrane domains 3 (TM3), while the hydrophobicphenoxy group of lactitol forms a hydrophobic interaction with the hydrophobic residues of TM3 amino acid.[Citation18] Compared with (S)-2,4-DP, (S)-ibuprofen and (S)-naproxen have larger hydrophobic groups, allowing them to reach deeper positions in the T1R3-TMD ligand pocket.[Citation4] However, the mechanism of HPMP for inhibiting sweetness is still not clear so far. Therefore, the current study investigated the changes in the sweetness inhibitory effect following the modification of the positions of the hydrophobic group and carboxyl group on the benzene ring of 2-(4-methoxyphenoxy) propionic acid. The structure of HPMP, 2-(2,4-dichlorophenoxy) propionic acid, ibuprofen and naproxen is displayed in Fig. S1.
Meanwhile, electronic tongue is currently used in the evaluation of food quality and taste such as beer, apple juice, bayberry juice and tea.[Citation19–22] Compared with other sensory evaluation methods, electronic tongue technology can directly perform nondestructive testing without pre-processing samples with a higher sensitivity, a faster detection, and a higher repeatability.[Citation23] However, the study on its application in the sweet taste is rare. Therefore, in this study, 10 kinds of 2-(4-methoxyphenoxy) propionic acid benzene ring modified derivatives were synthesized by Williamson reaction and 6 kinds of its esterified derivatives were prepared by the esterification reaction (). In this study, the sweet inhibition property of each derivatives was evaluated by a developed electronic tongue methodology. More importantly, this investigation provided the understanding of the association of the structural characteristics with their corresponding sweetness inhibitory properties, which may also highlight a new approach to developing novel sweetness inhibitors.
Materials and methods
Materials
All used inorganic and organic compounds were of analytical grade. And all used sweeteners were of food grade. Sucrose was purchased from Guangxi Nanning Sugar Co., LTD, fructose from Shanxiwang Sugar Co., LTD, glucose from Xiwang Pharmaceutical Co., LTD, maltitol from Shandong Futian Pharmaceutical Co., LTD and sorbitol from Hebei Wanbang Chemical Technology Co. LTD. Compound 2- (4-methoxyphenoxy) propionic acid was from Guangzhou Yitian Biological Co., LTD. The following chemical compounds were purchased from Sinopharm Chemical Reagent Co. LTD: sodium carbonate, benzene, sulfuric acid, sodium hydroxide, silver chloride, potassium chloride, tartaric acid, sodium chloride, calcium chloride, potassium carbonate. The following compounds were obtained from Shenzhen Runyou Chemical Co., LTD: p-methoxy phenol, o-methyl phenol, o-ethyl phenol, o-propyl phenol, m-methyl phenol, m-ethyl phenol, p-methyl phenol, p-ethyl phenol, phenol. The following chemicals were from Shenzhen Runhui Biotechnology Co., LTD: m-propyl phenol, p-propyl phenol, and the following chemicals from Guangzhou Qianhui Glass Instrument Co., LTD: propanol, isopropanol, butanol and isobutanol.
Synthesis of HPMP derivatives
Compounds 2-(4-methoxyphenoxy) propionic acid alkylated derivatives were referred to be A0 to A9, respectively. The esterified derivatives were named to be B1 to B4, respectively. Their purity was analyzed to be 98.7%. The synthetic pathways of A0 and B1 were used to illustrate the synthetic methods of derivatives.
HPMP alkylated derivatives
The derivatives were prepared following a previous method[Citation24] with some modifications. In brief, phenol, sodium hydroxide, 2-chloropropionic acid and water were mixed at a mass ratio of 1:1.2:2:1.5, and then tetrabutylammonium bromide and benzene were added to make the ratio of water phase to organic phase 1:1. The reaction was performed at 50°C for 3.5 h, and then HCl solution was dropped into the mixture solution to make the pH 1 ~ 2. After static stratification, the aqueous phase and the organic phase were separated, and the organic phase was evaporated to obtain the white crystal. An appropriate amount of NaOH solution was used to re-dissolve the white crystals, and then adjusted the pH to 9 ~ 10. Once again, its pH was adjusted to be 1 ~ 2 using the HCl solution. After standing for 3 h, the temperature was set 4°C to precipitate the white sheet crystals. The re-crystallization procedure was repeated 4 times to prepare the derivatives with a desired purity. The procedure of the synthesis of other derivatives was the same as above.
HPMP esterified derivatives
The compounds were prepared following a published method[Citation25] with some modifications. In brief, 4 g of 2-(4-methoxyphenoxy) propionic acid, 10 mL of methanol and 2 mL of concentrated sulfuric acid were added to a three-mouth flask with magnetic stirring. After refluxing for 3 h, the reaction was monitored by TLC until 2-(4-methoxyphenoxy) propionic acid in the system was disappeared. The excess ethanol in the reaction was removed by vacuum distillation. Adding 15 mL ethyl ether, washing with water (10 mL×2), and then washing with saturated sodium bicarbonate (10 mL×2) until the aqueous layer became alkaline, and drying with anhydrous copper sulfate. The light-yellow liquid was obtained after filtration and vacuum distillation. The re-crystallization procedure was repeated 4 times as mentioned above.
Structural characteristics of the HPMP derivatives
The structural characteristics of each corresponding derivative were analyzed by FT-IR and NMR. In brief, the compound with 5 mg was mixed with potassium bromide, and then pressed to be a tablet. The spectrum was recorded followed by scanning on a Fourier transform infrared spectrometer (Bruker, VERTEX 33, Germany) with a range of 500 ~ 4000 cm−1. Weighed 20 mg of the compound, and dissolved it in 0.6 mL of deuterated chloroform, and then a 1H-NMR resonance frequency of 600 MHz was applied via a 400 M superconducting NMR spectrometer (Bruker, AVANCE III HD 400, Germany).
Sweetness inhibitory evaluation model
Sensory evaluation of the sweetness by panel test: The sensory evaluation volunteers were recruited, including 10 male students and 10 female students in a health condition. The volunteers were provided with sensory training prior to the test, and the sweetness is divided into 5 grades.[Citation26] Different grades corresponded to different concentrations of the sucrose solutions as shown in Table S1. For non-sucrose sweeteners, the sweetness of these 5 concentrations of the sucrose solution was also used as a reference for scoring. In brief, volunteers used 20 mL of the reference solution to rinse their mouths. After 15s, the volunteers were informed of the sweetness classification and the sweetness of the reference solution. After rinsing the mouth with pure water until no sweetness in the mouth, test another one every 15 minutes following the same procedure.[Citation27]
Sensory evaluation of the sweetness by electronic tongue: Taste Sensing System SA-402B (Insent, Atsugi-shi, Japan) is composed of a host, a sensor set and an operation computer. The taste sensor consists of sensor probe main body, artificial lipid membrane, Ag/AgCl electrode and pin jack type electrode terminal. The AAE, CT0, CA0, AE1, C00 and GL1 were used to test umami, saltiness, sourness, astringency, bitterness and sweetness, respectively.
Prior to the measurement, the sensor needs to be activated. To ensure the stability and accuracy of the sensor output signal, a sensor check was required before the measurement. A number of 10 samples could be tested at a time. The sensor was immersed in a positive solution to remove the adsorbed substances on the sensor, and then washed by reference solution to ensure that the sensor response output reaching an equilibrium. Sweetness and sourness, bitterness, astringency, umami and saltiness were tested separately, and each test was performed in 5 triplicates.
Establishment of sweetness prediction model: Sweetener of sucrose, glucose, fructose and maltitol was applied, and their corresponding solution was prepared with 6 concentrations, respectively, as shown in Table S2. The least squares method was used to fit the fitting point set, and the relationship between the electronic tongue sweetness and the panel sensory test was established for obtaining a sweetness regression prediction model.
Establishment of sweetness inhibitory evaluation model: The response value of the reference for the electronic tongue evaluation was set to be 0, and the response value for the sweetener was recorded as T0. The response value after adding the sweetness inhibitor was referred as Ts, which reflecting the difference between pure water and sweetener solution plus sweetness inhibitor. The sweetness inhibition rate Tr was used to evaluate the sweetness inhibition effect of each derivative. Sucrose, maltitol, fructose and glucose solutions of 25% were used as a blank. The HPMP was added into above individual sugar solution with a mass fraction of 0.40 ‱, 0.60 ‱, 0.80 ‱, 1.00 ‱, 1.20 ‱, 1.40 ‱, 1.60 ‱ and 2.00 ‱, respectively, as a control group, and its Tr was measured and its corresponding sweetness inhibition rate was calculated. The model was built by the least square method, and the sweet inhibition rate ΔT was used to evaluate the sweet inhibition effect of the derivatives. The calculation formula is as follows:
Evaluation of derivatives sweetness inhibitory effect
A concentration of 25% of individual sucrose, fructose, glucose, maltitol and sorbitol was prepared and referred as the blank group, respectively. The group with the addition of each derivative with a mass fraction of 1.40‱ into above solution was referred to be the experimental one. The sweetness value of each sample was measured by the electronic tongue in 5 triplicates. Sucrose fatty acid esters were used in the evaluation of the esterified derivatives for ensuring their solubility.
For alkylated derivatives, there were two other additional tests. Firstly, sucrose solutions with mass fractions of 10%, 15%, 20%, 25%, and 30% were used as the blank group, respectively, and then the group with the addition of each alkylated derivative with a mass fraction of 1.40‱ into above sucrose solutions were referred as the experimental one, respectively.
Secondly, a sucrose solution with a mass fraction of 25% was prepared as a blank group, and then the group with the addition of each modified benzene ring derivatives with a mass fraction of 0.80‱, 1.40‱, 1.60‱, and 2.00‱ into sucrose solution was referred as the experimental one, respectively.
Other taste property during the sweetness inhibition process
Prepared a 1.40‱ derivatives solution and tested all the taste property including sweetness, sour, bitter, astringent, umami and salty response of the solution, respectively. Prepared a 25% sucrose solution and added 1.40‱ derivatives, respectively, and tested all the taste parameters mentioned above except the sweetness.
Statistical analysis
The SPSS Statistics 22.0 software was used for statistical analysis, and Duncan test was performed for multiple comparisons. P < .05 indicates a statistically significant difference. Origin 2021 and Excel 2018 software were used for the drawing of the figures.
Results and discussion
Structural characteristics of the synthesized derivatives
A0: IR (KBr) v, cm−1: 3067, 2997, 2947, 1708, 1226, 739. 1H NMR (600 MHz, CDCl3) δ 7.44–6.99 (m, 2 H), 6.95–6.53 (m, 2 H), 4.78 (q, J = 6.8 Hz, 1H), 2.28 (s, 3 H), 1.67 (d, J = 6.8 Hz, 3 H).
A1: IR (KBr) v, cm−1: 3030, 2993, 2970, 1710, 1236, 750. 1H NMR (600 MHz, CDCl3) δ 7.18 (dd, J = 7.4, 1.7 Hz,1H), 7.13 (td, J = 7.8, 1.8 Hz, 1H), 6.94 (td, J = 7.4, 1.1 Hz, 1H), 6.73 (d, J = 8.1 Hz, 1H), 4.80 (q, J = 6.8 Hz, 1H), 2.69 (q, J = 7.6 Hz, 2 H), 1.67 (dt, J = 6.8, 1.4 Hz, 3 H), 1.22 (t, J = 7.6 Hz, 3 H).
A2: IR (KBr) v, cm−1: 3046, 2971, 2957, 1707, 1236, 749. 1H NMR (600 MHz, CDCl3) δ 7.16 (dd, J = 7.4, 1.7 Hz,1H), 7.13 (td, J = 7.7, 1.7 Hz, 2 H), 6.93 (tt, J = 7.4, 1.0 Hz, 1H), 6.73 (d, J = 8.1 Hz, 1H), 4.79(q, J = 6.8 Hz, 1H), 2.69–2.58 (m, 2 H), 1.66 (dd, J = 6.9, 1.0 Hz, 3 H), 1.67–1.58 (m, 4 H), 0.95 (td, J = 7.4, 1.0 Hz, 3 H).
A3: IR (KBr) v, cm−1: 3033, 2992, 2937, 1711, 1235, 1159, 768. 1H NMR (600 MHz, CDCl3) δ 7.17 (t, J = 7.9 Hz, 1H), 6.82 (ddt, J = 7.5, 1.7, 0.8 Hz, 1H), 6.73 (t, J = 2.1 Hz, 1H), 6.69 (dd, J = 8.2, 2.6 Hz, 1H), 4.79 (q, J = 6.9 Hz, 1H), 2.32 (d, J = 0.8 Hz, 3 H), 1.65 (d, J = 6.9 Hz, 3 H).
A4: IR (KBr) v, cm−1: 3011, 2995, 2928, 1717, 1229, 818. 1H NMR (600 MHz, CDCl3) δ 7.19 (t, J = 7.9 Hz, 1H), 6.85 (ddd, J = 7.5, 1.7, 0.9 Hz, 1H), 6.77 (t, J = 2.1 Hz, 1H), 6.69 (ddd, J = 8.2, 2.7, 0.9 Hz, 1H), 4.80 (q, J = 6.9 Hz, 1H), 2.62 (q, J = 7.6 Hz, 2 H), 1.65 (d, J = 6.8 Hz, 3 H), 1.22 (t, J = 7.7 Hz, 3 H).
A5: IR (KBr) v, cm−1: 3075, 2961, 2930, 2867, 1708, 1227, 1110, 773, 752, 692. 1H NMR (600 MHz,CDCl3) δ 7.19 (t, J = 7.9 Hz, 1H), 6.83 (ddt, J = 7.6, 1.6, 0.8 Hz, 1H), 6.74 (t, J = 2.0 Hz, 1H), 6.70 (dt, J = 8.2, 1.7 Hz, 1H), 4.84–4.74 (m, 1H), 2.55 (dd, J = 8.5, 6.8 Hz, 2 H), 1.81–1.41 (m, 5 H), 0.92 (t, J = 7.3 Hz,3 H).
A6: IR (KBr) v, cm−1: 3041, 2995, 2928, 1717, 1229, 818. 1H NMR (600 MHz, CDCl3) δ 7.10–7.05 (m, 2 H), 6.92–6.60 (m, 2 H), 4.75 (q, J = 6.8 Hz, 1H), 2.28 (s, 3 H), 1.64 (d, J = 6.9 Hz, 3 H).
A7: IR (KBr) v, cm−1: 3022, 2973, 2828, 1700, 1237, 825. 1H NMR (600 MHz, CDCl3) δ 7.13–7.08 (m, 1H), 6.85–6.79 (m, 1H), 4.75 (q, J = 6.8 Hz, 1H), 2.59 (q, J = 7.6 Hz, 1H), 1.64 (d, J = 6.9 Hz, 2 H), 1.20 (t, J = 7.6 Hz, 2 H).
A8: IR (KBr) v, cm−1: 3034, 2996, 2967, 1710, 1216, 829. 1H NMR (600 MHz, CDCl3) δ 7.16–6.95 (m, 1H), 6.90–6.60 (m, 1H), 2.52 (dd, J = 8.5, 6.8 Hz, 1H), 1.64 (d, J = 6.9 Hz, 1H), 1.63–1.55 (m, 1H), 0.92 (t, J = 7.3 Hz, 1H).
A9: IR (KBr) v, cm−1: 3065, 3034, 2962, 2933, 1710, 1231, 840. 1H NMR (600 MHz, CDCl3) δ 7.31–7.26 (m, 1H), 6.92–6.85(m, 1H), 4.79 (q, J = 6.8 Hz, 1H), 1.66 (d, J = 6.8 Hz, 2 H).
B1: IR (KBr) v, cm−1: 3018, 2992, 2952, 2915, 2833, 1757, 1234, 1136. 1H NMR (600 MHz, CDCl3) δ 6.99–6.54 (m,4 H), 4.67 (q, J = 6.9 Hz, 1H), 3.74 (dt, J = 3.9, 2.1 Hz, 6 H), 1.59 (ddd, J = 6.9, 2.7, 1.4 Hz,3 H).
B2: IR (KBr) v, cm−1: 3053, 2991, 2936, 2911, 2836 1732, 1226, 1136, 1036 826. 1H NMR (600 MHz, CDCl3) δ 7.03–6.49 (m,4 H), 4.64 (qdd, J = 6.6, 3.7, 2.0 Hz, 1H), 4.38–4.01 (m, 2 H), 3.71 (dt, J = 8.3, 2.4 Hz, 3 H), 1.77–1.38 (m, 3 H), 1.36–0.76 (m, 3 H).
B3: IR (KBr) v, cm−1:3056, 2995, 2946, 2834, 1719, 1448, 1290, 1228, 1138, 1043, 820. 1H NMR (600 MHz, CDCl3) δ 7.00–6.56 (m,4 H), 4.67 (q, J = 6.8 Hz, 1H), 4.30–3.96 (m, 2 H), 3.75 (d, J = 3.2 Hz, 3 H), 1.85–1.43 (m,5 H), 0.88 (t, J = 7.4 Hz, 3 H).
B4: IR (KBr) v, cm−1: 3051, 2965, 2880, 1710, 1751, 1280, 1230, 1136, 823. 1H NMR (600 MHz, CDCl3) δ 6.85–6.82 (m,2 H), 6.82–6.78 (m, 2 H), 4.66 (q, J = 6.7 Hz, 1H), 4.14 (qt, J = 10.8, 6.7 Hz, 2 H), 3.75 (dd, J = 3.1, 1.3 Hz, 3 H), 1.59 (dd, J = 6.7, 2.5 Hz, 5 H), 1.37–1.23 (m, 2 H), 0.89 (td, J = 7.4, 1.9 Hz, 3 H).
All the infrared spectra of A0~ A3 had vibrational peaks at 2500–3300 cm−1, and the center was 3000 cm−1, which was the vibrational absorption peak of the hydroxyl group on the carboxyl group (). The absorption peak at 1720 cm−1 was the vibration peak of the carbonyl group, indicating that the substances shown in A0~ A3 were all carboxylic acids. Vibrations at 1236 cm−1 suggested the Ar-O stretching, implying that the compounds A0~ A3 were all ethers. Among them, compounds A1~ A3 had a peak around 750 cm−1, suggesting that they were ortho-disubstituted. Compound A0 had a peak around 720 cm−1, indicating that it was monosubstituted on the benzene ring. In contrast, compounds B1~ B4 all contained peaks around 3050 cm−1, which were the C-H stretching vibrations of the aromatic rings, indicating that the substances represented by B1-B4 all belonged to aromatic compounds. Furthermore, there were two peaks in the range of 1000 ~ 1300 cm−1, which were the stretching vibrations of Ar-O bonds, showing that compounds B1~ B4 contained two Ar-O bonds. Meanwhile, the 1H NMR spectra clearly indicated the functional groups in the structures of HPMP derivatives (), in which the hydrogen peaks on the benzene rings of A0~ A3 appeared at 7 ppm. The attached hydrogen peaks were at 5 ppm, and the remaining hydrogen peaks were consistent with the type and number of leftover hydrogens on the derivatives. Meanwhile, compounds B1~ B4 also exhibited similar hydrogen peak characteristics as the substituted derivatives. In summary, all the spectral data was in accordance with the structures of corresponding derivatives. Among them, compound A6 was found to be a new one, which was not reported in the literature.
Figure 2. FT-IR spectra of HPMP derivatives (a) A0 – A3 and (b) B1 – B4.
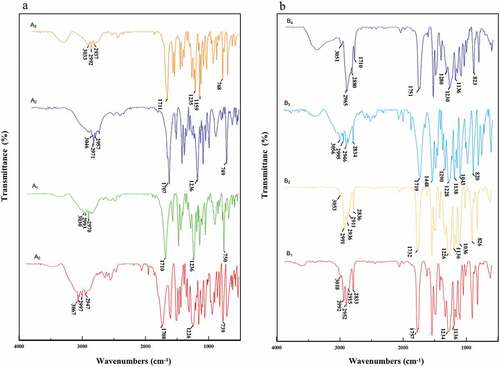
Figure 3. 1H NMR spectra of HPMP derivatives (a) A0 – A3 and (b) B1 – B4.
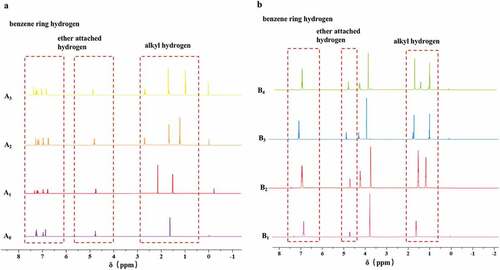
Figure 4. Evaluation model achieved by electronic tongue for sweetness evaluation (a), for sweetness inhibition (b), respectively.
Establishment of sweetness prediction and sweetness inhibition evaluation model
Sweet inhibitory effect and its interaction with other tastes of the derivatives were also investigated for exploring the structure-activity relationship of the HPMP following the esterification and alkylation. Using the established sweetness prediction model, the electronic tongue study indicated the order of the sweetness of the substrates as follows: fructose>sucrose>maltitol>glucose, which was consistent with the actual sweetness intensity of each substrate (). The sweetness measured by the electronic tongue method and the taste method of the four sweeteners showed a better fitting trend, in which the fitting curve R2 as shown in Table S3 ranged from 0.97669 to 0.99375, indicating that the sensory sweetness had a positive correlation with the electronic tongue sweetness. Furthermore, using the established the evaluation model of the sweetness inhibition, the inhibition rate of each sweetener was: sucrose>maltitol>fructose>glucose, suggesting that HPMP had a greater sweetness inhibitory activity against sucrose. This also confirmed that sucrose was the main sweetness carrier for subsequent experiments. Meanwhile, this study also noted that the sweetness inhibition rate had a positive correlation with the concentration of HPMP, which was consistent with a previous study.[Citation28] Therefore, this also verified that the electronic tongue methodology provided a potent method for sweet taste inhibition study.
Difference in the sweetness inhibitory effects of alkylated derivatives and esterified derivatives
Previous study indicated that the formation of sweet taste requires a family of GPCRs on the taste cell membrane, which are single-chain polypeptides consisting of alternating hydrophilic and hydrophobic regions,[Citation18] and the hydrophobic region essentially defines the transmembrane region of the receptor.[Citation24] At present, the action site of HPMP has been defined as the transmembrane domain of T1R3 on human GPCRs. Firstly, we studied the inhibitory effect of alkylated derivatives on sweeteners from three dimensions: sweetener type, sweetener concentration and derivative concentration (). The current study found that the sweetener inhibition rate for each substrate was as follows: sucrose>maltitol>fructose>glucose>sorbitol. As shown in , the greater the steric hindrance of the sweetener, and the more hydrophilic of the groups. Furthermore, this study also revealed that, if the sweetener had a less ability to bind with the receptor, a stronger sweet inhibition effect could be achieved in term of compounds A0~ A9 as shown in . Meanwhile, the current study also noted that, when the concentration of A0~ A9 increased, the degree of sweetness inhibition first increased and then stabilized.
Figure 5. Influence of esterified derivatives on sweetness inhibitory property of different sweetener. a: sweetener type, b: sweetener concentration, c: derivative concentration, d: various derivatives.
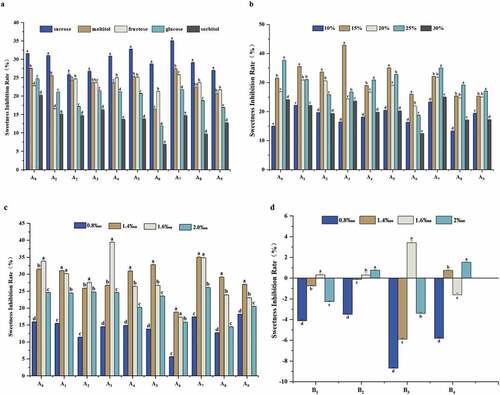
Figure 6. Molecular structure and its corresponding hydrophilicity of different sweetener.
This study indicated that the alkylated derivatives of HPMP demonstrated a certain sweet inhibitory ability. More importantly, the sweetness inhibition rate of methyl-modified derivatives was higher than that of ethyl and propyl, and the sweetness inhibition rate of para-modified derivatives was greater than that of ortho and meta-position. A previous report[Citation4] suggested that the binding pocket of sweet receptors can accommodate the compounds with different sizes for inhibiting its sweetness, and the appropriate size of the hydrophobic space may be crucial to maintain a higher sweet inhibitory activity. Combined with this point of view, it may be inferred that the modification of hydrophobic groups with less steric hindrance at the para-position of HPMP was more conducive to the improvement of the sweet taste inhibition effect. This is the first report to demonstrate, in which, according to current experiment results, the sweetness inhibition rule of each alkylated derivative was as follows: methyl>ethyl>propyl for para-substitution substrates, ethyl>methyl>propyl for meta-substitution substrates, methyl> base>propyl>ethyl for ortho-substitution substrates. The sweet inhibitory effect exhibited the greatest and the least for A7 and A6 derivatives, respectively.
Furthermore, considering that the replacing of the hydrophobic group on the benzene ring of HPMP might have a certain effect on enhancing the sweetness inhibition effect, the destroying of the hydrophilic group on HPMP may enhance the sweetness inhibitory effect of the derivatives. Interestingly, the current study on the esterified HPMP for exploring its sweetness inhibitory effect found that the derivatives with damaged carboxyl groups had almost no sweetness inhibitory effect on the selected sweeteners, and the inhibition rates were all below 5%. The NAMs as shown in Fig. S1 also contain carboxyl groups. Therefore, it really confirmed the importance of the carboxyl group for exerting the sweet suppressing effect. Meanwhile, it also indicated that the hydrophobic group is not the only factor for affecting the sweetness inhibition effect.
In summary, both the hydrophobic groups of alkylated derivatives and the sweetener competition with the same active site of the sweet receptor demonstrated their roles on the sweetness inhibitory effect. The reduced hydrophilic carboxyl group led to the disappearance of sweet inhibition ability, which might be due to the loss of the binding capacity for the active site of sweet taste receptor. Therefore, based on above results, it is proposed that the ratio of hydrophobic and hydrophilic groups on HPMP plays one of the key roles in the regulation of their corresponding sweetness inhibition.
Taste analysis of alkylated derivatives and esterified derivatives
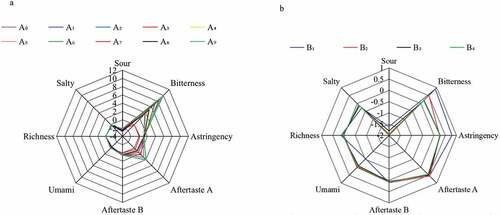
The electronic tongue was used to evaluate other taste properties of the alkylated and esterified derivatives of HPMP, and the result was shown in . The HPMP alkylated derivative itself had almost no sweetness, saltiness, umami and astringency, but with a minor sourness, which was measured by the electronic tongue with below 3. However, this study found that all the alkylated derivatives had obvious bitterness and astringency aftertaste, specifically propyl>ethyl>methyl. This seems to indicate that there is a certain correlation between bitterness and hydrophobicity, and the stronger the hydrophobicity, the more pronounced bitterness. The esterified derivatives of HPMP itself basically had no sweet, salty, umami and astringent tastes, but demonstrated a slight sour and bitter taste. Therefore, neither group modification will impact other tastes to the sweetener.
Figure 7. Tasting property of the HPMP alkylated derivatives (a) and esterified derivatives (b).
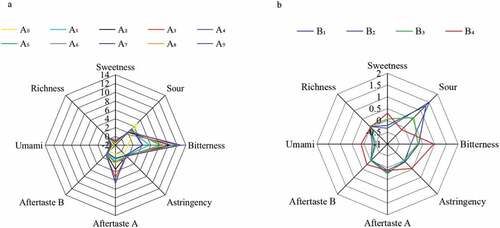
In order to investigate whether each derivative caused the above disliked taste when used, other taste indicators except sweetness of the sucrose solution containing different derivatives were further measured, and the result is shown in . Compared with a pure sucrose solution, the sucrose solution added with HPMP derivatives A0~A9 had an enhanced bitterness and astringency aftertaste, and the astringency aftertaste was below 5, indicating its minor effect on the taste of the sweetener itself. Meanwhile, the bitterness caused by methyl and ethyl modified derivatives was around 5, while the bitterness caused by propyl modified derivatives was more than 5 or even close to 10, suggesting its greater impact on the taste of the sweetener. Compared with the control of the sucrose solution, the addition of HPMP derivatives B1~B4 led to an increased bitterness and astringency of the sucrose solution, but with a value of less than 1, and a value of −2 was obtained for the sourness measurement.
Figure 8. Non-sweet taste property of HPMP alkylated derivatives (a) and esterified derivatives (b) on sucrose.
Conclusion
In this study, based on the synthesis of various HPMP alkylated derivatives and esterified derivatives, their corresponding sweetness inhibitory effect of HPMP alkylated derivatives A0~ A9 and esterified derivatives B1~ B4 was investigated using an electronic tongue. The results revealed that the alkylated derivatives exerted the sweet taste inhibitory effect through a competitive inhibitory mechanism. The stronger the hydrophobicity and the smaller the steric hindrance, the greater the competitiveness of the sweet receptors. More importantly, this study also found that compounds A7 and A6 had the greatest and least sweet inhibitory effects. Meanwhile, this research also noted that the hydrophobicity and steric hindrance of the functional group on the esterified derivatives were not the only factors for affecting the sweetness inhibitory effect, because the esterified derivatives with the destroyed carboxyl group and the remaining of its hydrophobic group almost lost its sweetness-inhibiting ability, indicating that the hydrophilic carboxyl group also demonstrated great influence on the regulation of the sweetness inhibition effect. Therefore, it is inferred that the binding region of sweet inhibitors and sweet receptors is divided into two regions in term of hydrophobic and hydrophilic ones. The reduced hydrophilicity is likely to prevent the sweet inhibitors from binding with the sweet receptors, thereby negatively influencing its corresponding sweetness inhibitory effect. Therefore, the exploration of how to achieve a balanced ratio of the hydrophilic groups and hydrophobic groups in the derivatives and their corresponding binding capacity with the sweet receptors are the key parameters for managing their sweetness inhibitory effect. In addition, the derivatives of HPMP itself basically had no other taste, but the propyl-modified derivatives exhibited a relatively stronger bitter taste during the sweetness inhibition process. Based on the current results, a structurally manipulated sweetness inhibitory mechanism is proposed ().
Figure 9. A proposed sweetness inhibitory mechanism.
Supplemental Material
Download ()Acknowledgments
This Research was financially supported by the National Natural Science Foundation of China (No.31972010).
Disclosure statement
No potential conflict of interest was reported by the author(s).
Supplementary material
Supplemental data for this article can be accessed online at https://doi.org/10.1080/10942912.2022.2154610
Additional information
Funding
References
- Gilbertson, T. A.; Damak, S.; Margolskee, R. F. The Molecular Physiology of Taste Transduction. Curr. Opin. Neurobiol. 2000, 10(4), 519–527. DOI: 10.1016/s0959-4388(00)00118-5.
- Matsunami, J. P.; Matsunami, H. Receptors for Bitter and Sweet Taste. Curr. Opin. Neurobiol. 2002, 12, 366–371. DOI: 10.1016/S0959-4388(02)00345-8.
- Zuker, C. S.; Zhao, G. Q.; Zhang, Y. F.; Hoon, M. A.; Chandrashekar, J.; Erlenbach, I.; Ryba, N. J. P. The Receptors for Mammalian Sweet and Umami Taste. Cell. 2003, 115(3), 255–266. DOI: 10.1016/S0092-8674(03)00844-4.
- Nakagita, T.; Taketani, C.; Narukawa, M.; Hirokawa, T.; Kobayashi, T.; Misaka, T. Ibuprofen, a Nonsteroidal anti-inflammatory Drug, Is a Potent Inhibitor of the Human Sweet Taste Receptor. Chem. Senses. 2020, 45(8), 667–673. DOI: 10.1093/chemse/bjaa057.
- Ohmiya, K.; Ohashi, H.; Kobayashi, T.; Shimizu, S. Hydrolysis of Lactose by Immobilized Microorganisms. Appl. Environ. Microbiol. 1977, 33, 137–146. DOI: 10.1128/AEM.33.1.137-146.1977.
- Maillet, E. L.; Margolskee, R. F.; Mosinger, B. Phenoxy Herbicides and Fibrates Potently Inhibit the Human Chemosensory Receptor Subunit T1R3. J. Med. Chem. 2009, 52(21), 6931–6935. DOI: 10.1021/jm900823s.
- Sanematsu, K.; Kusakabe, Y.; Shigemura, N.; Hirokawa, T.; Nakamura, S.; Imoto, T.; Ninomiya, Y. Molecular Mechanisms for sweet-suppressing Effect of Gymnemic Acids. J. Biol. Chem. 2014, 289(37), 25711–25720. DOI: 10.1074/jbc.M114.560409.
- Servant, G.; Tachdjian, C.; Li, X. D.; Karanewsky, D. S. The Sweet Taste of True Synergy: Positive Allosteric Modulation of the Human Sweet Taste Receptor. Trends Pharmacol. Sci. 2011, 32(11), 631–636. DOI: 10.1016/j.tips.2011.06.007.
- Maud, S.; Anne, B.; Wolfgang, M.; Loïc, B. Sweet-taste-suppressing Compounds: Current Knowledge and Perspectives of Application. Appl. Microbiol. Biotechnol. 2012, 96, 619–630. 10.1007/s00253-012-4387-3.
- Dyer, J.; Salmon, K. S.; Zibrik, L.; Shirazi-Beechey, S. P. Expression of Sweet Taste Receptors of the T1R Family in the Intestinal Tract and Enteroendocrine Cells. Biochem. Soc. Trans. 2005, 33, 302–305.
- Kojima, I.; Nakagawa, Y.; Nagasawa, M.; Yamada, S.; Hara, A.; Mogam, H.; Nikolaev, V. O.; Lohse, M. J.; Shigemura, N.; Ninomiya, Y. Sweet Taste Receptor Expressed in Pancreatic β-cells Activates the Calcium and Cyclic AMP Signaling Systems and Stimulates Insulin Secretion. Plos One. 2009, 4, e5106. DOI: 10.1371/journal.pone.0005106.
- Nakagawa, Y. Function of Sweet Taste Receptor in Pancreatic beta-cells. Seikagaku J Japanese Biochem Soc. 2011, 83(7), 647–651.
- Masubuchi, Y.; Nakagawa, Y.; Ma, J. H.; Sasaki, T.; Kitamura, T.; Yamamoto, Y.; Kurose, H.; Kojimal, I.; Shibata, H. A Novel Regulatory Function of Sweet Taste-Sensing Receptor in Adipogenic Differentiation of 3T3-L1 Cells. Plos One. 2013, 8, (1).
- Simon, B. R.; Parlee, S. D.; Learman, B. S.; Mori, H.; Scheller, E. L.; Cawthorn, W. P.; Ning, X. M.; Gallagher, K. A.; Tyrberg, B.; Assadi-Porter, F. M., et al. Artificial Sweeteners Stimulate Adipogenesis and Suppress Lipolysis Independently of Sweet Taste Receptors. J. Biol. Chem. 2013, 288(45), 32475–32489. DOI: 10.1074/jbc.M113.514034.
- Gerspach, A. C.; Steinert, R. E.; Schonenberger, L.; Graber-Maier, A.; Beglinger, C. The Role of the Gut Sweet Taste Receptor in Regulating GLP-1, PYY, and CCK Release in Humans. Am J Physiol-Endocrinol Metab. 2011, 301(2), E317–E325. DOI: 10.1152/ajpendo.00077.2011.
- Galindo-Cuspinera, V.; Breslin, P. A. S. The Liaison of Sweet and Savory. Chem. Senses. 2006, 31(3), 221–225. DOI: 10.1093/chemse/bjj022.
- Hamano, K.; Nakagawa, Y.; Ohtsu, Y.; Li, L.; Medina, J.; Tanaka, Y.; Masuda, K.; Komastsu, M.; Kojima, I. Lactisole Inhibits the glucose-sensing Receptor T1R3 Expressed in Mouse Pancreatic beta-cells. J. Endocrinol. 2015, 226(1), 57–66. DOI: 10.1530/JOE-15-0102.
- Xia, Y.;. Probing the Ligand Binding Pocket within the Transmembrane Domain of Human T1R3. Mount Sinai School of Medicine: New York. 2011, 45–57.
- He, W.; Hu, X. S.; Zhao, L.; Liao, X. J.; Zhang, Y.; Zhang, M. W.; Wu, J. H. Evaluation of Chinese Tea by the Electronic Tongue: Correlation with Sensory Properties and Classification according to Geographical Origin and Grade Level. Food Res. Int. 2009, 42(10), 1462–1467. DOI: 10.1016/j.foodres.2009.08.008.
- Kovacs, Z.; Sipos, L.; Szoellosi, D.; Kokai, Z.; Szekely, G.; Fekete, A. Electronic Tongue and Sensory Evaluation for Sensing Apple Juice Taste Attributes. Sen Lett. 2011, 94, 1273–1281. DOI:10.1166/sl.2011.1687.
- Polshin, E.; Rudnitskaya, A.; Kirsanov, D.; Lammertyn, J.; Nicolai, B.; Saison, D.; Delvaux, F. R.; Legin, A. Instrumental Measurement of Beer Taste Attributes Using an Electronic Tongue. Analytica Chimica Acta. 2009, 646, 111–118. 10.1016/j.aca.2009.05.008.
- Yu, H.; Zhang, Y.; Zhao, J.; Tian, H. Taste Characteristics of Chinese Bayberry Juice Characterized by Sensory Evaluation, Chromatography Analysis, and an Electronic Tongue. J. Food Sci. Technol. Mysore. 2018, 55(5), 1624–1631. DOI: 10.1007/s13197-018-3059-4.
- Szoellosi, D.; Kovacs, Z.; Gere, A.; Sipos, L.; Kokai, Z.; Fekete, A. Sweetener Recognition and Taste Prediction of Coke Drinks by Electronic Tongue. IEEE Sen. J. 2012, 12(11), 3119–3123. DOI: 10.1109/jsen.2012.2187050.
- Williams, J. D.; Torhan, M. C.; Neelagiri, V. R.; Brown, C.; Bowlin, N. O.; Di, M.; McCarthy, C. T.; Aiello, D.; Peet, N. P.; Bowlin, T. L., et al. Synthesis and structure-activity Relationships of Novel Phenoxyacetamide Inhibitors of the Pseudomonas Aeruginosa Type III Secretion System (T3SS). Bioorg. Med. Chem. 2015, 23(5), 1027–1043. DOI: 10.1016/j.bmc.2015.01.011.
- Yang, Z. C.; Cui, X. B.; Jing, G. Esterification–distillation of Butanol and Acetic Acid . J Chem Industry Eng. 1998, 53, 2081–2088. DOI: 10.1016/S0009-2509(98)00020-7.
- Takagi, S.; Toko, K.; Wada, K.; Ohki, T. Quantification of Suppression of Bitterness Using an Electronic Tongue. J. Pharm. Sci. 2001, 90(12), 2042–2048. DOI: 10.1002/jps.1155.abs.
- Hashimoto, Y.; Matsunaga, C.; Tokuyama, E.; Tsuji, E.; Uchida, T.; Oyada, H. The Quantitative Prediction of bitterness-suppressing Effect of Sweeteners on the Bitterness of Famotidine by sweetness-responsive Sensor. Chem. Pharm. Bull. 2007, 55(5), 739–746. DOI: 10.1248/cpb.55.739.
- Mathlouthi, M.; Angiboust, J. F.; Kacurakova, M.; Hooft, R. W. W.; Kanters, J. A.; Kroon, J. Structural Studies on Sweet Taste Inhibitors: Lactisole, DL-2(4-methoxyphenoxy)-propanoic Acid. J. Mol. Struct. 1994, 326, 25–34. DOI: 10.1016/0022-2860(94)08328-2.