
 ?Mathematical formulae have been encoded as MathML and are displayed in this HTML version using MathJax in order to improve their display. Uncheck the box to turn MathJax off. This feature requires Javascript. Click on a formula to zoom.
ABSTRACT
The objective of the current research is to explore the nutritional, structural, and sensorial properties of bulgur prepared from different wheat cultivars. For the purpose, three different wheat cultivars, i.e., Dilkash-2020, Akbar-2019, and Anaj-2017, were procured and evaluated for their physicochemical characteristics using respective methods. In addition, structural properties of product (bulgur) were characterized through Fourier Transform Infrared spectroscopy. Results elucidated that physicochemical characteristics of Dilkash-2020 were significantly (p ≤ .05) higher as compared to Akbar-2019, followed by Anaj-2017. Moreover, autoclave technique retained the nutritional profile of bulgur as compared to traditional cooking methods. It is observed that protein (12.7 ± 0.04%), fibers (12.5 ± 0.07%), minerals contents and antioxidant activity were significantly improved in bulgur (Dilkash-2020) processed through autoclave. Additionally, autoclave method retained the nutritional profile and antioxidant activity of bulgur. The mineral composition of bulgur revealed that calcium content in bulgur ranged from 368 ± 0.02–532 ± 0.00 mg/kg, potassium (745 ± 0.05–948 ± 0.03 mg/kg), iron (30 ± 0.04–53 ± 0.01 mg/kg) and sodium (168 ± 0.03–318 ± 0.11 mg/kg). In FTIR spectra, different phytochemical groups were identified especially alkene, halo, alcohol, organic-nitro, carbon aromatic and thiol groups. Furthermore, sensorial scores of bulgur prepared from autoclave were also higher than traditional method. In addition, overall acceptability of Dilkash-2020 bulgur was higher as compared to other varieties. Conclusively, wheat Dilkash-2020 has significant potential for bulgur production and autoclave is an effective method to retain the nutritional profile of bulgur.
Introduction
Cereal grains have been the permanent component of the human diet and have been a significant cause in forming human civilization for thousands of years. In both developing and industrialized countries, cereals are key sources of nutrients and staple foods.[Citation1] C-2: References should be number format. Wheat (Triticum spp. L.) has become the world’s leading food in terms of calories and nutrition. One of the main factors contributing to wheat’s predominance is its versatility, which enables it to be the primary component in a wide variety of goods.[Citation2] Bulgur, a non-paste wheat product, is frequently used in most cuisines or offered as the main course. Turkish, Middle Eastern, Central Asian, and North African cuisines all use bulgur, an ancient parboiled dry, partially debranned wheat product. Currently, it is a well-known wheat product all over the world including the United States, Europe, Australia, Japan, China and Russia.[Citation3] Turkey is the world’s biggest producer of bulgur, producing 459,174 tons in 2018.[Citation4]
Bulgur is commercially produced worldwide as it belongs to the category of ready-to-eat or semi-ready-to-eat food with extended shelf life, low cost, ease of preparation, high nutritional value, and deliciousness. Additionally, it can also be called Burghul, Bulgar, or Bulghur.[Citation4] Bulgur typically contains 9–13% water, 10–16% protein, 1.2–1.5% fat, 76–78% carbohydrates, 1.2–1.4% ash, and 1.1 to 1.3% fiber. Bulgur contains more protein, calcium, iron, vitamin B1, and niacin than bread and pasta.[Citation5] Production and consumption of bulgur are constantly increasing in developed countries due to its healthy, dietary, nutritional benefits longer shelf-life, stopped respiration, inactivated enzymatic, microbial reactions, prevention of intestinal cancer risk, resistance to mold contamination and insect attacks, inhibition of phytic acid effects, excessive folic acid and dietary fiber contents.[Citation3]
Three different methods, i.e., conventional, autoclave, and microwave, are used to prepare bulgur. However, the traditional method for the preparation is still in practice. In contrast to the rising demand for bulgur, there are very few studies on bulgur that would raise its technological level and alter the mechanisms that are already in place. The primary procedures in producing bulgur include cleaning, cooking, drying, debranning, cracking, and size classification; however, of these steps, cooking and drying are two crucial ones that directly impact the quality of the bulgur.[Citation6] Bulgur contains B vitamins, dietary fiber, minerals, unsaturated fatty acids, and folate, and is frequently recognized as a healthy food.[Citation2] Bulgur has numerous medicinal and therapeutic potential as well and can be used to cure several ailments. Due to high concentration of folic acid and folate, bulgur has an advantage to use for vegetarian diets and for expectant mothers and babies.[Citation7] Additionally, it lessens the risk of colon cancer and prevents constipation problems due to the presence of high mineral content specifically, phosphorus, zinc, magnesium, and selenium along with cellulose fiber. Bulgur can be stored at optimum temperatures and humidity conditions for up to 6 to 8 months. It is the main ingredient in almost 250 different types of meals.[Citation8]
Additionally, it makes a great meat extender or alternative in vegetarian dishes and is a key ingredient in a variety of meatless burgers that can be found on grocery shelves all over the world.[Citation9] One of the most common dishes eaten in the Middle East is kibbeh, a bulgur and meat mixture that can be prepared in a variety of ways. Meat or poultry is combined with fine bulgur. Bulgur can also be used to make salads like tabbouleh. Couscous is a staple food of North Africa and can be served as a side dish. Its popularity is a result of its excellent flavor and nutritional advantages. In the Middle East, falafel, a deep-fried mixture of bulgur and faba beans, is a common dish enjoyed by both the wealthy and the less fortunate.[Citation10] Current research aimed to modify the nutritional composition of wheat with maximum bioavailability with minimal processing. For the purpose, bulgur was prepared with different wheat varieties using traditional and autoclave cooking methods. Moreover, nutritional profile antioxidant activity, structural characteristics, microbial assessment, and sensorial properties of bulgur samples were also elucidated.
Materials and methods
The research was conducted at the Department of Food Science, Government College University Faisalabad. Part of the work was conducted at Ayub Agriculture Research Institute (AARI), Faisalabad.
Procurement of raw material
Three different varieties of wheat i.e., Dilkash-2020, Akbar-2019, and Anaj-2017 were procured from Ayub Agriculture Research Institute (AARI), Faisalabad.
Physical analysis of wheat
Thousand kernel weight
The soundness of all wheat samples was confirmed by counting thousands of kernels and weighing them on an electric weighing balance (BioBase).[Citation11]
Test weight
Test weight of each variety was assessed using the Schopper Chondrometer (OHAVS Chicago) by following the standard procedure prescribed in AACC[Citation11] method No. 55–10.
Grain size
The kernel length, width, and thickness of selected grains were measured with a micrometer (Mahr Micromar 40A). All the results were presented by using µm as a standard unit.
Biochemical analysis of wheat
All varieties of wheat were subjected for their biochemical characterization by following the methods written in AACC[Citation11] named as moisture (Method no 44–5.02), Ash content (Method no. 08–01), Fat content (Method no. 30–25), Crude protein (Method no 46–10.01), Crude fiber (Method no 32–10.01) and nitrogen free extract (NFE) AACC[Citation11] was calculated by using the following equation:
Product development
To assess the qualities that different cooking techniques impart to the finished product and to subject the product to additional characterization, the product was produced using three different techniques. There are two different cooking techniques: traditional/conventional cooking and cooking in an autoclave. All techniques are described succinctly here:
Traditional/conventional cooking
Traditional/conventional cooking comprises simply cooking the wheat at boiling temperature (95–100°C) with 1 unit of wheat and 3 units of water for 20–25 minutes after the boiling starts to gelatinize the starch and assimilated the grain particle with the addition of water.
Autoclave cooking method
One unit of thoroughly cleaned wheat was soaked in 2.5 units of water for three hours at 60 degrees Celsius, allowing the grain to absorb 80% of the water. The soaked wheat samples were then cooked for 5 minutes at 121°C and 2.1 bar pressure in an autoclave. Low pressure was intended to allow water molecules to enter the center of the grain, allowing for appropriate starch gelatinization and improved grain swallowing.
Hot air drying
Both the traditional and autoclave-cooked samples were dried in a hot air oven for 13–15 hours at 60°C in a vented oven until the product’s moisture content dropped to 10%.
Milling
The product of each variety was tempered before the milling in order to achieve the moisture content desirable for milling, i.e. 14%. The moisture content was achieved by using the following formulae:
After the completion of milling (Brabender Quadrumate Senior Mill), a fan to eliminate the split bran layer was used and the bulgur samples were separated into three proportions using 2.5, 2.0- and 0.5-mm mesh size sieves. Grounded samples with 2 mm particle size were used for further characterization to preserve consistency.
Proximate analysis of bulgur
Moisture, crude fiber, crude fat, crude protein and ash content of different wheat varieties were proximately analyzed according to their relevant procedures as specified in AACC[Citation11] and their NFE contents were determined by using the following equation.
Total dietary fiber (TDF)
Bulgur samples were analyzed for their total dietary fiber content according to AACC.[Citation11] The bulgur samples were analyzed for total dietary fiber according to AACC[Citation11] method No. 32–05. The TDF was calculated by the following formula
Soluble dietary fiber (SDF)
Bulgur samples were investigated for soluble dietary fiber by following AACC[Citation11] Method No. 32–07, by utilizing a Megazyme assay kit (Megazyme, Ireland). The soluble dietary fiber was calculated with the following expression:
Insoluble dietary fiber (IDF)
Insoluble dietary fiber (IDF) in different wheat samples was estimated by AACC[Citation11] Method No. 32–20. The IDF was calculated by the following expression:
Minerals contents
The mineral contents like Na, K, Ca, and Fe in bulgur samples were determined by the method described in AOAC.[Citation11] One gram of sample was digested with 10 mL of nitric acid: perchloric acid (7:3) mixtures at temperature180-200°C till transparent contents were obtained. The contents were diluted to a volume of 100 mL with double distilled water. Concentration of mineral contents was determined by running the diluted sample through Atomic Absorption spectrophotometer (Model: Varian, AA-240, Victoria, Australia) using air acetylene flame.
Antioxidant activity
TPC (total phenolic contents)
Total Phenolic content present in sample was analyzed with the Folin-Ciocalteu method. Absorbance was recorded at 760 nm and results were written as mg Gallic acid equivalent (mg GAE/g DM and calculated by the method used by Yilmaz & Koca [Citation12]
TFC (total flavonoid contents)
Total Flavonoid content (TFC) in the bulgur sample was determined with spectrophotometric method used by Shen et al.[Citation13]with little modifications. Absorbance was measured at 415 nm and results were written in rutin equivalents (µg RE/g DM).
DPPH (2,2-diphenyl-1-picryl-hydrazyl-hydrate)
Standard solution for determination of antioxidant activity using diphenyl hydrazyl assay was prepared with the same method as used for TPC analysis with some modifications i.e. 80% methanol was used as followed the method used by Yilmaz & Koca [Citation12] Conclusively, the results were written as:
FRAP (ferric reducing antioxidant power assay)
The experiment was performed according to the method by Gao et al.[Citation14] Antioxidant power assessed through FRAP was expressed as µmol Fe2+ equiv/g−1.
ABTS
The third method used to determine the antioxidant activity was ABTS assay and the results were expressed as antioxidant capacity for mol of Trolox Equivalent Antioxidant Capacity (TEAC) in 100 g dry matter. Trolox was utilized as a benchmark. Analyses were performed using protocols in triplicate.
Fourier transforms infrared (FTIR)
Functional components of each bulgur sample were explored through the FTIR (Fourier Transform infrared spectroscopy) (Shimadzu-8400). Briefly the sample for scanning was placed and passed infrared radiations and detected by the continuous wave through a computer connected detector and the spectrum for the detection of functional components was detected from 400–4000 cm−1. The basic purpose for the characterization of bulgur sample is to explore their functional compounds present in the sample. The FTIR characterization of the sample is done by following the method used by Sivam et al.[Citation15]
Microbial analysis
Total plate count and yeast mold count were determined by following the method of Yıldırım et al.[Citation16]with some modifications. For total plate count 25–30 g sample of wheat bulgur was added in a beaker and 230 mL of normal saline solution (0.80%) was added in it. After some time, the mixture was homogenized using lab homogenizer (Lankai FSH-2A, China). Sterile total plate count agar media was prepared and poured in sterilized glass Petri plates. Tenfold dilution series were prepared in separate test tubes, 1 mL homogenized solution from beaker was poured in test tube containing 9 mL serial dilution and the dilution was then poured on the prepared media plate. Afterward, the plates were incubated in incubator (memmert, BE400) at 37°C for 24–48 hours. For yeast and mold count, Potato Dextrose Agar was used, and the plates were incubated at 27–30°C for 24 hours.
Sensory analysis
Bulgur samples for sensory evaluation were presented to the sensory panelist (faculty, MS and PhD students) which were firstly presented with the bulgur attributes (Color, texture, taste, mouth feel and overall acceptability. After which their remarks were recorded on 9-point hedonic scale, 9 for extremely liked and 1 for extremely dislike.
Statistical analysis
All the analyses were performed in triplicates and results written in the form of mean and their standard deviation. Further, the analysis of variance (ANOVA) was used to assess the level of significance (p ≤ .05).
Results and Discussion
Physical characteristics of wheat varieties
Thousand kernel weight
The average values of the thousand kernel weight of the several wheat types are shown in and ranged from 45.0 ± 0.07 g to 47.0 ± 0.06 g. According to results, the highest value (47.0 ± 0.06 g) was observed in Dilkash-2020 followed by Akbar-2019 (46.8 ± 0.07 g) and Anaj-2017, (45.0 ± 0.07 g). The variations in thousand kernel weights might be due to genetic variations, agronomic practices, cropping seasons, fertilizers level, sowing dates and moisture level. The current results were in accordance with the previous research of Wang & Fu,[Citation17]who reported that the thousand kernel weight ranged from 19.03 to 63.00g for 1000 kernel weight of different wheat varieties. The current results were in accordance with the previous study of Randhawa et al.[Citation18]and Ahmad,[Citation19] who explored ranges from 28.00 to 50.00 g for 1000 kernel weight of different wheat varieties grown in Pakistan.
Table 1. Physical characteristics of different wheat variants.
Test weight
Test weight is a crucial approach in wheat grading. Different wheat varieties showing higher kernel weight can be used by the breeders for hybridization program and flour millers for high yielding flour. Mean results depicted that the test weight ranged from 78.6 ± 0.12 to 83.5 ± 0.8 kg/HL. The highest value of test weight was observed in Dilkash-2020 (83.5 ± 0.8 kg/HL) followed by Akbar-2019(80.2 ± 0.11 kg/HL) and Anaj-2017 was (78.6 ± 0.12 kg/HL). The variation is due to quality and genetics probability of each variety. In a previous research Khan et al.[Citation20]stated that test weight values of different wheat varieties ranged from 66.47 ± 1.15 to 78.00 ± 3.57 kg/HL.
Grain size (length, width and thickness)
As indicated in , the mean values for grain length ranged from 6.2 ± 0.02 mm to 7.6 ± 0.04 mm. The highest values were observed in Dilkash-2020 (7.6 ± 0.04 mm) followed by Akbar-2019 (6.7 ± 0.01 mm) and Anaj-2017 (6.2 ± 0.02 mm).Mean values for grain width ranged from 2.8 ± 0.01 mm to 3.3 ± 0.02 mm. The highest values was noticed in Dilkash-2020 (3.3 ± 0.02 mm) followed by Akbar-2019 (2.±0.04 mm) and Anaj-2017 (2.8 ± 0.01 mm). Mean values of thickness was ranged from 2.5 ± 0.06 mm to 3.4 ± 0.01 mm. The highest values were observed in Dilkash-2020 (3.4 ± 0.01 mm) followed by Akbar-2019 (2.3 ± 0.04 mm) and Anaj-2017(2.5 ± 0.06 mm).The values for grain size (length, width, and thickness) were observed highest in Dilkash-2020 followed by Akbar-2019 and Anaj-2017.
These variations in grain size were due to different varieties, their genetic makeup, and other environmental and non-environmental factors. The grain size not only related with flour yield but also related with agronomic yield of wheat varieties. In a previous study Ahmad et al.[Citation21] stated that highest values for length and width were 6.63 ± 0.047 mm, 3.47 ± 0.023 mm in selected wheat variety (SKD-I). The results of physical analysis of Dilkash-2020, Akbar-2019 and Anaj-2017 were shown in .
Proximate composition of wheat varieties
Moisture content
Moisture is crucial regarding the safety and microbial aspects of cereals and cereal-based products. The moisture content < 14–16% retarded the microbial growth from different cereals and their by-products initiate not only autolysis but also retard the microbial growth.[Citation22] Storage of wheat is highly dependent on moisture content as lower moisture affects the protein quality while higher moisture content is a risk factor of microbial growth.[Citation23] Moisture content was significantly affected due to differences in wheat varieties. Mean values for moisture content were ranged from 10.3 ± 0.03%-12.8 ± 0.08%. The highest moisture content was observed in Dilkash-2020 (12.8 ± 0.08%), followed by Akbar-2019 (11.4 ± 0.05%) and the lowest moisture content was observed in Anaj-2017 (10.3 ± 0.03%).
The differences of moisture in crop varieties may be due to genetic variability and variation in environmental conditions prevailing during crop years. The results of our current research were in line with the previous studies of Akbar et al.,[Citation24] who stated that moisture content ranges from 13.3% to 16.5% in 20 different Pakistani wheat varieties.
Ash content
Ash is the inorganic residue present in natural resources. In current research the ash content was ranged from 0.8 ± 0.01 to 1.2 ± 0.01%. The highest ash content was observed in Anaj-2017 (1.5 ± 0.01%) followed by Akbar-2019 (1.2 ± 0.01%) and Dilkash-2020 (0.8 ± 0.01%). In a previous research Ahmad et al.[Citation21]reported that ash content ranged from 0.95 ± 0.02% in spring wheat varieties.
Protein content
Protein content is the important parameter as nutritional point of view.The variation in protein content might be due to difference in wheat cultivars, their genetic makeup, environmental conditions and cropping season. Mean values of different wheat varieties were ranged from 12.4 ± 0.02% to 15.2 ± 0.03%. In which the highest values were observed in Dilkash-2020 (15.2 ± 0.03%) followed by Akbar-2019 13.9 ± 0.03% and the lowest values was observed in Anaj-2017 (12.4 ± 0.02%). These results were similar to previous study of Abrar et al.[Citation25]who stated that protein content was ranged from 09.54% to 14.96% in recent winter bread wheat varieties.
Crude fat
Mean values for crude fat content were ranged from 1.5 ± 0.01 to 3.0 ± 0.02%. The highest value was observed in Dilkash-2020 was 3.0 ± 0.02% followed by Akbar-2019 was 2.7 ± 0.02and Anaj-2017 was 1.5 ± 0.01%. Higher mean values reported in this study may be due to prevailing climatic conditions at growth, crop year and genetic variability of wheat varieties. In a previous research Iqbal et al.[Citation26]stated that crude fat content was ranged from 1.95 to 2.96% in different wheat varieties.
Crude fiber
As shown in mean values for crude fiber were ranged from 1.5 ± 0.01%- 2.1 ± 0.01%. The highest values were observed in Akbar-2019 (2.1 ± 0.01%) followed by Dilkash-2020 (1.9 ± 0.01%), while the lowest values were observed in Anaj-2017 (1.5 ± 0.01%). In a previous study Ikhtiar & Alam,[Citation27]stated that fiber content in different wheat varieties was ranged from 1.7% to 2.0% in different Pakistani wheat varieties.
Table 2. Proximate composition of different wheat variants.
NFE content
Mean values for NFE in different wheat varieties were in the range 66.7 ± 0.15 to 72.5 ± 1.21% whereas the highest values were observed in Akbar-2019 (72.5 ± 1.21%) followed by Dilkash-2020 (68.9 ± 0.23%), while the lowest values were observed in Anaj-2017 (66.70 ± 0.15%) as shown in . In a previous study Iqbal et al.[Citation26]showed similar results in which NFE content in different wheat varieties were ranged from 71.56% to 74.17%.
Chemical composition of Bulgur
Moisture content
Moisture content has an inverse relationship with the ability to preserve the product and quality of end use. In current research, three varieties of wheat were used for production of bulgur under different conditions. The moisture content of different bulgur samples (Dilkash-2020, Akbar-2019, Anaj-2017) prepared from traditional method showed 10.5 ± 0.05%, 9.9 ± 0.04%, and 10.3 ± 0.03% respectively. On the other hand, different bulgur wheat samples prepared from Autoclave cooking method showed that moisture content of Dilkash-2020 (10.0 ± 0.05%), Akbar-2019 (9.6 ± 0.04%) and Anaj-2017 (9.7 ± 0.03%).
Mean values regarding moisture content ranges from 9.7 ± 0.03% to 10.5 ± 0.05% from different treatments as shown in . Therefore, the current results showed that wheat varieties (Dilkash-2020) and (Anaj-2019) bulgur prepared through autoclave cooking method showed high moisture content as compared to other treatments. Moreover, current results of moisture are similar to cereal based milling food products (12–14%) that showed safety aspects for storage. Moisture content also effect on safety and quality aspects of end-use product.
Table 3. Chemical composition of different bulgur samples.
Ash content
Mean values showed that ash contents in Dilkash-2020 were 1.20 ± 0.03% Akbar-2019 (1.29 ± 0.02%) and of Anaj-2017 (1.25 ± 0.01%) that was prepared from traditional cooking method. Furthermore, the ash content of bulgur via autoclave cooking method were contained 1.31 ± 0.03%, 1.25 ± 0.02% and 1.28 ± 0.01% in Dilkash-2020, Akbar-2019, and Anaj-2017, respectively. Mean values for ash contents ranged from 1.20 ± 0.03 to1.31 ± 0.03; however, Dilkash-2020 showed highest values for ash content when prepared through autoclave cooking method. Ash content in bulgur is correlated with bran content, which is often affected by debranning, milling, and polishing activities. In a previous study Bayram[Citation28] explored that the ash contents in bulgur was 1.5 g/100 g which are closely related to our current research.
Protein content
The nutritional properties of bulgur are determined by the wheat used as the starting material whichvaries with cultivar and growing environment. The protein contents of traditionally prepared bulgur wheat varieties were 11.2 ± 0.04%, 10.9 ± 0.03% and 11.6 ± 0.02% in Dilkash-2020, Akbar-2019 and Anaj-2017, respectively. Whereas bulgur prepared through autoclave cooking method showed the protein content of Dilkash-2020 (12.7 ± 0.04%), Akbar-2019 (11.9 ± 0.03%) and Anaj-2017 (12.4 ± 0. 02%). Mean values for protein content were ranged from 10.9 ± 0.03 to 12.7 ± 0.04. Highest values were observed in Dilkash-2020 that was prepared through autoclave cooking method. Current results are similar to previous research of Yousif et al.
[Citation3] who reported that the protein content in bulgur samples was 11.97 ± 0.7%. In terms of processing effects on nutritional quality of bulgur, autoclave cooking method improves the nutritional properties of bulgur with the disadvantage of decreased content of water soluble vitamins by around 0.5 points and hence it causes insignificant protein loss.
Crude fat
The fat contents of traditionally prepared bulgur wheat were Dilkash-2020 (1.75 ± 0.06%), Akbar-2019 (1.70 ± 0.05%) and Anaj-2017 (1.73 ± 0.04%). Whilst the bulgur prepared through autoclave revealed that fat contents were 1.83 ± 0.06%, 1.72 ± 0.05% and 1.78 ± 0.04% in Dilkash-2020, Akbar-2019 and Anaj-2017, respectively. Current results regarding fat content are similar to previous study of Stone et al.,[Citation29] they reported that the fat content is significantly lower than raw wheat. Furthermore, the fat content was ranged from 1.3–1.8% in different bulgur prepared from Triticum durum wheat.
Crude fiber
The fiber contents of traditionally prepared bulgur wheat Dilkash-2020, Akbar-2019 and Anaj-2017 were 11.7 ± 0.07%, 11.2 ± 0.04% and 11.5 ± 0.03% respectively while the bulgur prepared through autoclave cooking method showed that Dilkash-2020 (12.5 ± 0.07%), Akbar-2019 (11.9 ± 0.04%) and Anaj-2017 (12.3 ± 0.03%) fiber contents. Statistical results for crude fiber content of bulgur shown in table are highly significant. In our current results mean values for crude fiber were ranged from 11.2 ± 0.04 to 12.5 ± 0.07. In another study of Stone et al.[Citation29]revealed that fiber content in bulgur samples prepared through Triticum durum were ranged from 5.2–12.5%.
NFE
The NFE contents of traditionally prepared bulgur wheat Dilkash-2020 (66.3 ± 0.09%), Akbar- 2019 (65.4 ± 0.06%) and Anaj-2017 (62.3 ± 0.03%) while the bulgur prepared through autoclave was 72.4 ± 0.09, 69.2 ± 0.06 and 67.5 ± 0.03% NFE in Dilkash-2020, Akbar-2019 and Anaj-2017 varieties respectively as mentioned in .
Bioactive profile
Total dietary fiber (soluble and insoluble)
Thermal processing condition affects the level of soluble and insoluble dietary fiber depending on the type of the cereal and utilized processing conditions. Therefore, the current results reported variations in the levels of dietary fiber components may be caused by the processing of bulgur. In addition, the increase in insoluble dietary fiber content of bulgur samples is due to the gelatinization and the retrogradation of the starch during cooking process. Total dietary fibers contents of traditionally prepared bulgur from different wheat varieties were 8.7 ± 0.06%, 7.2 ± 0.02% and 7.2 ± 0.00 of Dilkash-2020, Akbar-2019 and Anaj-2017 respectively. The insoluble and soluble fiber amounts of Dilkash-2020 were in the range of (3.2 ± 0.04 and 4.6 ± 0.02), Akbar-2019 were in the range of (3.8 ± 0.02 and 4.9 ± 0.01), and of Anaj-2017 were (3.1 ± 0.00 and 4.1 ± 0.00) respectively. Dietary fiber contents of bulgur produced through autoclave cooking method were investigated by measuring both soluble and insoluble fiber contents. Total dietary fiber content was 7.6 ± 0.06% in Dilkash-2020 in which the insoluble and soluble fiber amount was 2.3 ± 0.04% and 5.3 ± 0.02% respectively. While in Akbar-2019 the amount of total soluble dietary fiber was 8.9 ± 0.03% in which the insoluble and soluble fiber content was 3.2 ± 0.02% and 5.7 ± 0.01% respectively. While in Anaj-2017 the total dietary fiber content was 7.4 ± 0.00% in which the insoluble and soluble fiber content was 2.9 ± 0.00% and 4.5 ± 0.00% respectively. Mean values regarding dietary fiber ranges from 8.9 ± 0.03 to 7.2 ± 0.00. Therefore, the current results show that Dilkash-2020 showed highest values for total dietary fiber prepared through traditional cooking method. In a previous study Evlice & Özkaya[Citation30]stated that SDF, IDF, and TDF contents of cultivars in bulgur samples were in the range of 1.01%-1.20%, 6.03%-6.88%, and 7.15%- 328 8.08% with means of 1.13%, 6.64%, and 7.77%, respectively. SDF, IDF, and TDF contents of bulgur samples were significantly influenced by cultivar, cooking method, and bulgur type interaction. In another study Savas & Basman,[Citation6]stated that Total dietary fiber contents of the bulgur samples were found to be between 5.25 and 12.49%.
Mineral profile
The mean composition of the bulgur samples varied, as shown in , due to variations in wheat cultivars. Bulgur samples prepared through different cooking methods analyzed for mineral content. Mean values of Ca+ were ranged from 368 ± 0.02mg/kg to 532 ± 0.00 mg/kg. Highest values were observed in Dilkash-2020 when prepared through autoclave cooking method. Mean values of K+ were ranged from 745 ± 0.05 mg/kg to 948 ± 0.03. Highest values were observed in Dilkash-2020 when prepared through autoclave cooking method. Mean values for Fe were ranged from 30 ± 0.04 mg/kg to 53 ± 0.01 mg/kg. Highest values were observed in Dilkash-2020 when prepared through autoclave cooking method. Mean values for Na+ were ranged from 168 ± 0.03 mg/kg to 318 ± 0.11 mg/kg, while the highest values were observed in Dilkash-2020. In a previous study Ikhtiar & Alam,[Citation27]studied the mineral content of different wheat varieties that were grown in Pakistan. The results were similar to our current findings.
Table 4. Mineral profile of different Bulgur varieties.
Antioxidant analysis
Whole grain products are recommended for healthy diets as being recognized source of antioxidant substances. They are important contributors to antioxidant activity in cereals. Bulgur samples prepared through different cooking methods analyzed for antioxidant activity. Mean values for total phenolic were ranged from 1.028 ± 0.03 to 2.034 ± 0.01 mg GAE/g dry matter. Highest values of Total Phenolic compounds observed in Dilkash-2020 were (2.034 ± 0.01 mg GAE/gDM) when prepared through autoclave cooking method at the concentration of 0.073 g/mL. Mean values for DPPH scavenging activities of bulgur samples at 0.236 g/mL concentrations when prepared through traditional and autoclave cooking methods were ranged from 0.214 ± 0.01 to 0.584 ± 0.02 mgGAE/g DM. Highest values of DPPH scavenging activities of bulgur samples observed in Dilkash-2020 were 0.584 ± 0.02 mg GAE/ g DM when prepared through traditional cooking method. Mean values for total flavonoids in the bulgur samples at the concentration of 0.211 g/mL when prepared through traditional and autoclave cooking methods were ranged from 0.059 ± 0.03 to 0.338 ± 0.01 mg RE/g DM. While the highest values of total flavonoids of bulgur samples observed in Dilkash-2020 were 0.338 ± 0.01 mg RE/g DM when prepared through autoclave cooking method. As shown in mean values for FRAP in the bulgur samples at the concentration of 0.455 g/mL when prepared through traditional and autoclave cooking methods were ranged from1.729 ± 0.05 to 2.861 ± 0.01 µmol Fe2+equiv/g−1. While the highest values of FRAP of bulgur samples observed in Dilkash-2020 were 2.861 ± 0.01 µmol Fe2+ equiv/g−1 when prepared through autoclave cooking method. Mean values for ABTS in the bulgur samples at the concentration of 0.361 g/mL when prepared through traditional and autoclave cooking methods were ranged from 0.127 ± 0.01 to 0.220 ± 0.03µmolTEAC/100 g DM. While the highest values of ABTS of bulgur samples observed in Dilkash-2020 was 0.220 ± 0.03 µmol TEAC/100 g when prepared through autoclave cooking method. In a previous study Yilmaz,[Citation31] studied the effects of different cooking and drying methods on Phenolic acids, carotenoids, and antioxidant activity of emmer (Triticum turgidum ssp. dicoccum) bulgur and the results of this study were similar to our current results. Due to thermal processing conditions applied to bulgur the conjugated phenolic compound increases in different wheat products like cookies, cakes, bread etc. In many previous literatures, it was reported that high temperature treatment of bulgur for short time is suitable in order to preserve the integrity of phenolic components in bulgur. Water absorbed by wheat kernels during soaking and the short cooking time minimize the loss of polyphenols and pigments. Based on this hypothesis, it was observed in the current study that natural antioxidants could be preserved better during the autoclave cooking and oven drying with a combination of short cooking time and low dying temperature as compared to other cooking methods. The hot air drying process provided better results than microwave drying because of lower drying temperatures.
Table 5. Total Phenolic Contents, Total Flavonoids Contents and Antioxidant Activity of Bulgur Samples.
Fourier transform infrared
FTIR spectra were obtained, as shown in in order to identify the functional groups, present in the bulgur samples. The FTIR spectra gave distinct bonds indicating the particular functional groups. In the bulgur sample of Dilkash-2020 and Akbar-2019 prepared through traditional cooking O˗H Stretching have been observed at 3500 cm−1which indicates the presence of Alcohol, however, there was a shift in band which leads to the change in functional group at 2400 cm−1with O=C=O Stretching which represents the carbon dioxide group. In the bulgur sample of Anaj-2017 prepared through traditional cooking C˗H Stretching has been observed at 3000 cm−1which represents the presence of Alkane group. In contrast, CO˗O-CO Stretching imprints at 1040 cm−1 were found in the Akbar-2019 bulgur sample that had been cooked by an autoclave cooking method, which showed the existence of anhydride. Additionally, aromatic compounds could be found in the band at 2000 cm−1 with C-H bending.
Figure 1. FTIR.
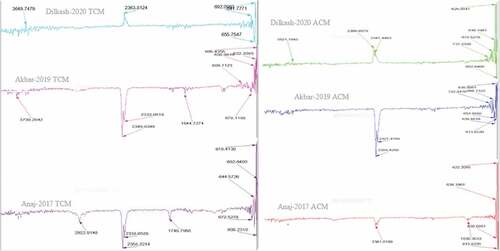
In the bulgur sample of Dilkash-2020-Anaj-2017 prepared through autoclave cooking at 2550 cm−1 with S˗H Stretching in the band showed the existence of Thiol in the bulgur sample. However, there was a move in the band which leads to the change in functional group at 2400 cm−1 with O=C=O Stretching which represents the carbon dioxide group. While at 790 cm−1with C=C bending in the band was observed which indicate the presence of alkene group in the sample. Successively, the band collapse at 690 cm−1 at four different points which showed C˗Br stretching and indicates the presence of Halo compounds in the bulgur sample ().
Table 6. FTIR spectrum waves, vibration types and functional groups in bulgur samples.
Microbial analysis of Bulgur
The mean results for the plate count and yeast mold count are shown in . Total plate count is essential to determine the hygiene conditions of the food system.[Citation32] However, greater number for total plate count indicates poor hygiene and poor sanitation conditions of the food. The results of the present study give satisfactory level of total plate count in all wheat bulgur treatments. However, the maximum total plate count (5.64 ± 0.03 log10 CFU/g) was observed in traditionally cooked bulgur from Anaj-2017. The lowest level of viable plate count was observed in bulgur from Dilkash-2020 (4.23 ± 0.04 log10 CFU/g). Total plate count shows the effectiveness of the food system and it also indicates the shelf life of the product along with its organoleptic properties.[Citation33] Results suggest that bulgur from Dilkash-2020 showed better stability when compared to other treatments. Aydin et al.[Citation34]also indicates the level of total plate counts in similar range for wheat flour.
Table 7. Microbial count.
Yeast mold count is another important parameter that indicates the food quality. Decomposition of food may occur due to the growth of yeast and mold species in it.[Citation35] Therefore, the levels of yeast and mold count are of high importance for determining the safety and quality of food.[Citation32] Higher the storage period of food in any food chain system, the more chances of contamination by yeast and mold could occur. However, the levels of yeast and mold are within safe limits in present study. The lowest yeast mold count was indicated in Dilkash-2020 bulgur (0.96 ± 0.01 log10 CFU/g and 1.04 ± 0.01 log10 CFU/g) however the maximum levels of yeast and mold was observed in traditionally cooked bulgur from Anaj-2017 (3.23 ± 0.02 log10 CFU/g). One important reason regarding yeast and mold is that they can grow even in food products that have lower moisture levels where other microbes e.g., bacteria cannot compete.[Citation36]
Sensory evaluation
Bulgur prepared from different wheat varieties were subjected to evaluation by using 9-point hedonic score for various sensory attributes. Mean values of sensory evaluation of bulgur showed significant effect from different wheat varieties on color, taste, mouth feel and overall acceptability when prepared through both traditional and autoclave cooking method.
In our current research results showed that mean values for color were ranged from 5.03 ± 0.02 to 7.51 ± 0.02 as shown in . Highest acceptance of color was observed in Dilkash-2020 (7.51 ± 0.02) prepared through autoclave cooking method. Bulgur’s visual acceptability is significantly influenced by color parameters, and brilliant yellow hue in particular is a trait that customers prefer. Mean values for taste were ranged from 5.11 ± 0.05 to 6.04 ± 0.03 while the highest acceptance score for taste was observed in Dilkash-2020 (6.04 ± 0.03) prepared through autoclave cooking method. Mean values for texture were ranged from 7.24 ± 0.03 to 8.01 ± 0.05. While the highest acceptance notch was observed in Akbar-2019 (to 8.01 ± 0.05) prepared through autoclave cooking method. Mean values for Mouth feel were ranged from 6.54 ± 0.01 to 6.83 ± 0.02 while the highest acceptance score for mouth feel was observed in Akbar-2019 (6.83 ± 0.02) prepared through autoclave cooking method. Mean values for overall acceptability were ranged from 7.90 ± 0.01 to 8.02 ± 0.04. However, the highest values of overall acceptability were observed in Dilkash-2020 (8.02 ± 0.04) prepared through autoclave cooking method. In a previous research by Yilmaz,[Citation37] studied the sensorial properties of cooked and uncooked bulgur prepared through three different treatments (Traditional, Autoclave and microwave by combining two drying methods. The results were in line with our current research results.
Table 8. Mean Values for Sensorial Properties of Bulgur.
Conclusion
Bulgur is a rich source of dietary fibers, minerals and phenolic contents. It was concluded that the Dilkash-2020 showed better physicochemical characteristics as compared to Akbar-2019 and Anaj-2016. Further, it was also observed that autoclave method enhanced the nutritional profile and antioxidant activity as well as dietary fibers contents of bulgur samples as compared to the traditional cooking . Moreover, FTIR spectra of bulgur endorsed the presence of various functional groups. In the current study, it was also elucidated that microbial growth was retarded as a result of autoclave. Conclusively, bulgur prepared from the Dilkash-2020 using autoclave showed better results for their biochemical composition, antioxidant activity, structural, microbial and sensorial properties as compared to the traditional cooking method.
Disclosure statement
No potential conflict of interest was reported by the author(s).
References
- Oso, A. A.; Ashafa, A. O. Nutritional Composition of Grain and Seed Proteins. In Grain and Seed Proteins Functionality; Jose C., J. L. (Ed); IntechOpen: London, United Kingdom, 2021; pp 31–47.
- Cornell, H. J.; Hoveling, A. W. Wheat: Chemistry and Utilization; Boca Raton: CRC press, 2020.
- Yousif, S. I.; Bayram, M.; Kesen, S. Characterization of Volatile Compounds SSof Bulgur (Antep Type) Produced from Durum Wheat. J. Food Qual. 2018, 2018, 1–9. 2018 DOI: 10.1155/2018/8564086.
- Miskelly, D. Optimisation of end-product Quality for the Consumer. In Cereal Grains; Wrigley, C., Batey, I. L., Miskelly, D., (Eds); Woodhead Publishing Series in Food Science, Technology and Nutrition, 2017; pp 653–688.
- Ertaş, N. A Comparision of Industrial and Homemade Bulgur in Turkey in Terms of Physical, Chemical and Nutritional Properties. Chem. Indus. Chem. Eng. Quart. 2017, 23(3), 341–348. DOI: 10.2298/CICEQ160112047E.
- Savas, K.; Basman, A. Infrared Drying: A Promising Technique for Bulgur Production. J. Cereal Sci. 2016, 68, 31–37. DOI: 10.1016/j.jcs.2015.11.001.
- Chellino, M.; Scherr, R. E.; Zidenberg-Cherr, S. Nutrition and Health Info Sheet; The Regents of the University of California, Davis campus: Vegetarian Diets, 2016.
- Khan, K. Wheat: Chemistry and Technology; American Association of Cereal Chemists International: Elsevier Inc., 2016.
- Bayat, G. Traditional Dishes Consumed in the Eastern Anatolian Region of Turkey; Lyon France: Livre de Lyon, 2021.
- Havemeier, S. M.; (2018). Evaluating the Agricultural, Historical, Nutritional, and Sustainable Uses of Pulse Grains and Legumes (Doctoral dissertation, University of Minnesota).
- American Association of Cereal Chemists. Approved Methods Committee. Approved Methods of the American Association of Cereal Chemists. Amer Assn of Cereal Chemists, 2000; Vol. 1.
- Yilmaz, V. A.; Koca, A. F. Effect of Different Production Techniques on Bioactive Compounds and Antioxidant Capacity of Einkorn (Triticum Monococcum L.) and Durum (Triticum Turgidum Subsp. Durum) Bulgur. J. Sci. Food Agric. 2017, 97(1), 269–277. DOI: 10.1002/jsfa.7724.
- Shen, Y.; Jin, L.; Xiao, P.; Lu, Y.; Bao, J. Total Phenolics, Flavonoids, Antioxidant Capacity in Rice Grain and Their Relations to Grain Color, Size and Weight. J. Cereal Sci. 2009, 49(1), 106–111. DOI: 10.1016/j.jcs.2008.07.010.
- Gao, X.; Björk, L.; Trajkovski, V.; Uggla, M. Evaluation of Antioxidant Activities of Rosehip Ethanol Extracts in Different Test Systems. J. Sci. Food Agric. 2000, 80(14), 2021–2027. DOI: 10.1002/1097-0010(200011)80:14<2021::AID-JSFA745>3.0.CO;2-2.
- Sivam, A. S.; Sun-Waterhouse, D.; Perera, C. O.; Waterhouse, G. I. N. Application of FT-IR and Raman Spectroscopy for the Study of Biopolymers in Breads Fortified with Fibre and Polyphenols. Food Res. Int. 2013, 50(2), 574–585. DOI: 10.1016/j.foodres.2011.03.039.
- Yıldırım, I.; Uzunlu, S.; Topuz, A. Effect of Gamma Irradiation on Some Principle Microbiological and Chemical Quality Parameters of Raw Turkish Meat Ball. Food Control. 2005, 16(4), 363–367. DOI: 10.1016/j.foodcont.2004.04.001.
- Wang, K.; Fu, B. X. Inter-relationships between Test Weight, Thousand Kernel Weight, Kernel Size Distribution and Their Effects on Durum Wheat Milling, Semolina Composition and Pasta Processing Quality. Foods. 2020, 9(9), 1308. DOI: 10.3390/foods9091308.
- Randhawa, M. A.; Anjum, F. M.; Butt, M. S. Physico-chemical and Milling Properties of New Spring Wheats Grown in Punjab and Sindh for the Production of Pizza. Int. J. Agri. Biol. 2002, 4(4), 21 24.
- Ahmad, I.; 2001. Varietal differences in amino acid, composition, milling and baking properties of spring wheats. Ph.D. Thesis, Deptt. Food Tech., Univ. of Agric., Faisalabad, Pakistan.
- Khan, M. R.; Anjum, F. M.; Zahoor, T.; Nawaz, H. Biochemical and Technological Characterization of Pakistani Spring Wheats. Pak. J. Agri. Sci. 2009, 46(4), 271–279.
- Ahmad, S.; Pasha, I.; Saeed, M.; Shahid, M. Principal Component Analysis and Correlation Studies of Spring Wheats in Relation to Cookie Making Quality. Int. J. Food Prop. 2017, 20(10), 2299–2313. DOI: 10.1080/10942912.2016.1236273.
- Hussain, M.; Saeed, F.; Niaz, B.; Afzaal, M.; Ikram, A.; Hussain, S.; Anjum, F. M.; Alamri, M. S.; Anjum, F. M. Biochemical and Nutritional Profile of Maize Bran–enriched Flour in Relation to Its End‐use Quality. Food Sci. Nutr. 2021, 9(6), 3336–3345. DOI: 10.1002/fsn3.2323.
- Kundu, M.; Khatkar, B. S.; Gulia, N. Assessment of Chapatti Quality of Wheat Varieties Based on Physicochemical, Rheological and Sensory Traits. Food Chem. 2017, 226, 95–101. DOI: 10.1016/j.foodchem.2016.12.046.
- Akbar, A.; Ahmed, A.; Ahmed, Z.; Liaqat, S. Physicochemical, Rheological, and Sensory Evaluation of Selected Pakistani Wheat Varieties. J. Food Process. Preserv. 2022, 46(1), e16174. DOI: 10.1111/jfpp.16174.
- Abrar, M.; Din, A.; Zubair, M.; Musa, M. Suitability of Recent Winter Bread Wheat Varieties for Bakery Products. J. Agri. Res. 2018, 56 (2), 123–129, (03681157).
- Iqbal, Z.; Pasha, I.; Abrar, M.; Masih, S.; Hanif, M. S. Physico-chemical, Functional and Rheological Properties of Wheat Varieties. J. Agri. Res. 2015, 03681157, 53(2).
- Ikhtiar, K.; Alam, Z. Nutritional Composition of Pakistani Wheat Varieties. J. Zhejiang Univ. Sci. B. 2007, 8(8), 555–559. DOI: 10.1631/jzus.2007.B0555.
- Bayram, M. Application of Bulgur Technology to Food Aid Programs. Cereal Foods World. 2007, 52(5), 249–256.
- Stone, A. K.; Wang, S.; Tulbek, M.; Koksel, F.; Nickerson, M. T. Processing and Quality Aspects of Bulgur from Triticum Durum. Cereal Chem. 2020, 97(6), 1099–1110. DOI: 10.1002/cche.10347.
- Evlice, A. K.; Özkaya, H. Effects of Wheat Cultivar, Cooking Method, and Bulgur Type on Nutritional Quality Characteristics of Bulgur. J. Cereal Sci. 2020, 96, 103124. DOI: 10.1016/j.jcs.2020.103124.
- Yilmaz, V. A. Effects of Different Cooking and Drying Methods on Phenolic Acids, Carotenoids, and Antioxidant Activity of Emmer (Triticum Turgidum Ssp. Dicoccum) Bulgur. Cereal Chem. 2019, 96(6), 1093–1102. DOI: 10.1002/cche.10219.
- Suo, T.; Guo, X. N.; Zhu, K. X. Effects of Tempering with plasma-activated Water on Total Plate Count and Quality Properties of Wheat Flour. J. Cereal Sci. 2022, 105, 103468. DOI: 10.1016/j.jcs.2022.103468.
- Batool, S. A.; Rauf, N.; Tahir, S. S.; Kalsoom, R. Microbial and Physico-chemical Contamination in the Wheat Flour of the Twin Cities of Pakistan. Int. J. Food Safety. 2012, 14, 75–82.
- Aydin, A.; Paulsen, P.; Smulders, F. J. M. The Physicochemical and Microbiological Properties of Wheat in Thrace. Turk. J. Agric. For. 2009, 33, 445454.
- Bullerman, L. B. Fusaria and Toxigenic Molds Other than Aspergilli and Penicillia. In Food Microbiology: Fundaments and Frontiers, Fundamentals, F., Frontiers, Doyle, M. P., Beuchat, L. R., Montville, T. J. Eds. American Society for Microbiology Press: Washington DC, 1997; pp. 419–434.
- Murphy, P. A.; Hendrich, S.; Landgren, C.; Bryant, C. M. Food Mycotoxins: An Update. J. Food Sci. 2006, 71(5), R51–R65. DOI: 10.1111/j.1750-3841.2006.00052.x.
- Yilmaz, V. A. Effects of Several Production Methods on Technological, Textural and Sensorial Properties of Emmer (Triticum Turgidum Ssp. Dicoccum) Bulgur. J. Food Sci. Technol. 2020, 57(10), 3874–3883. DOI: 10.1007/s13197-020-04419-0.