 ?Mathematical formulae have been encoded as MathML and are displayed in this HTML version using MathJax in order to improve their display. Uncheck the box to turn MathJax off. This feature requires Javascript. Click on a formula to zoom.
ABSTRACT
Propolis is a sticky resin from bees and contains reasonable amounts of bioactive compounds that benefit the human body. Despite the benefits that propolis has to offer, propolis also has a bitter taste and pungent aroma. These characteristics of propolis could be controlled by a microencapsulation process with a complex coacervation method using gelatine and sodium alginate as coating material. The amount of propolis added was also varied in F1 (5 ml), F2 (10 ml), and F3 (15 ml). This study aimed to determine the effect of different concentrations of propolis on the physicochemical characteristic of propolis microcapsule. The results showed that increasing the addition of propolis concentration could also increase yield, total phenolic content, hygroscopicity, and solubility. Meanwhile, the increase in propolis concentration showed a decrease in encapsulation efficiency, moisture content, water activity, and dissolution time. Propolis microcapsules have a round morphology and several hollows on the surface. The best treatment was seen in F1, which obtained microcapsules of propolis with an encapsulation efficiency of 91.86%, and F3 which obtained microcapsules with high spraydried yield and solubility, fast dissolution time, and low value of moisture content, water activity, and hygroscopicity.
Introduction
Propolis is a sticky resin material from bees and is commonly known as “bee glue.” Worker bees make propolis by collecting soft material from plant exudate and mixing it with beeswax, pollen, and enzymes to produce a substance to strengthen the hive.[Citation1] Propolis comes from nature, making it a natural product with many health benefits because it contains bioactive compounds. These compounds can provide various therapeutic effects such as antioxidant, antibacterial, antifungal, antiviral, anti-inflammatory, and anticancer.[Citation2] The advantages of propolis make propolis captives the public and are used as herbal medicine to prevent various diseases.
Propolis is usually extracted with ethanol until it becomes a product that can be consumed. The content of bioactive compounds in the form of phenolics in propolis extract is susceptible to damage due to several conditions, such as exposure to light, humidity, and oxygen, so it can reduce its biological activity. Propolis extract also has a pungent odor and a distinctive aftertaste.[Citation3] This is challenging to process propolis into a product that can be consumed well.
Microencapsulation using complex coacervation is a method that can be applied to minimize the unwanted characteristics of propolis extract.[Citation4] Research on microencapsulation of propolis with complex coacervation method with different concentrations of propolis has not been done much. According to,[Citation5] complex coacervation methods usually use biopolymers such as natural gums, proteins, carbohydrates, and fats as coatings. The advantages of complex coacervation methods are an easily prepared, highly coated core material capacity, good heat resistance, slow product release, and resistance to mechanical stress.[Citation6]
Complex coacervation is based on associative interactions between oppositely charged polymers, usually between proteins and polysaccharides.[Citation7] The biopolymers used as coatings are gelatine and sodium alginate. Gelatine is an amphoteric protein with a positive charge below its isoelectric point and can form a coacervate with sodium alginate, which has a negative charge at a lower pH .[Citation8] This research was conducted to study the physicochemical characteristics of propolis microcapsules with different concentrations of propolis coated with gelatine and sodium alginate using the complex coacervation method.
Materials and methods
Materials
Propolis microcapsules were made using propolis that comes from bees (Trigona sp.) South Sulawesi, commercial gelatine, maltodextrin DE 18, commercial sodium alginate, 37% 1 M HCL, and distilled water. Glacial acetic acid, Gallic acid, Ethanol 96%, Methanol, Na2CO3 7.5%, and Reagan Folin-Ciocalteau were used for encapsulation efficiency. Sodium Chloride [NaCl) for water activity test. Whatman filter paper No. 42 was used for testing microcapsule solubility. Milli-Q water was used for zeta potential test.
Preparation of propolis extract
Propolis extract was prepared according to the method reported by,[Citation9] with slight modifications. One hundred sixty-eight grams of crude propolis was added with 1200 mL of 70% ethanol solution and macerated for 48 hours at room temperature (22–27°C]. The solutions were filtered and stored in the freezer at −20 C for 10 hours. After that, centrifugation (Hermle Z306) was carried out for 2 × 10 minutes at a temperature of 10°C at a speed of 4500 rpm. The centrifuged supernatant was then evaporated using a rotary vacuum evaporator [IKA RV 10) at a temperature of 60°C.
Preparation of wall material
Wall material was prepared by following the modification method reported by.[Citation8] Gelatine 2.8 g/140 ml (0.02%], sodium alginate 0.8 g/40 ml (0.02%), and maltodextrin 36 g/100 ml (36%) solution were made by using distilled water as disperse medium.The final percentage concentration of propolis extract were 11.21% (F1), 20.16% (F2) and 27.47% [F3).
Microencapsulation process
The microencapsulation process referred to the method by.[Citation8,Citation10] The propolis extract was added to the gelatine solution and then homogenized using a homogenizer (D-Lab 100]. After that, the sodium alginate solution was added and stirred for 5 minutes. The homogeneous solution was adjusted to the final pH of 4 using 1 M HCl, and the maltodextrin solution was added. The solution was then stored in the refrigerator for 24 hours, then dried using a spray dryer [Buchi Mini Spray Dryer B-290) at inlet temperature of 150°C, outlet temperature of 70–74°C, aspirator of 90% and pump of 30%.
Yield
The spray-dried yield was determined by the following method reported by.[Citation9] Weighed the spray-dried microcapsule obtained after the drying process. Calculated the coating materials used, the propolis extract, and the spray-dried microcapsule using the following formula:
Encapsulation efficiency and total phenolic content
The encapsulation efficiency was determined by the modification method reported by,[Citation11]by calculating the total phenolic content (TPC] and surface phenolic content (SPC). For the total phenolic content determination, the propolis microcapsule was diluted in ethanol/acetic acid/distilled water mixed reagent (50:8:42), meanwhile, for the surface phenolic content, propolis microcapsule was dissolved into methanol/ethanol mix reagent (50:50). The solution was vortexed and filtered by filter paper. An aliquot of the sample was mixed with Folin-Ciocalteu and Na2CO3. After 30 minutes of incubation, the absorbance was measured using a UV spectrophotometer (UV-9200) at 760 nm. Gallic acid was used as the standard. The encapsulation efficiency was calculated by using this formula:
Moisture content
Moisture content [% w.b.) was measured by the following method of.[Citation12] Two gram of microcapsule were dried in an oven at 105 for 3 hours until constant weight. Samples were then put in silica gel desiccators until they cooled to room temperature.
Water activity [aw]
The water activity value of propolis microcapsules was determined by the following method by,[Citation9]using the aw meter [Aqualab LITE]. The instrument was calibrated using a salt solution of NaCl. The calibrated instrument was then added as much as 2 gram of the sample and tested at room temperature.
Hygroscopicity
Hygroscopicity was determined by the following method reported by.[Citation9] One gram of sample was put in the weight-constant vial bottle and then placed in a desiccator containing a saturated solution of NaCl (RH 75%, 25 C] Hygroscopicity was evaluated after 7 days by weighing the final weight of the sample and expressing in percent hygroscopicity.
Solubility
Approximately 0.75 g (a) of the sample was dissolved in 100 ml of distilled water and filtered with a vacuum. Previously, the filter paper (Whatman No. 42) was dried in the oven (150–110 C) for 30 minutes and was put in the desiccator for 15 minutes, and the weight of the filter paper was measured (b). After the filtration process, the filter paper and residue dried in the oven (150–110 C) for 3 h, cooled in the desiccator for 30 minutes and measured the weight (c).[Citation13] The solubility was calculated using this formula:
Morphology
The microcapsule morphology was tested with Scanning Electron Microscope (Hitachi TM 3000) by preparing the sample in the specimen holder that had been coated with carbon tabs. The sample was installed into the chamber for testing and was observed at a magnification of 3,000 times. The result is obtained as an SEM image that shows microcapsule surface morphology.[Citation14]
Dissolution time
Dissolution time was evaluated according to the method of,[Citation15] with slight modification. The sample [1 g) slowly dissolved into 50 ml of distilled water and stirred with a magnetic stirrer. The time needed for the microcapsule to dissolve was recorded.
Zeta potential
The microcapsule and gelatin charge stability were tested by knowing the zeta potential. The test was carried out according to.[Citation16] The microcapsule was dissolved into distilled water; the gelatin powder was used to disperse mediums. The powder was dissolved into distilled water and milli-Q water. The zeta potential of each solution was measured with Nanoparticle Analyzer (Horiba Scientific SZ-100].
Statistical analysis
The significant difference among the samples was determined by one-way analysis of variance [ANOVA) using SPSS software version 25. Pvalue < 0.05 was used to indicate the significant differences.
Results and discussion
Yield
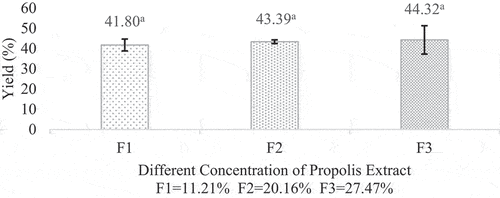
Based on the results, the average yield of propolis microcapsule varied from 41.80%-44.32%. The observed propolis microcapsule yield is similar to that reported by.[Citation14], [Citation17–19] stated that a good spray-dried yield should be above 50%. However, the yield obtained in this experiment is still below the standard, possibly due to the stickiness that occurs during the drying process. Some residues were left in the spray dryer chamber and cyclone during the drying process.[Citation20]
Despite that, the data showed an increase in yield as the concentration of propolis increased, which indicated that the concentration of the core material could affect the yield of the microcapsules. This could be explained that the increased yield happened due to the total solids added. This study’s results also follow the research of.[Citation21,Citation22] The results of the analysis of the yield of propolis powder can be seen in .
Encapsulation efficiency and total phenolic content
The values of encapsulation efficiency (%EE) respectively were 91.86%; 90.92%; and 88.27%, respectively. The results showed that the microencapsulation process was successful, marked by high efficiency, and proven during the drying process, not too many active ingredients were lost.[Citation23] The encapsulation efficiency in this experiment was better than that of,[Citation24] those are 33.81%; 73.14%; and 81.48%, respectively. The propolis microcapsule encapsulation efficiency results can be seen in .
Figure 2. Encapsulation efficiency of propolis microcapsule. Values in the graph followed by different letters were statistically significantly different according to the Analysis of Variance (ANOVA) at Pvalue < 0.05.
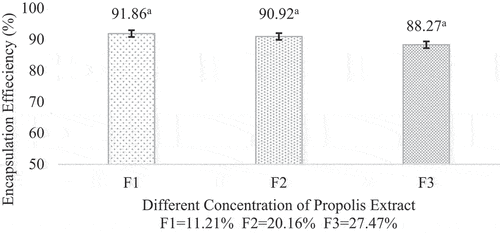
The trend showed that the higher the concentration added, the lower the encapsulation efficiency. The decrease trend in encapsulation efficiency was caused by the inability of the wall material to protect the core and provide a matrix, so the core material leaked.[Citation25] This phenomenon could be attributed to the presence of core material on the surface of the microcapsule that failed to be encapsulated during the drying process, thereby shortening the diffusion path between particles and increasing the value of the surface phenolic content. Therefore, the concentration of the core material used should be lower to obtain high encapsulation efficiency.[Citation26]
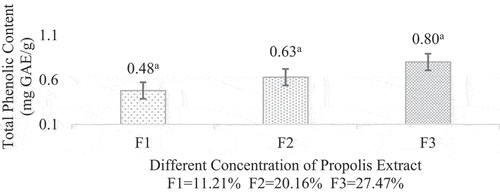
The total phenolic content value increased trend as the propolis concentration increased. Total Phenolic Content (TPC) values obtained from each treatment in this study were 0.48, 0.43 and 0.80 mg GAE/g, respectively. This statement was in accordance with research conducted by[Citation27] and [Citation20]. The total phenolic analysis is shown in .
Moisture content
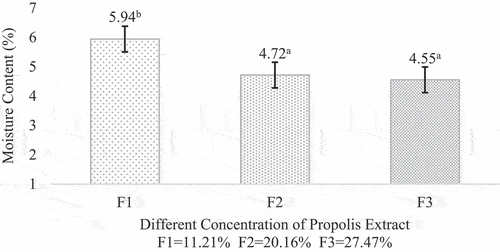
Moisture content is defined as the percentage of water contained in the material and could be affected by the characteristics of the material. Propolis microcapsule moisture content varied from 5,94%-4,55%. The result was in accordance with the experiment done by[Citation27] and [Citation14]. The spray-dried microcapsule moisture content should be lower than 5% so that the powder could be stored in the long term and be microbiologically safe.[Citation28] However, F1 showed a value slightly above 5%. This could be caused by the low formation of hollow in the matrix, shown in the results of the surface morphology analysis with scanning electron microscopy, which inhibited the air diffusion process from the particle.[Citation29]
The moisture content showed decreasing value as the propolis concentration increased. It occurred because as the concentration increased, the density between the particles also increased. This statement is supported by a study conducted by,[Citation30] where an increase in total solids [solids concentration) will also increase the viscosity, which will cause a lower water content in the material and microcapsules after drying. The decrease in moisture content also could be found in the research done by[Citation31], who reported that moisture content was 2.075–5.33% with wall materials used maltodextrin, Arabic gum, and gelatin by a spray-dried method. [Citation32] also reported that moisture content was 0.15–0.32% with wall materials used maltodextrin, Arabic gum, and encapsulation method by spray-dried. The data on microcapsule moisture content can be seen in .
Water activity (aw]
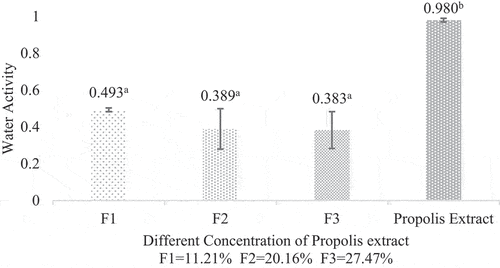
Water activity is the availability of free water in a food material responsible for the ongoing biochemical reactions. The microcapsule water activity respectively 0.493, 0.389 and 0.383. The water activity of propolis extract was 1. The difference in water activity of microcapsule and propolis extract showed that the microencapsulation process could reduce water activity up to 2.5 times compared to propolis extract. This difference can be influenced by several factors, such as the composition and concentration of the suspension (feed) and the encapsulant material used. In addition, the feed flow rate, inlet temperature, and spray dryer outlet temperature during the drying process can affect the water activity of the microcapsules.[Citation28]Microcapsule water activity is recommended not to exceed 0.60 because this is critical for microbial stability and storage life.[Citation33] All formulations showed water activity below 0.60, so it could be concluded that the microcapsule is stable against microbial growth and biochemical reactions. The water activity analysis is shown in .
Hygroscopicity
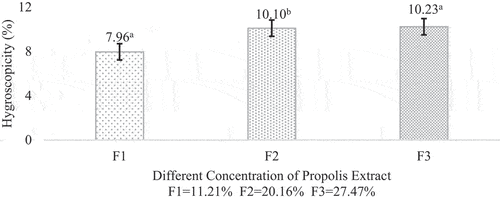
Hygroscopicity indicates the ability of a product to absorb moisture from the surrounding environment. It is one of the important factors in determining the product’s shelf life and what type of packaging is suitable for the product.[Citation34] The hygroscopicity of propolis microcapsule range from 7,96%-10,23%. According to research done by,[Citation35] a powder can be categorized based on the degree of hygroscopicity as non-hygroscopic (<10%), slightly hygroscopic (10–15%), hygroscopic (15–20%), and very hygroscopic [20–25%). The higher hygroscopicity could lead to powder caking or sticking, which is certainly not desirable in microcapsule products. The microcapsule obtained in this study was categorized as non-hygroscopic for F1 and slightly hygroscopic for F2 and F3. It could also be said that the microcapsule was physically and chemically stable due to their low hygroscopicity.
In this study, the hygroscopicity showed increasement trend while the moisture content decreased. [Citation36]stated that hygroscopicity values have a reverse correlation with the moisture content. The increase of microcapsule hygroscopicity could also be affected by using maltodextrin with DE 18 as wall material. Based on,[Citation37] the higher the DE of maltodextrin used, the higher the hygroscopicity of the microcapsule produced. The hygroscopicity of propolis microcapsule can be seen in .
Solubility
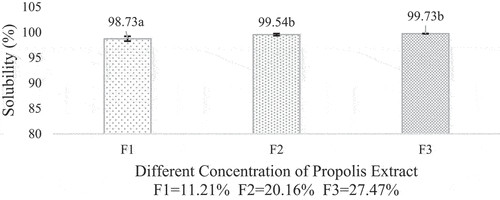
The solubility of a microcapsule was analyzed to determine the application of the product obtained into a food product and to study the microcapsule characteristic. The microcapsule solubility varied from 98.75%-99.54%. A similar solubility value of microcapsule is also found by.[Citation14] Powders with low moisture content tend to absorb water better. This could be explained by the occurrence of different water vapor pressure so the particles could absorb water faster or easily moistened. This was what made the propolis microcapsule have high solubility. Other than that, according to[Citation38] and,[Citation39] using gelatine and maltodextrin as wall material could also influence the solubility of the microcapsule. The data on microcapsule solubility is shown in .
Morphology
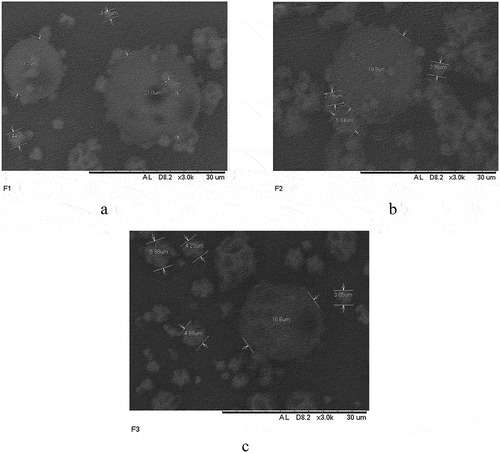
The results showed that the microcapsule has a round shape and several cavities on the surface. The microcapsule morphology in the scanning electron microscope is shown in . Microcapsule had a diameter in the range of 1–21 m. Meanwhile, cavities on the surface can be caused by the very fast solvent evaporation during the drying process due to high temperatures of 150°C. The difference in the microcapsules’ shape was influenced by the atomization process.[Citation40]
Figure 8. Microcapsule morphology as seen in the scanning electron microscope: (a) 5 ml of propolis, (b) 10 ml of propolis, (c) 15 ml of propolis. The accelerating voltages used in SEM image analysis of biological material vary between 5 and 20 kV.
Dissolution time
The dissolution time of microcapsules is defined as the ability of a microcapsule to absorb or rehydrate in the water.[Citation41] Based on the results, the microcapsule needed 2.72–3.92 minutes to dissolve in the water. According to,[Citation42] an ideal time for microcapsule to dissolve in water is less than 5 minutes. All the formulations had good dissolution times. The shorter the time required for microcapsule to dissolve in water, the better the physical properties. The dissolution time of propolis microcapsule is shown in .
Figure 9. Dissolution time of propolis microcapsule. Values in the graph followed by different letters were statistically significantly different according to the Analysis of Variance (ANOVA) at Pvalue < 0.05.
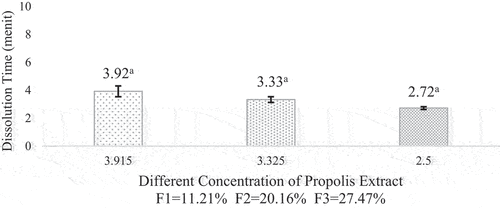
The different concentrations of propolis added caused the microcapsule to disintegrate more easily in water. This could happen because the propolis was already in the extract form. Propolis has a polar compound in the form of phenolic compounds with a hydroxyl group, and there was no wax content in the propolis.[Citation43] This is in accordance with the nature of water. According to,[Citation44] water is a polar compound that can dissolve polar and ionic compounds. Therefore, the higher content of propolis, the faster trend the time required to dissolve in water.
Zeta potential
Zeta potential is important to study the stability of the suspension. Propolis microcapsules dissolved in distilled water have a zeta potential value of −36,6 mV., [Citation45]stated that the zeta potential value above ±30 mV is in the stable category, and the values of zeta-potential above ±30 mV were customarily considered moderately stable against aggregation due to charge stabilization, i.e., the electrostatic repulsive forces are high enough to prevent aggregation. Therefore, propolis microcapsules can be said to be stable from the aggregation or agglomeration process. The results of this study’s zeta potential test of propolis microcapsules showed similar results to the research conducted by.[Citation46] The negative zeta potential value indicates the accumulation of positive charge in the surface layer. This positive charge can bind to the negative charge in the diffuse layer.[Citation47] The negative charge can also come from Cl- ions from HCl, which are added to lower the pH of the solution and the solvent it uses, namely distilled water with an OH- group.[Citation16]
Gelatine solution with adjusted pH to 4 significantly differs in zeta potential value based on the solvent used. Gelatine dissolved in milli-Q water had a zeta potential value of 9.7 mV. The gelatine used in this study is gelatine from bovine, which belongs to type B. According to,[Citation16] type B gelatine has an isoelectric point between 4.7–5.2. A decrease in pH below the isoelectric point could increase the zeta potential value or make the gelatine positively charged. The zeta potential reached its maximum when the pH was set to 3.5–4. The zeta potential analysis data can be seen in .
Table 1. Zeta potential of propolis microcapsule and gelatine solution.
Gelatine dissolved in distilled water has a different zeta potential and shows a negative value. Based on,[Citation48] the zeta potential of gelatine solution either dissolved in distilled water or milli-Q water indicates that the solution has short-term stability because the zeta potential was below 20 mV.
Conclusion
In this study, the difference in the concentration of propolis extract only significantly affected the moisture content and dissolution time. The best treatment was obtained from the addition of propolis extract as much as 5 ml (F1) because it has a high yield value, phenolic content, good solubility in water, low moisture content, and is morphologically better. The observed morphology in the scanning electron microscope showed a round shape and several hollows on the surface of the propolis microcapsule. This propolis microcapsule can be used as a healthy drink product in the food industry.
Acknowledgments
The authors are thankful to Universitas Padjadjaran for this research’s facilities and provided a grant.
Disclosure statement
No potential conflict of interest was reported by the author(s).
References
- Maroof, K.; Lee, R. F. S.; Siow, L. F.; Gan, S. H. Microencapsulation of Propolis by Spray Drying: A Review. Drying Technol. 2020, 1–20. DOI: 10.1080/07373937.2020.1850470.
- Silva-Carvalho, R.; Baltazar, F.; Almeida-Aguiar, C. Propolis: A Complex Natural Product with A Plethora of Biological Activities that Can Be Explored for Drug Development. Evid. Based Complement. Altern. Med. 2015, 2015. DOI: 10.1155/2015/206439.
- Abrahão, F. R.; Rocha, L. C. R.; Santos, T. A.; Do Carmo, E. L.; Pereira, L. A. S.; Borges, S. V.; Pereira, R. G. F. A.; Botrel, D. A. Microencapsulation of Bioactive Compounds from Espresso Spent Coffee by Spray Drying. LWT. 2019, 103, 116–124. DOI: 10.1016/j.lwt.2018.12.061.
- Jansen-Alves, C.; Fernandes, K. F.; Crizel-Cardozo, M. M.; Krumreich, F. D.; Borges, C. D.; Zambiazi, R. C. Microencapsulation of Propolis in Protein Matrix Using Spray Drying for Application in Food Systems. Food Bioprocess. Technol. 2018, 11(7), 1422–1436. DOI: 10.1007/s11947-018-2115-4.
- Mahdavi, S. A.; Jafari, S. M.; Ghorbani, M.; Assadpoor, E. Spray-Drying Microencapsulation of Anthocyanins by Natural Biopolymers: A Review. Drying Technol. 2014, 32(5), 509–518. DOI: 10.1080/07373937.2013.839562.
- Onbas, R.; Kazan, A.; Nalbantsoy, A.; Yesil-Celiktas, O. Cytotoxic and Nitric Oxide Inhibition Activities of Propolis Extract Along with Microencapsulation by Complex Coacervation. Plant Foods Human Nutr. 2016, 71(3), 286–293. DOI: 10.1007/s11130-016-0558-1.
- Schmitt, C.; Turgeon, S. L. Protein/polysaccharide Complexes and Coacervates in Food Systems. Adv. Colloid Interface Sci. 2011, 167(1), 63–70. DOI: 10.1016/j.cis.2010.10.001.
- Devi, N.; Hazarika, D.; Deka, C.; Kakati, D. K. Study of Complex Coacervation of Gelatin a and Sodium Alginate for Microencapsulation of Olive Oil. J. Macromol. Sci., Part A: Pure Appl. Chem. 2012, 49(11), 936–945. DOI: 10.1080/10601325.2012.722854.
- Busch, V. M.; Pereyra-Gonzalez, A.; Šegatin, N.; Santagapita, P. R.; Poklar Ulrih, N.; Buera, M. P. Propolis Encapsulation by Spray Drying: Characterization and Stability. LWT - Food Sci. Technol. 2017, 75, 227–235. DOI: 10.1016/j.lwt.2016.08.055.
- Puspita, S.; Eddy, D. R.; Wahyudi, T.; Julaeha, E. Microencapsulation of Lime Peel Essential Oils (Citrus Aurantifolia) with Complex Coacervation Methods Using Gelatin/Sodium Alginate Coating. Jurnal Kimia Valensi. 2020, 6(May), 106–112. DOI: 10.15408/jkv.v6i1.14618.
- Farrag, A.; El-Messery, T. M.; El-Said, M. M.; Soliman, T. N.; El-Din, H. M. F. Microencapsulation of Grape Phenolic Compounds Using Whey Proteins as a Carrier Vehicle. J. Bio. Sci. 2018, 18(7), 373–380. DOI: 10.3923/jbs.2018.373.380.
- AOAC. Official Methods of Analysis. Virginia: Assosiation of Official Chemist. Inc., 2005.
- Dewi, E. N.; Perdana, N. E.; Purnamayati, L. The Protection of Fish Gelatine and Arabic Gum as Coating Materials to the Quality Chlorophyll Caulerpa Racemosa Encapsulation. J. Phys. Conf. Ser. 2021, 1943, 1. DOI: 10.1088/1742-6596/1943/1/012171.
- Sulaeman, A.; Nusa, P. C.; Marliyati, S. A. Antioxidant Activity and Total Phenolic of Encapsulated Stingless Bee Propolis by Spray Drying Method. J. Gizi Pangan 2021, 16(28), 65–72.
- Edris, A. E.; Kalemba, D.; Adamiec, J.; Pi, M. Microencapsulation of Nigella Sativa Oleoresin by Spray Drying for Food and Nutraceutical Applications Institute of General Food Chemistry, Lodz University of Technology, Lodz, Faculty of Process and Environmental Engineering, Lodz University of. Food Chem. 2016, 204, 326–333. DOI: 10.1016/j.foodchem.2016.02.143.
- Ahsan, S. M.; Rao, C. M. The Role of Surface Charge in the Desolvation Process of Gelatin: Implications in Nanoparticle Synthesis and Modulation of Drug Release. Int. J. Nanomed. 2017, 12(January), 795–808. DOI: 10.2147/IJN.S124938.
- Fernandes, C. S. C. D. O.;. (2015). Spray dried propolis to improve the microbiological safety of alheira Master Dissertation (Issue June). Universidade Católica Portuguesa.
- Marquiafável, F. S.; Nascimento, A. P.; Barud, H. D. S.; Marquele-Oliveira, F.; de-Freitas, L. A. P.; Bastos, J. K.; Berretta, A. A. Development and Characterization of a Novel Standardized Propolis Dry Extract Obtained by Factorial Design with High Artepillin C Content. J. Pharm. Technol. Drug Res. 2015, 4(1), 1. DOI: 10.7243/2050-120x-4-1.
- Mujica-Álvarez, J.; Gil-Castell, O.; Barra, P. A.; Ribes-Greus, A.; Bustos, R.; Faccini, M.; Matiacevich, S. Encapsulation of Vitamins A and E as spray-dried Additives for the Feed Industry. Molecules. 2020, 25, 6. DOI: 10.3390/molecules25061357.
- Sari, D. K.; Lestari, D.; Khinanta, P.; Sahlan, M. ENCAPSULATION BIOACTIVE COMPUND PROPOLIS WITH CARRAGEENAN – GUM ARABIC BY SPRAY DRYING 1 Department of Chemical Engineering, Faculty of Engineering, Universitas Sultan. Ageng Tir. 2020, 9(1), 8–11.
- Karagönlü, S.; Başal, G.; Özyıldız, F.; Uzel, A. Preparation of Thyme Oil Loaded Microcapsules Text Appl. 2018, 3, 1–8. www.ijntr.org
- Proboningrum, Y. P.;. Pengaruh Rasio Bahan Penyalut Glukomanan (Amorphophallus Oncophyllus) Terhadap Karakteristik Mikrokapsul Minyak Atsiri Cengkeh Dan Minyak Ikan; Semarang: Universitas Katolik Soegijapranata, 2020.
- Sahlan, M.; Dienayati, D.; Hamdi, D.; Zahra, S.; Hermansyah, H.; Chulasiri, M. Encapsulation Process of Propolis Extract by Casein Micelle Improves Sunscreen Activity. Makara J. Technol. 2017, 21(1), 1. DOI: 10.7454/mst.v21i1.3072.
- Pratami, D. K.; Mun’im, A.; Hermansyah, H.; Gozan, M.; Sahlan, M. Microencapsulation Optimization of Propolis Ethanolic Extract from Tetragonula Spp Using Response Surface Methodology. Int. J. Appl. Pharm. 2020, 12(4), 197–206. DOI: 10.22159/ijap.2020v12i4.37808.
- Rosenberg, M.; Rosenberg, Y.; Frenkel, L. Microencapsulation of Model Oil in Wall Matrices Consisting of SPI and Maltodextrins. AIMS Agric. Food. 2016, 1(1), 33–51. DOI: 10.3934/agrfood.2016.1.33.
- Tonon, R. V.; Grosso, C. R. F.; Hubinger, M. D. Influence of Emulsion Composition and Inlet Air Temperature on the Microencapsulation of Flaxseed Oil by Spray Drying. Food Res. Int. 2011, 44(1), 282–289. DOI: 10.1016/j.foodres.2010.10.018.
- Pratami, D. K.; Mun’Im, A.; Yohda, M.; Hermansyah, H.; Gozan, M.; Putri, Y. R. P.; Sahlan, M. Total Phenolic Content and Antioxidant Activity of spray-dried Microcapsules Propolis from Tetragonula Species. AIP Conf. Proc. 2019, 2085(March). DOI: 10.1063/1.5095018.
- Tontul, I.; Topuz, A. Spray-drying of Fruit and Vegetable Juices: Effect of Drying Conditions on the Product Yield and Physical Properties. Trends Food Sci. Technol. 2017, 63, 91–102. DOI: 10.1016/j.tifs.2017.03.009.
- Fuentes-Ortega, T.; Martínez-Vargas, S. L.; Cortés-Camargo, S.; Yazmin Guadarrama-Lezama, A.; Gallardo-Rivera, R.; Baeza-Jimenéz, R.; Pérez-Alonso, C. Effects of the Process Variables of Microencapsulation Sesame Oil (Sesamum Indica L.) by Spray Drying. Revista Mexicana de Ingeniera Quimica 2017, 16(2), 477–490.
- Shao, W. Microencapsulation of DHA Algal Oil by Spray Drying. Adv. Biol. Sci. Res. 2016, 3(BEP), 78–83.
- Rajabi, H.; Ghorbani, M.; Jafari, S. M.; Sadeghi Mahoonak, A.; Rajabzadeh, G. Retention of Saffron Bioactive Components by Spray Drying Encapsulation Using Maltodextrin, Gum Arabic and Gelatin as Wall Materials. Food Hydrocolloids. 2015, 51(November 2017), 327–337. DOI: 10.1016/j.foodhyd.2015.05.033.
- Fazaeli, M.; Emam-Djomeh, Z.; Kalbasi Ashtari, A.; Omid, M. Effect of Spray Drying Conditions and Feed Composition on the Physical Properties of Black Mulberry Juice Powder. Food Bioprod. Process. 2012, 90(4), 667–675. DOI: 10.1016/j.fbp.2012.04.006.
- Kowalska, G.; Rosicka-Kaczmarek, J.; Miśkiewicz, K.; Wiktorska, M.; Gumul, D.; Orczykowska, M.; Dędek, K. Influence of Rye Bran Heteropolysaccharides on the Physicochemical and Antioxidant Properties of Honeydew Honey Microcapsules. Food Bioprod. Process. 2021, 130(November), 171–181. DOI: 10.1016/j.fbp.2021.09.014.
- Vardanega, R.; Muzio, A. F. V.; Silva, E. K.; Prata, A. S.; Meireles, M. A. A. Obtaining Functional Powder Tea from Brazilian Ginseng Roots: Effects of Freeze and Spray Drying Processes on Chemical and Nutritional Quality, Morphological and Redispersion Properties. Food Res. Int. 2019, 116, 932–941. DOI: 10.1016/j.foodres.2018.09.030.
- Vladić, J.; Nastić, N.; Janković, T.; Šavikin, K.; Menković, N. Raeseri Extract Using Spray Drying with Maltodextrin and Whey Protein. 2022, 66(2), 229–238.
- Tonon, R. V.; Brabet, C.; Hubinger, M. D. Influence of Process Conditions on the Physicochemical Properties of Açai (Euterpe Oleraceae Mart.) Powder Produced by Spray Drying. J. Food Eng. 2008, 88(3), 411–418. DOI: 10.1016/j.jfoodeng.2008.02.029.
- Zhu, J.; Li, X.; Liu, L.; Li, Y.; Qi, B.; Jiang, L. Preparation of spray-dried Soybean Oil Body Microcapsules Using Maltodextrin: Effects of Dextrose Equivalence. Lwt. 2022, 154, 112874. DOI: 10.1016/j.lwt.2021.112874.
- Nurhidajah, Pranata, B.; Sya’di, Y. K.; Sya’di, Y. K.; Yonata, D.; Yonata, D. Microencapsulation of Umami Flavor Enhancer from Indonesian Waters Brown Seaweed. Curr. Res. Nutrit. Food Sci. 2022, 10(1), 349–359. DOI: 10.12944/CRNFSJ.10.1.29.
- Said, M. I. Role and Function of Gelatin in the Development of the Food and non-food Industry: A Review. IOP Conference Series: Earth and Environmental Science. 2020, 492, 1. DOI: 10.1088/1755-1315/492/1/012086.
- Kurniasih, R. A.; Purnamayati, L.; Amalia, U.; Dewi, E. N. Mikroenkapsulasi Fikosianin dalam Maltodekstrin-Alginat: Formulasi dan Karakterisasi. Agritech. 2018, 38(1), 23. DOI: 10.22146/agritech.16752.
- Sun, X.; Cameron, R. G.; Bai, J. Effect of spray-drying Temperature on Physicochemical, Antioxidant and Antimicrobial Properties of pectin/sodium Alginate Microencapsulated Carvacrol. Food Hydrocolloids. 2020, 100, 105420. DOI: 10.1016/j.foodhyd.2019.105420.
- Husni, P.; Fadhiilah, M. L.; Hasanah, U. FORMULASI DAN UJI STABILITAS FISIK GRANUL INSTAN SERBUK KERING TANGKAI GENJER (Limnocharis Flava (L.) Buchenau.) SEBAGAI SUPLEMEN PENAMBAH SERAT. Jurnal Ilmiah Farmasi Farmasyifa. 2020, (3)1, 1–8. DOI: 10.29313/jiff.v3i1.5163.
- Ristivojević, P.; Trifković, J.; Andrić, F.; Milojković-Opsenica, D. Poplar-type Propolis: Chemical Composition, Botanical Origin and Biological Activity. Nat. Prod. Communicat. 2015, 10(11), 1869–1876. DOI: 10.1177/1934578x1501001117.
- Brini, E.; Fennell, C. J.; Fernandez-Serra, M.; Hribar-Lee, B.; Lukšič, M.; Dill, K. A. How Water’s Properties are Encoded in Its Molecular Structure and Energies. Chem. Rev. 2017, 117(19), 12385–12414. DOI: 10.1021/acs.chemrev.7b00259.
- Lowry, G. V.; Hill, R. J.; Harper, S.; Rawle, A. F.; Hendren, C. O.; Klaessig, F.; Nobbmann, U.; Sayre, P.; Rumble, J. Guidance to Improve the Scientific Value of zeta-potential Measurements in nanoEHS. Environ. Sci.: Nano. 2016, 3(5), 953–965. DOI: 10.1039/c6en00136j.
- Mishra, P. R.; Al, S. L.; Müller, R. H.; Keck, C. M. Production and Characterization of Hesperetin Nanosuspensions for Dermal Delivery. Int. J. Pharmaceutics. 2009, 371(1–2), 182–189. DOI: 10.1016/j.ijpharm.2008.12.030.
- Dembek, M.; Bocian, S.; Buszewski, B. Solvent Influence on Zeta Potential of Stationary Phase—Mobile Phase Interface. Molecules. 2022, 27, 3. DOI: 10.3390/molecules27030968.
- Kusmayadi, A.; Adriani, L.; Abun, A.; Muchtaridi, M.; Tanuwiria, U. H. The Microencapsulation of Mangosteen Peel Extract with Maltodextrin from Arenga Starch: Formulation and Characterization. J. Appl. Pharm. Sci. 2019, 9(3), 33–40. DOI: 10.7324/JAPS.2019.90306.

