
ABSTRACT
This study was designed to determine the nutritional composition and bioactive compounds in four selected wild potato varieties. Moisture content in wild potato varieties ranged between 70.92 ± 0.29 to 73.82 ± 0.64 g/100 g sample. Shimul Alu has the highest amount of ash (1.01 g/100 g sample). The range of 3.2–4.10 g/100 g sample was the range where the protein content changed substantially. Jam Alu had the highest protein content (4.10 g/100 g sample), whereas lal parki had the lowest value (2.2 g/100 g sample). Shimul Alu provided the highest crude fiber concentration (0.55 g/100 g sample), whereas lal parki presented the lowest crude fiber content (0.43 g/100 g sample). Shimul Alu had the highest levels of starch and reducing sugar. In comparison to widely grown types, wild potato varieties showed increased antioxidant activity. Jam Alu had the most antioxidant activity, with 148.83 mol of ascorbic acid per gram, whereas commonly consumed potato, lal parki, had the lowest antioxidant activity, with 91.57 mol of ascorbic acid per gram. The phenolic content of the dry sample ranged from 1.01 to 2.85 mg GAE. Jam alu, one of the potato cultivars, had the greatest phenolic content. The range of the total flavonoid concentration in grams was 18.04–41.38 mg of quercetin equivalents (QE). Shil bilati, a wild kind of potato, had the highest flavonoid content, whereas lal parki, a commonly consumed potato, had the lowest. In comparison to widely farmed and consumed forms, wild kinds of potatoes were shown to be more nutrient-dense.
Introduction
Wild vegetables are a potential source of essential nutrients such as vitamins, minerals, proteins, and fibers and are also good dietary sources of antioxidants such as flavonoids and other polyphenolic constituents.[Citation1] A diet high in processed foods and low in antioxidants produces endogenous reactive oxygen species (ROS), which can lead to many chronic diseases, including diabetes, infections, cardiovascular and neurological disorders, and cancers.[Citation2] These natural antioxidant compounds can prevent the overproduction of ROS. Several studies have found an inverse relationship between morbidity and mortality from degenerative disorders and natural antioxidant compound consumption.[Citation3] Currently, wild or traditional plants, as a source of natural antioxidants, have received increased attention because they scavenge ROS and are sources of trace elements. Potatoes have a variety of secondary metabolites, but glycoalkaloids play a key role in their defense against pathogens such viruses, bacteria, fungi, and insects. However, these glycoalkaloids are important poisons that can be found in both human and animal food.[Citation4] They have additional health properties such as antidiabetic, antibacterial, and anticancer activity. That makes them valuable for incorporation into the daily diet.[Citation5] In Bangladesh, many wild edible plants are traditionally eaten with staple foods, particularly in rural areas and a few urban neighborhoods. These plants play an important role in fulfilling the demand for nutritional, minerals, and antioxidant compounds in the diet[Citation6]; they are also used to treat certain medical conditions, for example, diabetes, in local communities.[Citation7]
There are several wild potato varieties in the Solanaceae family, are grown naturally in Bangladesh but not cultivated on cultivable land. These wild varieties of potato are eaten by minor tribal groups such as Chakma, Sawtal, Rakhain, Gharo, etc., and poor people in the village. Edible flesh from potatoes and potato yams provides a valuable amount of carbohydrates, protein, fats, vitamins, and minerals contributing to human nutrition. Some wild potato species are of poor quality for industrial use. Some species contain toxic compounds, some of which contain bioactive chemicals, and they are cultivated for pharmaceutical products.[Citation8]
There is a lack of information about the nutritional composition and bioactive compounds of wild edible potatoes in Bangladesh. The selected four types of wild potato varieties are grown naturally in Bangladesh but not cultivated on cultivable land. These may be the potential sources of phytochemicals and antioxidants if we cultivate locally and introduce these to the minds of the farmers. For the cultivation process of these wild potato varieties, new techniques have to be developed in a short and efficient manner. Food security and poverty alleviation can be accelerated through the dissemination of knowledge of wild potato varieties to farmers.
The objective of this study was to evaluate the proximate composition, antioxidant activity, and bioactive components of wild edible potatoes that can be found in various parts of Bangladesh. The study’s results will offer additional data on the nutritional and nutraceutical potential of wild edible potatoes in Bangladesh, and they could be used to develop new products, expand their use as dietary supplements, and/or create functional foods by being added to databases of food composition.
Materials and methods
Study design
Jam alu (Syzygium cumini), Gechu alu (Apanogeton natans), Shil bilati (Albizia lebbeck), Shimul alu (Bombax ceiba), and Deshi alu (lal parki) (Digera muricata) were among the chosen wild types of potatoes that were gathered from various locations throughout Bangladesh. Five samples of potatoes were analyzed and repeated in triplet. All chemicals and reagents used in the study were of analytical grade and were purchased from reputed manufacturers and used in the laboratory of Department of Food Technology and Nutritional Science (FTNS), Mawlana Bhashani Science and Technology University, Tangail.
Preparation of sample (potato flour)
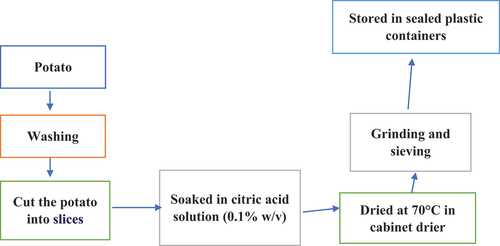
The fresh potatoes were rinsed in cold water, skinned, and cut into pieces that were 1 cm thick. They were then immediately submerged in a citric acid solution (0.1% w/v) solution for 10 min. Prior to further analysis, the slices were kept at 25°C in sealed plastic containers after being dried at 70°C in a cabinet dryer, ground in a commercial grinder, and passed through a screen (60 mesh) ().[Citation9]
Figure 1. Flowchart for potato flour preparation.
Proximate composition analysis
Moisture, fat, fiber, and ash were determined by standard AOAC procedures.[Citation10]
Moisture
A hot air oven was used to dry 10 g of sample to a consistent weight between 100°C and 105°C. A desiccator was used to chill the dish containing the dried sample to room temperature. The dish was then weighed, and the weight loss was used to measure the moisture content in percent.[Citation10]
Ash
A silica crucible was pre-weighed with about 4–6 g of ground material, which was then burned over the heater to remove any smoke. In a muffle furnace, the crucible and the sample were ignited and heated to 600°C for 4 h. The crucible containing the ash was removed from the muffle furnace when it had been slightly cooled, kept in desiccators to cool, and then weighed to a constant weight. The amount of total ash was determined by comparing the weight of the silica crucible while empty and when filled with ash. The following calculation was used to determine the percentage of ash.[Citation10]
Crude fat
Petroleum ether was used to extract 5 g of dried sample over the course of 6 h in a Soxhlet extraction device. The petroleum ether was entirely evaporated from the beakers after the ether extract was filtered into them, and the rise in weight of the beaker denoted the amount of fat present.[Citation10]
Crude fiber
Two hundred milliliters of boiling 0.255 N (1.25% w/v) sulfuric acid was poured to a 500-ml beaker containing around 2–5 mg of a moisture and fat-free sample. The mixture was cooked for 30 min while maintaining a steady volume by adding water frequently. After this time, the mixture was filtered through a muslin cloth, and the remaining material was thoroughly cleaned with hot water to remove any remaining acid. Two hundred milliliters of boiling 0.313 N (1.25%) NaOH was then added to the beaker with the substance. The mixture was boiled for 30 min before being strained through muslin fabric. The residue was cleaned with hot water until it was alkaline-free, then it was cleaned with some alcohol and other substances. After that, it was put into a crucible, dried for the next day at 30–100°C, and weighed (W1). In a muffle furnace, the crucible was heated for 2–3 h at 600°C. It was weighed after cooling (W2). The weight of crude fiber is represented by the weight difference.[Citation10]
Reducing sugar
Reducing sugar from potato was carried out using Luff schoorl method.[Citation11] One gram of the sample was weighed and added to 40 mL of 80% alcohol in centrifuge tubes. The samples were centrifuged to separate the extract after the first hour of extraction in an 80°C water bath, and a second hour of extraction and centrifugation followed. Once the two extracts were combined, 100 mL of 80% alcohol was added. Every sample was examined twice. In an Erlenmeyer flask, 20 mL of ethanolic extract was combined with 10 mL of Fehling A, 10 mL of Fehling B, 10 mL of distilled water, and 10 mL of glass pearls. The fluid was swiftly chilled in an ice bath after being boiled for 2 min on a Bunsen burner. Then, drops of starch and 10 mL each of 10% potassium iodide and 10% sulfuric acid were added. And, 0.1 N sodium thiosulfate was used in the evaluation up until the brown color vanished. Twenty milliliters of the 80% alcohol mixture was used as a blank in place of sample extract.
Starch
Starch from potato was carried out using Lane and Eynan method.[Citation12] The Lane–Eynon method is an illustration of a tritration technique for figuring out how much reducing sugar is present in a sample. Using a burette, the copper sulfate solution and the methylene blue indicator are added to a flask along with the carbohydrate solution being tested. The copper sulfate in the flask and the reducing sugars in the carbohydrate solution interact to produce a reaction. Any additional addition of reducing sugars causes the indicator to turn from blue to white once all the copper sulfate in solution has reacted. It is noted how much sugar solution was needed to get there. Since the reaction is not stoichemetric, a calibration curve must be created by running the experiment with a number of standard solutions with known carbohydrate concentrations. Five grams of a homogenized sample are weighed into a volumetric flask with a 100 mL capacity, and 25 mL of 1.124% HCl solution are added to the contents. The suspension is heated on a boiling water bath for 15 min after the addition of a further 25 mL of 1.124% HCI solution (after 3 min the content of a volumetric flask is mixed to avoid coagulation). Twenty milliliters of the 1.124% HCI solution are added when the hydrolysis is accomplished. After quickly chilling (using a stream of moving water), clarity is carried out using 5 mL of the Carrez I and Carrez II solutions (note: for each solution, use a separate pipette). Finally, distilled water is added to a volumetric flask, which is then properly mixed and filtered with a filtration funnel. Neutralize the filtrate with NaOH.
Protein
By estimating the nitrogen amount of a food product and multiplying the nitrogen value by 6.25, one can determine the protein content of that food product. Since non-protein nitrogen (NPN) included in the material is taken into account, this is referred to as crude protein content. By deducting NPN (which is calculated by precipitating the protein in the sample with trichloroacetic acid and copper hydroxide and calculating the residual nitrogen in the protein-free filtrate) from total nitrogen, true protein nitrogen can be calculated. The Kjeldhal technique for estimating nitrogen relies on the fact that organic nitrogen is transformed to ammonium sulfate when it is digested with sulfuric acid in the presence of a catalyst (copper sulfate). Making the solution alkaline released ammonia, which was then distilled into a known volume of a standard acid and back-titrated.[Citation10]
Bioactive compound
Antioxidant activities
The 1, 1-diphenyl−2-picryl-hydrazyl (DPPH) radical scavenging experiment was used to assess the scavenging activity of sweet potato extracts. The DPPH radical scavenging experiment was calorimetrically determined at 517 nm on a spectrophotometer. The extent of the samples’ capacity to scavenge free radicals is shown by the purple color deterioration of DPPH. Ascorbic acid was used as the standard. The common calibration curves were plotted. Micromole AsA equivalents/100 g of fresh weight (mol AsA/100 g FW) were used to express the results. From the stock solution, sample solutions with concentrations of 10, 5, 2.5, and 1.25 mg/mL were created. A 1 ml aliquot of samples was added to 1 ml of newly made 1,1-diphenyl−2-picryl-hydrazyl (DPPH) methanolic solution (80 ppm). For 30 min, the mixture was left in the dark. Then, a spectroscope was used to measure the absorbance at 517 nm. Ascorbic acid’s (10–50 ppm) capacity to scavenge free radicals was also assessed. The percentage of DPPH scavenging effect was calculated by following equation. DPPH scavenging effect (%)/% Inhibition=A0 − A1/A0 × 100, where A0 = the absorbance of control.[Citation13]
Total Phenolic Compound (TPC)
Using gallic acid as a reference phenolic compound, the total phenolic compounds in the potato extracts were identified using the Folin–Ciocalteu reagent in accordance with Slinkard & Singleton’s[Citation14] methodology. Two hundred microliters of the sample, 1.4 ml of distilled water, and 100 µl of the Folin–Ciocalteu reagent were combined. Three hundred microliters of 20% Na2CO3 solution was added after at least 30 s but no longer than 8 min, and the mixture was left to stand for 2 h. Using a spectroscope, the absorbance was measured at 765 nm. To create the calibration curve, standard solutions of gallic acid (10–100 ppm) were similarly processed. The amount of total phenolic compounds in the potato extracts was determined in mg gallic acid equivalent (GAE)/100 g dry sample.
Flavonoid
The total flavonoid content (TFC) was determined by the colorimetric test method employing 10% Al(NO3)3 and 5% sodium nitrite (NaNO2) in an alkaline medium. The results were computed using the quercetin calibration curve and represented as mg quercetin equivalents (QE)/100 g FW after the absorbance was measured at 500 nm.[Citation15] Weighted samples of 0.90–1.00 g were used, and 10 mL of 60% ethanol in water was used to extract flavonoids over the course of 30 min. These samples underwent an additional 3000 g centrifugation. The entire supernatant was transferred to a 25 mL volumetric flask and fixed there with 60% ethanol in water. A 25 mL tube was filled with 1.5 mL of each extract, 4.5 mL of distilled water, and 1 mL of 5% (w v-l) NaNO2 solutions. 1 mL of the 10% (w v−1) Al(NO3)3solutions was added to the mixture after 6 min of incubation. Prior to adding 10 mL of 4% (w/v) NaOH solutions and fixing to 25 mL with 60% ethanol aqueous, the mixture was allowed to sit for 6 min. After the mixture had been reacting for 15 min, its absorbance at 510 nm was measured using a spectrophotometer in comparison to a blank that contained 5 mL of extraction solvent. The mean of three tests was used to determine the total flavonoid concentration, which was represented as mg quercetin equivalent per g dry weight. Samples were independently examined in triplicate times (DW).
Statistical analysis
Each measurement was carried out three times. Using SPSS software, the experimental data were put through a mean value calculation.
Results and discussion
Proximate compositional analysis of potato varieties
For the purpose of evaluating the nutritional content of different potato types, proximate analysis was used. The following graphs display the proximate analysis.
Moisture
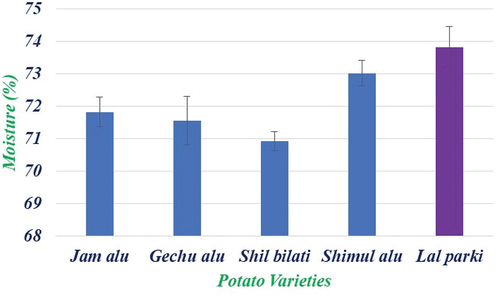
The moisture content in the flesh of different potato varieties in showed significant variations. The results showed that lal parki (73.82 ± 0.64) had the highest moisture content in the flesh of potato while Shil bilati (70.92 ± 0.29) had lowest moisture content. The results of present investigation are in accordance with the earlier findings of Sotelo and Serrano,[Citation16] who reported that the moisture of various tested potato is in the range of 82–87%. Later, Naz et al.[Citation17] documented that Pakistani potato contained 73.17–81.44% moisture content grown in Abbottabad. The six potato types grown in the district of Okara were examined who found that their moisture contents ranged from 74.15% to 77.05%. Except for the accessions of Yams (Dioscorea spp.), there were no discernible differences in the moisture content. The lowest moisture reading was 58.18% in Pona (D. rotundata). Yellow’s dumetorum had the highest, at 79.26%[Citation18] but Shanthakumari et al.[Citation19] found a higher range of values between 71.06% and 92.48%. Low moisture content varieties would be more suited for long-term tuber storage and more effective for industrial processing.
Figure 2. Moisture content of potato varieties.
Ash
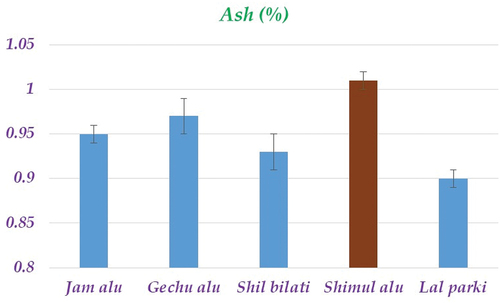
Ash content significantly differ among selected potato varieties mentioned in . The maximum ash content was observed in Shimul Alu (1.01%), whilst the lowest content was noticed in lal parki (0.9%). The present study results are in difference with the earlier findings of the ash content of potato grown in Okara District varied from 1.89% to 3.30%. Similarly, Naz et al.[Citation17] reported ash content of different Pakistani potato cultivars that differed from 3.67% to 5.18% on dry weight basis. Earlier, Javid et al.[Citation20] investigated the proximate composition of Diament, Cardinal, Lale-e-Faisal, and Desir. They reported that ash content was varied from 1.0% to 2.0% in tested potato cultivars. The differences in ash content among potato cultivars attributed might be due to their genotype. It has been found that non-genetic factors including soil, climate, and fertilizer use, among others, have an impact on the ash level of different potato cultivars. The ash levels of the cultivars ranged from 1.29% to 8.50% for Yams (Dioscorea spp.) and were substantially different (p < 0.05). These values were equivalent to those found in the literature and reported by Shanthakumari et al.[Citation19]
Figure 3. Ash content of potato varieties.
Fat
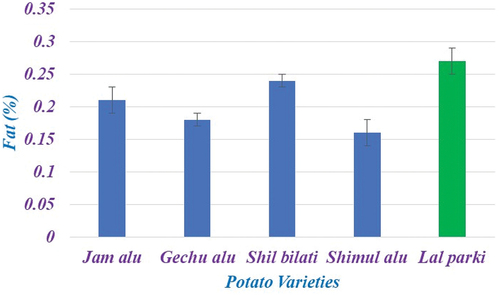
Significant variations between all of the chosen potato cultivars were explained by crude fat. The figure’s findings showed that the crude fat concentrations ranged from 0.16% to 0.27%. Lal parki had the highest fat content (0.27%), while Shimul alu had the lowest result for this metric (0.16%). According to this study, the generally consumed potato varieties had a minor difference in fat content from the wild potato yam varieties. Prior to this, Abbasi et al.[Citation21] found that the fat content of six potato cultivars grown in Okara District ranged from 0.80% to 1.29%. According to Naz et al.,[Citation17] one of their peers, the fat content of potatoes cultivated in Abbottabad ranged from 0.41% to 1.19%. Prior to this, Javed et al.[Citation20] reported the importance of potato cultivars’ fat contents, i.e. Lale-e-Faisal (0.55–0.57%), Diamant (0.57–0.58%), Desir (0.77–0.78%), and Cardinal (0.66%). According to , all yam cultivars had low fat concentrations below 1.0%, which were comparable to the values discovered on Cameroonian yams by Agbor-Egbe and Treche.[Citation22]
Figure 4. Fat content of potato varieties.
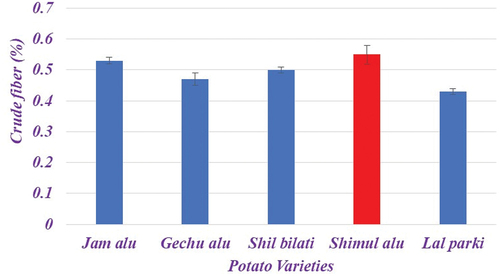
Crude fiber
Crude fiber shows some variation among tested potato varieties (). According to the available data, Shimul Alu offered the highest crude fiber content (0.55%) whereas lal parki had the lowest crude fiber value (0.43%). Here, the range of 0.43−0.55% showed a considerable variation in the crude fiber content of potato types. The results of the current study, which show that the crude fiber content of potato cultivars grown in Pakistan is in the range of 1.99–3.59%, are consistent with the previously reported value of crude fiber by Naz et al.[Citation17] The findings of Abbasi et al.,[Citation21] who recorded that the crude fiber content varied from 6.43% to 7.83% on a dry weight basis, further support the current findings.
Figure 5. Crude fiber content of potato varieties.
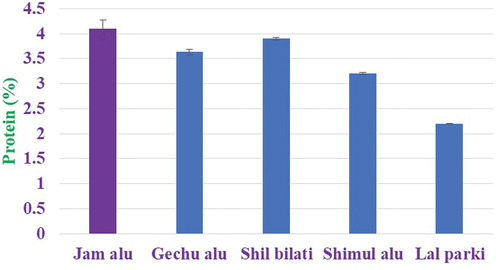
Protein
The protein content of selected potato varied significantly in the range of 2.2−4.13%, whereas Jam alu contain highest protein content (4.13%) and the crude protein content was low in lal parki (2.2%). indicates that wild varieties of potato yam contained in high amount of protein compared to widely consumed varieties of potato. The current findings are consistent with those made by Javid et al.[Citation20] who found that the protein level of potato cultivars varied from 1.20% to 1.64%. The protein level of the examined potato cultivars ranged from 0.95% to 1.39% on a dry weight basis, according to Naz et al..[Citation17] On the other hand, Abbasi et al.[Citation21] showed higher protein content, which ranged from 9.88% to 11.86% on a dry weight basis. A combination of genetic and non-genetic variables may be to blame for changes in the proximate composition. From a low of less than 1% for the Argentine cultivar Revolucio’n[Citation23] to a high of 4.2% for the Spanish cultivar Roja Rinon, protein content levels ranged widely.[Citation24] The cultivars’ protein content was generally lower (4.03–6.52%) for Yams (Dioscorea spp.) The levels were greater than the published range for cassava (0.2–1.5%) but similar to reported values for cocoyam (4.00–5.12) Sefa-Dedeh and Agyir-Sackey.[Citation25] The investigated cultivars’ protein contents varied substantially (p < 0.05).
Figure 6. Protein content of potato varieties.
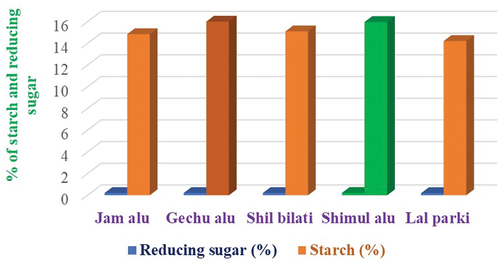
Carbohydrate
The below shows that the common potato variety, lal parki, had the lowest carbohydrate content (starch), at 14.21%, while the wild potato variety, Shimul Alu, had the highest. The carbohydrate content of cultivars of wild yam potatoes is clearly larger than that of widely consumed potatoes, which has a value of 14.21%. Uncooked, unprocessed potatoes contain more than 95% of their energy as carbohydrates. According to research on 53 different potato cultivars, starch levels range from 9.1% for an Indian cultivar called Kufri Bahar[Citation26] to 22.6% for an Argentine variety called Imilla Negra S. tuberosum ssp. andigena.[Citation23] These figures are equivalent to the literature’s values of 87.64% and 76.80–78.3%.[Citation27,Citation28]
Figure 7. Carbohydrate content of potato varieties.
Bioactive compound
Bioactive Compound Analysis was conducted for the determination of nutritional value of potato varieties. Total phenolic content, total flavonoid content, and antioxidant activity of the potato varieties are analyzed and presented in .
Table 1. Bioactive compound of potato varieties.
Antioxidant activity
The amount of antioxidant activity of extracts of potatoes in study was between 92 and 149 µmol Ascorbic Acid equivalents/g provided in . This table showed that wild variety of potato namely Jam alu contained highest antioxidant activity possessing 149 µmol AsA E/g whereas lal parki widely consumed potato contained lowest antioxidant activity possessing 92 µmol AsA E/g. It is clearly observed that wild varieties of yam potato possess high antioxidant activity compared to widely consumed potatoes. For red and purple-fleshed potato cultivars, antioxidant activity ranged from 111.3 to 164.2 μmol AsA/100 gFW, and ABTS ranged from 71.8 to 115 μmol AsA/100 g FW. For cultivars with yellow flesh, ABTS ranged between 75.2 and 80.1 mol AsA/100 g FW, whereas DPPH ranged from 49.2 to 64.9 mol AsA/100 g FW. Other scientists[Citation29,Citation30] had also noted a significant antioxidant activity for colored fleshed tubers. The antioxidant capacity values for colored fleshed cultivars are higher than those obtained using the ABTS method. The findings of the current study regarding the antioxidant capacity of cultivars with yellow meat are comparable to those published by Lachman et al..[Citation31] Al-Saikhan et al.[Citation32] found that the antioxidant activity of yellow and white-fleshed potato types ranged from 65.2% to 89.2% at 30 mg sample. At 40 mg, the activity of potato extracts in ethanol and water is 62.3% and 62.5%, respectively.[Citation33]
Total phenolic content
lists the phenolic component content of five different potato cultivars (results are represented as mg GAE/g sample). The phenolic content of the dry sample ranged from 1.01 to 2.85 mg GAE. The phenolic content of the various potato cultivar extracts varied significantly (p < 0.05). Jam alu, one of the potato cultivars, had the greatest phenolic content, then other variations. While Bilgin et al.[Citation34] found a phenolic content of 553,102.5 mg catechin/kg fresh weight (32.44–6.07 mg GAE/g), Al-Saikhan et al.[Citation32] reported that potato contained 11.41–27.47 mg GAE/g. Philippians potatoes had a phenol level that ranged from 34 to 55 mg GAE/g dry mass. According to Samarin et al.,[Citation35] ultrasonography can improve the efficiency of extracting the phenolic content from potato peel. The use of ultrasound and vigorous shaking throughout the extraction phase, as well as the circumstances and location in which their plant was cultivated, may have contributed to the higher production of total phenolic content in the extract of the agria cultivar by Hamouz et al.[Citation36] compared to our study. However, the information from this study about the Agria cultivar’s total phenolic content is comparable to that of Reyes.[Citation37]
Total flavonoid content
lists the flavonoid content of five different potato cultivars (results are presented as mg QE/100 g sample). The range of the total flavonoid concentration in 100 g of dry material was 18.04–41.38 mg QE. The flavonoid content of the various potato cultivar extracts varied significantly (p < 0.05). Jam alu has the greatest flavonoid concentration of all the potato cultivars, followed by others. Total flavonoid concentration in one study ranged from 11.02 to 40.96 mg quercetin equivalents (QE)/100 g FW. When it comes to the colored cultivars, CV TFC was greatest for Blue Congo, then CV. Purple Majesty, cv. 38.56 mg QE per 100 g FW. Red cranberry, 29.55 mg QE per 100 gFW. Additionally, cultivars with yellow meat recorded values starting at 11.02 mg QE/100 g FW at cv. 17.52 mg QE/100 g FW at cv for Brasovean. Carpatin. Similar to TAC, colored bodied cultivars also recorded the highest values of TFC.[Citation13] Some researchers claim that the potato cultivar and extraction technique have an impact on TFC. Accordingly, Lee et al.[Citation30] reported TFC values ranging from 36.47 to 157.33 mg catechin equivalent (CE)/100 g dried samples of purple-colored potato cultivars, from 36.47 to 50.80 mg CE/100 g dried samples of yellow cultivars, and from 75.35 mg CE/100 g dried samples of white cultivars. Furthermore, Damsa et al.[Citation38] used crude extracts of purple potatoes in 1% acidified methanol, 1% acidified ethanol, and 1% acidified deionized water to determine the total flavonoid content. They found that for TFC, the methanolic extract had the highest amount 105.31 mg/100 g FW and the ethanolic extract had the lowest 25.37 mg/100 g FW.
Conclusion
Wild varieties of potato yam contain high amount of protein, phenolic, flavonoid, and antioxidant activity compared to widely consumed potato varieties. Wild Shimul alu contains higher amount of fiber, ash, starch, and reducing sugar compared to other selected potato samples. Whereas wild Jam alu contains higher amount of protein and phenolic content, and possess antioxidant activity compared to other selected potato samples. Wild varieties of potato yam possess comparatively higher amount of nutritional facts compared to potato sample available in the market. According to the study, wild plants are a good dietary source of antioxidants like flavonoids and other polyphenolic components that contribute to human nutrition, as well as a possible source of critical elements including vitamins, minerals, proteins, and fibers.
Acknowledgments
The authors are highly grateful to the Department of Food Technology and Nutritional Science, Mawlana Bhashani Science and Technology University, Santosh, Tangail-1902, Bangladesh, for providing the laboratory amenities to the present study.
Disclosure statement
No potential conflict of interest was reported by the author(s).
Data availability statement
The datasets used and analyzed during the current study are available from the corresponding author on reasonable request.
Additional information
Funding
References
- Afolayan, A. J.; Jimoh, F. O. Nutritional Quality of Some Wild Leafy Vegetables in South Africa. Int. J. Food Sci. Nutr. 2009, 60(5), 424–431. DOI: 10.1080/09637480701777928.
- Ferguson, L. R. Chronic Inflammation and Mutagenesis. Mutat. Res. 2010, 690(1–2), 3–11. DOI: 10.1016/j.mrfmmm.2010.03.007.
- Gülçin, İ. Antioxidant Activity of Food Constituents: An Overview. Archives of Toxicology. Arch. Toxicol. 2012, 86(3), 345–391. DOI: 10.1007/s00204-011-0774-2.
- Wink, M. Plant Breeding: Importance of Plant Secondary Metabolites for Protection Against Pathogens and Herbivores. Theorem Appl. Genet. 1988, 75(2), 225–233. DOI: 10.1007/BF00303957.
- Kumar, S.; Prasad, A. K.; Iyer, S. V.; Vaidya, S. K. Systematic Pharmacognostical, Phytochemical and Pharmacological Review on an Ethno Medicinal Plant, Basella alba L. J. Pharmacogn. Phytochem. 2013, 5, 53–58.
- Ocvirk, S.; Kistler, M.; Khan, S.; Talukder, S. H.; Hauner, H. Traditional Medicinal Plants Used for the Treatment of Diabetes in Rural and Urban Areas of Dhaka, Bangladesh – an Ethnobotanical Survey. J. Ethnobiol. Ethnomed. 2013, 9(1), 43. DOI: 10.1186/1746-4269-9-43.
- Bhandari, M. R.; Kasai, T.; Kawabata, J. Nutritional Evaluation of Wild Edible Yam (Dioscorea Sp.) Tubers of Nepal. Food .Chem. 2003, 82(4), 619–623. DOI: 10.1016/S0308-8146(03)00019-0.
- Coursey, D. G. Yams. Longmans-Green: London; 1967. Yams. An account of the nature, origins, cultivation, and utilization of the useful members of the Dioscoreaceae. In Yams. An account of the nature, origins, cultivation, and utilization of the useful members of the Dioscoreaceae.
- Pratyush, K.; Masih, D.; Sonkar, C. 2015. Development and Quality Evaluation of Pumpkin Powder Fortified Cookies. Int. J. Sci. Eng. Technol. 3(4), 1034–1038.
- Horwitz, W.; Latimer, G. AOAC. Association of Analytical Chemists. Official Method of Analysis of AOAC International, 18th ed. Gaitherburg, Maryland, USA, 2005; Vol. 45, p 75–76.
- Gafta. (2018). Luff Schoorl Method for Determination of Reducing Sugar. https://www.gafta.com/write/MediaUploads/Contracts/2018/METHOD_10.1_SUGAR_-_LUFF_SCHOORL_METHOD.pdf
- Hildreth, A. C.; Brown, G. B. Modification of Lane-Eynon Method for Sugar Determination. J. Assoc. Off. Anal. Chem. 1942, 25(3), 775–778. DOI: 10.1093/jaoac/25.3.775.
- Peters, M. D.; Godfrey, C. M.; Khalil, H.; McInerney, P.; Parker, D.; Soares, C. B. Guidance for Conducting Systematic Scoping Reviews. JBI .Evidence Implementation. 2015, 13(3), 141–146. DOI: 10.1097/XEB.0000000000000050.
- Slinkard, K.; Singleton, V. L. Total Phenol Analysis: Automation and Comparison with Manual Methods. Am. J. Enol. Vitic. 1997, 28(1), 49–55. DOI: 10.5344/ajev.1977.28.1.49.
- Soare, R.; Dinu, M.; Babeanu, C.; Soare, M. Evaluation and Comparison of Antioxidant Activity and Biochemical Compounds in Some Coloured Potato Cultivars. Plant. Soil Environ. 2020, 66(6), 281–286. DOI: 10.17221/202/2020-PSE.
- Sotelo, A.; Serrano, B. High-Performance Liquid Chromatographic Determination of the Glycoalkaloids α-Solanine and α-Chaconine in 12 Commercial Varieties of Mexican Potato. J. Agric. Food Chem. 2000, 48(6), 2472–2475. DOI: 10.1021/jf990755t.
- Naz, F.; Ali, A.; Iqbal, Z.; Akhtar, N.; Asghar, S.; Ahmad, B. Effect of Different Levels of NPK Fertilizers on the Proximate Composition of Potato Crop at Abbottabad. Sarhad J. Agric. 2011, 27(3), 353–356.
- Sefa-Dedeh, S.; Agyir-Sackey, E. K. Chemical Composition and the Effect of Processing on Oxalate Content of Cocoyam Xanthosoma Sagittifolium and Colocasia Esculenta Cormels. Food. Chem. 2004, 85(4), 479–487. DOI: 10.1016/S0308-8146(02)00244-3.
- Shanthakumari, S.; Mohan, V. R.; de Britto, J. Nutritional Evaluation and Elimination of Toxic Principles in Wild Yam (Dioscorea Spp.). Trop. Subtrop. Agroecosystems. 2008, 8, 319–325.
- Javed, M. A.; Sarwar, M.; Ahmad, M. M.; Abbas, S. M. N. Varietal Suitability of Potatoes for Dehydration. Pak. J. Agric. Sci. 1995, 32(2–3), 135–139.
- Abbasi, A.; Altmann, J.; Hossain, L. Identifying the Effects of Co-Authorship Networks on the Performance of Scholars: A Correlation and Regression Analysis of Performance Measures and Social Network Analysis Measures. J. Informetr. 2011, 5(4), 594–607. DOI: 10.1016/j.joi.2011.05.007.
- Agbor-Egbe, T.; Treche, S. Evaluation of the Chemical Composition of Cameroonian Yam Germplasm. J. Food Compost. Anal. 1995, 8(3), 274–283. DOI: 10.1006/jfca.1995.1020.
- Jimenez, M. E.; Rossi, A. M.; Samma, N. C. Phenotypic, Agronomic, Nutritional Characteristics of Seven Varieties of Andean Potatoes. J. Food Compost. Anal. 2009, 22(6), 613–616. DOI: 10.1016/j.jfca.2008.08.004.
- Ritter, E.; Barandalla, L.; Lopez, R.; Ruiz de Galarreta, J. I. Exploitation of Exotic, Cultivated Solanum Germplasm for Breeding and Commercial Purposes. Potato. Res. 2008, 51(3–4), 301–311. DOI: 10.1007/s11540-008-9109-y.
- Charles, A. L.; Sriroth, K.; Huang, T. C. Proximate Composition, Mineral Contents, Hydrogen Cyanide and Phytic Acid of 5 Cassava Genotypes. Food. Chem. 2005, 92(4), 615–620. DOI: 10.1016/j.foodchem.2004.08.024.
- Negi, P. S.; Nath, N. Effect of Partial Dehydration on Quality of Canned Potatoes. Eur. Food Res. Technol. 2002, 215(3), 231–234. DOI: 10.1007/s00217-002-0540-z.
- Akubor, P. I. Effect of ascorbic acid and citric acid treatments on the functional and sensory properties of yam flour. Inte. J. of Agri. Pol. Res. 2013,1(4), 103–108.
- Udensi, E. A.; Oselebe, H. O.; Iweala, O. O. The Investigation of Chemical Composition and Functional Properties of Water Yam (Dioscorea Alata): Effect of Varietal Differences. Pak. J. Nutr. 2008, 7(2), 342–344. DOI: 10.3923/pjn.2008.342.344.
- Hamouz, K.; Lachman, J.; Pazderů, K.; Tomášek, J.; Hejtmánková, K.; Pivec, V. Differences in Anthocyanin Content and Antioxidant Activity of Potato Tubers with Different Flesh Colour. Plant. Soil Environ. 2011, 57(10), 478–485. DOI: 10.17221/265/2011-PSE.
- Lee, S. H.; Oh, S. H.; Hwang, I. G.; Kim, H. Y.; Woo, K. S.; Woo, S. H.; Kim, H. S.; Lee, J.; Jeong, H. S. Antioxidant Contents and Antioxidant Activities of White and Colored Potatoes (Solanum Tuberosum L.). Preventive Nutr. Food Sci. 2016, 21(2), 110–116. DOI: 10.3746/pnf.2016.21.2.110.
- Lachman, J.; Hamouz, K.; Šulc, M.; Orsák, M.; Pivec, V.; Hejtmánková, A.; Dvořák, P.; Čepl, J. Cultivar Differences of Total Anthocyanins and Anthocyanidins in Red and Purple-Fleshed Potatoes and Their Relation to Antioxidant Activity. Food. Chem. 2009, 114(3), 836–843. DOI: 10.1016/j.foodchem.2008.10.029.
- Al-Saikhan, M. S.; Howard, L. R.; Miller, J. C. Antioxidant Activity and Total Phenolics in Different Genotypes of Potato (Solanum Tuberosum, L.). J. Food Science. 1995, 60(2), 341–343. DOI: 10.1111/j.1365-2621.1995.tb05668.x.
- Kaur, C.; Kapoor, H. C. Anti-Oxidant Activity and Total Phenolic Content of Some Asian Vegetables. Int J Food Sci. Techno. 2002, 37(2), 153–161. DOI: 10.1046/j.1365-2621.2002.00552.x.
- Bilgin, S.; Samsun, N.; Samsun, O.; KALAYCI, F. Orta Karadeniz’de 2004-2005 av sezonunda hamsi’nin, Engraulis encrasicolus L., 1758, boy-frekans analiz metodu ile populasyon parametrelerinin tahmini. J. Fish Aquat Sci. 2006, 23(3), 359–364.
- Samarin, A. M.; Ahmadi, M. R.; Azuma, T.; Rafiee, G. R.; Amiri, B. M.; Naghavi, M. R. Influence of the Time to Egg Stripping on Eyeing and Hatching Rates in Rainbow Trout Oncorhynchus Mykiss Under Cold Temperatures. Aquaculture. 2008, 278(1–4), 195–198. DOI: 10.1016/j.aquaculture.2008.03.034.
- Hamouz, K.; Lachman, L.; Čepl, L.; Dvořák, P.; Pivec, P.; Prášilová, M. Site Conditions and Genotype Influence Polyphenol Content in Potatoes. Hortic. Sci. 2007, 34(4), 132–137. DOI: 10.17221/1894-HORTSCI.
- Reyes, L. F.; Miller, J. C.; Cisneros-Zevallos, L. Antioxidant Capacity, Anthocyanins and Total Phenolics in Purple-And Red-Fleshed Potato (Solanum Tuberosum L.) Genotypes. Am. J. Potato Res. 2005, 82(4), 271–277. DOI: 10.1007/BF02871956.
- Damsa, F.; Woinaroschy, A.; Olteanu, G. Quantification of Total Flavonoid and Total Anthocyanin Content from Purple Potato. Rev. Chim. 2015, 66, 227–229.