
 ?Mathematical formulae have been encoded as MathML and are displayed in this HTML version using MathJax in order to improve their display. Uncheck the box to turn MathJax off. This feature requires Javascript. Click on a formula to zoom.
ABSTRACT
Infrared heating has been widely used in food processing; however, there are few studies on the VIS-NIR radiation properties of food. We measured the radiation properties of starchy foods (potato, Chinese yam and sweet potato) and protein foods (beef tenderloin, pork tenderloin and chicken breast) and dispersions of starches and proteins before and after heat treatment in the 0.38–2.5 μm band. The results show that the radiation penetration depths (RPDs) of all tested foods are relatively high in the 0.6–1.3 μm band, with maximum values in the range of 4–8 mm. After heat treatment, the RPDs of starchy foods slightly increase, while those of protein foods decrease to approximately 1/2 of the original values. Comparative heating experiments of potato, Chinese yam and sweet potato heated by a halogen lamp (1.04 μm) and a carbon fiber lamp (1.76 μm) with peak wavelengths in and out of the 0.6–1.3 μm band, respectively, show that the foods heated by the halogen lamp have faster heating rates and more uniform temperature distributions. Because starchy and protein foods have high RPDs in the 0.6–1.3 μm band, the VIS-NIR radiation containing this band is expected to achieve rapid heating.
Introduction
Food safety and quality have always been the focus of consumers and food industries, and heat treatment is the most important technology to guarantee food safety and improve its quality.[Citation1] Thermal radiation is one of the most common heat sources and can be mainly divided into visible (0.38–0.78 μm, VIS), near-infrared (0.78–2.5 μm, NIR), mid-infrared (2.5–25 μm, MIR), and far-infrared (25–1000 μm, FIR) radiation by wavelength.[Citation2] Radiant heating can provide immediate and high heat flux energy input to food and has been widely used in food processing, such as baking, roasting, drying, blanching, peeling, and sterilizing.[Citation3–8]
The radiation properties of food, especially the radiation penetration depth (RPD), have a significant impact on the food heating process. The food processing industry mainly utilizes NIR-MIR radiation above 1.4 μm.[Citation9–11] First, the major components of most foods are water and organic compounds (proteins, sugars, lipids, etc.), which have high absorption above 1.4 μm and 2.5 μm, respectively.[Citation12,Citation13] Second, emitters with lower operating temperatures have the advantages of a simple structure and a low cost; hence, typical emitters operate at 650–1200°C,[Citation9] and most of the radiation is distributed above 1.4 μm. However, the radiation in this band has a low penetration depth[Citation8,Citation12]; hence, the heat is mainly formed on the food surface by radiation and transfers to the core by conduction, resulting in a low heating rate of the food core, which makes it unsuitable to heat thick food materials.
VIS-NIR radiation below 1.4 μm has a higher penetration depth,[Citation14–16] and emitters can provide higher energy density because of higher operating temperatures. To suit differentiated application scenarios, there have been studies on the heat treatment of food by VIS-NIR radiation. For example, halogen lamps can emit VIS-NIR radiation, which can be used to heat food alone or combined with other heating methods, such as microwave heating.[Citation17–20] Solar radiation energy is mainly distributed in the VIS-NIR band, which can be used for food drying.[Citation21,Citation22] In addition, there have been studies on food cooking by laser heating with wavelengths in the VIS-NIR band.[Citation23,Citation24] Therefore, it is necessary to study the radiation properties of food in this band, especially the RPD. Almeida measured the RPD of potatoes in the 0.7–2.5 μm band and found that it was closely related to the wavelength and moisture content, and its maximum value was approximately 3 mm.[Citation14] Pan indicated that the RPD of raw potato at 1 μm was 6 mm, which was significantly different from the previous result, and that of dry potato at 0.88 μm was 15–18 mm.[Citation15] Pan also indicated that the RPDs of bread, crackers, carrots, ketchup, and apples at specific wavelengths were in the range of 1–12 mm. Erdogdu tested the RPDs of black pepper seeds, paprika powder, and oregano leaves and found that their RPDs were 3.6–3.7 mm when the water activity was 0.88. RPDs were found to increase with increasing water activity for black pepper seeds and paprika powder, while there was no significant change for oregano leaves.[Citation16] In addition, the compositions and structures of food will change during cooking, which will affect its radiation properties and thus the heating process; however, there have been no studies on the heat treatment effects on the radiation properties of food.
In this work, the spectral reflectances and transmittances of starchy foods (potato, Chinese yam and sweet potato) and protein foods (beef tenderloin, pork tenderloin and chicken breast) and dispersions of starches and proteins before and after heat treatment in the 0.38–2.5 μm band were measured, and the RPDs of foods were calculated. Based on the discrepancy in the RPD of food for different wavebands, we experimentally compared the heating effects of a halogen lamp with a peak wavelength of 1.04 μm and a carbon fiber lamp with a peak wavelength of 1.76 μm on potato, Chinese yam and sweet potato. Our study revealed the causes of the spectral behavior of the RPD and provides a theoretical basis for the optimization of radiant heating methods for food.
Materials and methods
Radiation property measurements
Three kinds of typical starchy foods (potato, Chinese yam and sweet potato) and three kinds of typical protein foods (beef tenderloin, pork tenderloin and chicken breast) were selected as test objects, among which the beef tenderloin and chicken breast are frozen foods, and they were naturally thawed at room temperature (approximately 25°C) over 15 to 18 hours. In consideration of thickness and transmittance measurement accuracies, all foods were cut into slices with a thickness of approximately 5 mm. The heat treatment process of food was as follows: the food was cut into thick blocks with a thickness of approximately 30 mm, baked in an oven at 200°C for 20 minutes, and cut into slices with a thickness of approximately 5 mm. For each food, four samples were prepared, and the thicknesses at three evenly spaced positions along the length of each sample were measured. As a result, a total of 12 measurements for each food were averaged, and the results are presented in .
Table 1. Average thickness and moisture content of food samples.
Since starch and protein are the primary constituents of starchy and protein foods, respectively, measuring the reflectance and transmittance of starch and protein dispersions can help in interpreting the spectral behavior of the corresponding foods. Potato starch was purchased from Aladdin Reagent Company, and Chinese yam starch and sweet potato starch were purchased from an online shopping platform. Agar as a stabilizer was purchased from Zhejiang Yinuo Biotechnology Company. The preparation process of the starch dispersion was as follows: the agar was placed into boiling water for 3 minutes, and then the agar solution was cooled to room temperature in a water bath. After the preparation of the agar solution, the starch was added into the agar solution, and the starch dispersion was obtained under vigorous stirring for 5 minutes. To prepare the dispersions of gelatinized starch, the starch was placed into water at 95°C and heated in a water bath for 30 minutes. Notably, the mass fractions of starch in the starch dispersions and the dispersions of gelatinized starch are both 2.0%. Considering that it is difficult to isolate the protein from meat, whey protein and egg white were selected as test objects. It should be noted that the protein content of the dry matter of egg white is above 78%.[Citation25] Whey protein, which can be dissolved in water and form a stable dispersion, was purchased from Zhejiang Yinuo Biotechnology Company, and its heat treatment process was the same as that of starch. Because egg white will coagulate during heating, a cuvette with an optical path of 5 mm was used to hold egg white and then heated in a water bath at 95°C for 5 minutes.
After sample preparation, the reflectance and transmittance in the 0.38–2.5 μm band were measured by a spectrophotometer (DUV-3700) with an accuracy of 0.005 as soon as possible. Food samples were clamped with two quartz glasses and then measured, and the effect of quartz glasses on the results was eliminated by a BaSO4 standard white plate with quartz glass. For each type of food, four samples were measured and averaged. Component samples were transferred to cuvettes with an optical path of 5 mm and then measured. Since the dispersions of the components are homogeneous, only one sample was measured for each component.
Moisture content
The changes in moisture contents of food samples before and after heat treatment may also affect their radiation properties, hence it is necessary to characterize the moisture content. After spectrum measurement, the moisture contents of all food samples (four samples for each type of food) were immediately characterized. The glass dishes were weighed using a balance with an accuracy of 0.001 g, and the mass was recorded as WG. Fresh food samples were placed in glass dishes, and the total mass was weighed, which was recorded as WF. After weighing, the samples were dried in an oven at 102°C to constant weight. After drying, the glass dishes and samples were weighed again to obtain the dry weight (WD) and moisture content was determined. The moisture content results are presented in .
Radiation penetration depth calculations
When radiation transmits in food, it will decay due to the effects of absorption and scattering. The radiation flux in food can be expressed as:
where I0 and I are the initial radiation flux and the radiation flux (W/m2) at the transmission distance of x, respectively, and is the attenuation coefficient (mm−1). The radiation penetration depth (RPD, mm) is the distance for which the radiation flux decreases to 1/e of its initial value, which can be obtained by[Citation26]:
where T, R and d are the transmittance, reflectance and thickness of food, respectively. Notably, when the transmittance is less than the measurement accuracy (0.005), the measurement result may be hidden by noise. In such case, the transmittance will be regarded as 0, and the corresponding RPD will be 0 mm. We calculated the RPD of each sample, and the result of the RPD of each food was the average of four samples.
Radiant heating experiments
Potato, Chinese yam and sweet potato were selected as test objects, and their heating effects by a halogen lamp with a peak wavelength of 1.04 μm and a carbon fiber lamp with a peak wavelength of 1.76 μm under the same heat flux received by the top surface of food and under the same temperature rising rate of the top surface of food, respectively, were experimentally compared. Notably, the reason why the protein foods were not selected is that they are soft and will be severely deformed during heating, which will greatly influence temperature measurements. A schematic diagram of the experimental system is shown in . From top to bottom, there are a light source, food, a grid support and a lifting table. The central point of each component is located on the same vertical line; hence, the radiation emitted by the light source can be normally incident upon the food surface. The halogen lamp and the carbon fiber lamp with a rated power of 1060 W are produced by Hefei Quickly Electric Company, which are composed of a U-shaped reflector and a lamp. The foods were cut into rectangular blocks with dimensions of 60 mm × 50 mm × 26 mm and placed on a stainless steel grid support to reduce the effect of heat conduction, and the distance from the light source was adjusted by the lifting table.
Figure 1. Schematic diagram of the experimental system.
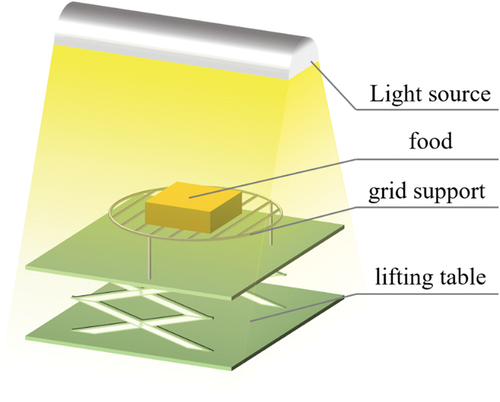
The radiation heat flux received by the top surface of the food was measured by a radiation heat flux sensor (TS-34CB) with an accuracy better than 3% under the same operating conditions. Three T-type thermocouples with a diameter of 0.3 mm were placed into the food sample: one at the center of the plane 1 mm from the top surface, one at the center of the plane 1 mm from the bottom surface, and the last one at the center. During heating, the temperatures were recorded with a 5 s sampling interval. The experiment was repeated 3 times for each operating condition, and the results were averaged.
To achieve the condition of the same heat flux received by the top surface of food and the condition of the same temperature rising rate of the top surface of food, the distance between the light source and the food should be adjusted. According to pre experiments, it is found that the heat flux received by the top surface of food is 13.0 kW/m2 when the distance between the halogen lamp and the food is 130 mm, and the same heat flux is obtained when the distance between the carbon fiber lamp and the food is also 130 mm. The distances between the halogen lamp and the foods remain at 130 mm, and their surface temperature rising rates are closest to those heated by the carbon fiber lamp when the distances between the carbon fiber lamp and the foods are 142 mm for potato and Chinese yam and 147 mm for sweet potato, in which situations the heat fluxes are 11.3 kW/m2 and 10.6 W/m2, respectively.
Statistical analysis
The results are presented as the means ± standard deviation, where the standard deviation (SD) was calculated by Bessel's formula[Citation27]:
where Xi is the result of the i-th measurement, is the mean value, and n is the number of measurements.
Results and discussion
Radiation properties of starchy and protein foods
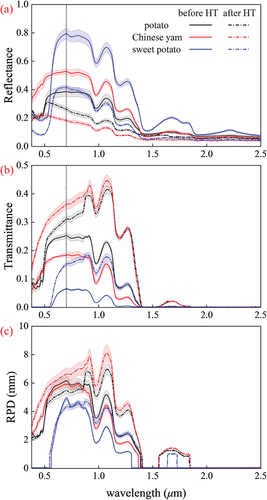
The reflectance and transmittance of starchy foods are presented in , respectively. Based on these measurement results, the RPDs can be calculated according to EquationEquation (3)(3)
(3) , as shown in . Before heat treatment, the RPDs of starchy foods above 1.3 μm are near 0 mm, while those in the approximately 0.6–1.3 μm band are relatively high, with maximum values in the range of 4–6 mm. For the waveband below 0.6 μm, the RPDs of potato and Chinese yam are relatively high, while that of sweet potato is close to 0 mm. These RPD behaviors at various wavebands corresponds to the results of the reflectance and transmittance. From , it can be observed that the spectra of starchy foods before heat treatment are similar above 0.7 μm. They exhibit similar variation trends, especially the significant decreases in spectral reflectance and transmittance below approximately 1.4 μm which are caused by water absorption, and the water absorption characteristics at 0.98 μm, 1.20 μm and 1.45 μm.[Citation13] However, the spectra of starchy foods are quite different below 0.7 μm. After heat treatment, the RPDs in the 0.6–1.3 μm band and near 1.7 μm slightly increase (), which are caused by the decreases in reflectance () and increases in transmittance ().
Figure 2. Radiation properties of starchy foods before and after heat treatment (HT): (a) reflectance, (b) transmittance, and (c) radiation penetration depth (RPD). Short dotted lines represent 0.7 μm.
present the radiation properties of protein foods before and after heat treatment. As depicted in , the RPDs of protein foods before heat treatment are also relatively high in the approximately 0.6–1.3 μm band, with maximum values in the range of 4–8 mm, and those near 1.7 μm are approximately 1 mm. The reflectance/transmittance spectra of protein foods are similar above 0.7 μm and different below 0.7 μm, which are similar to those of starchy foods. After heat treatment, the reflectances of protein foods increase, while the transmittances decrease, resulting in a decrease in the RPDs in the 0.6–1.3 μm band to approximately 1/2 of the original values, and those near 1.7 μm decrease to 0 mm. In addition, it can be seen from that the moisture contents of protein foods decrease significantly after heat treatment due to the reduction in water holding capacity,[Citation28] which may be one of the reasons for the decrease in radiation penetration depth.[Citation16]
Figure 3. Radiation properties of protein foods before and after heat treatment (HT): (a) reflectance, (b) transmittance, and (c) radiation penetration depth (RPD). Short dotted lines represent 0.7 μm.
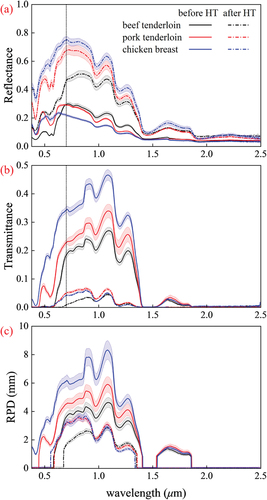
The RPD of food has important effects on its heating rate and flavor. As seen from , the RPDs above 1.3 μm for starchy foods and protein foods are generally less than 1 mm. This will result in a high food surface temperature due to surface heating, which could promote the Maillard reaction and thus create baking flavors such as excellent color and odor,[Citation12] but it also leads to an undesirable low heating rate of the food core. Conversely, because of the high RPD of food in the 0.6–1.3 μm band, the radiation in this band may achieve a higher internal heating rate than long wavelength infrared radiation.
Radiation properties of starch and protein dispersions
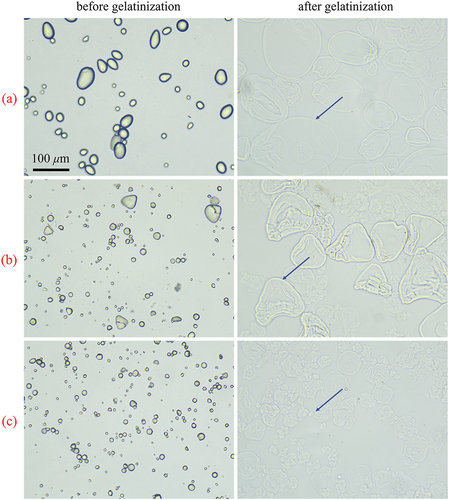
Notably, it can be seen from that after heat treatment, the RPDs of starchy foods increase, while those of protein foods decrease. To explain this phenomenon, we investigated the radiation properties of starch and protein before and after heat treatment using dispersions. The reflectance and transmittance spectra of water and agar solution with a mass fraction of 0.3% were found to be essentially the same; hence, the reflectance and transmittance of the starch-agar dispersion can be considered equal to those of the uniformly dispersed starch dispersion. presents the radiation properties of starch dispersions. Comparing , it can be observed that the reflectance spectra of starch dispersions are similar to those of starchy foods above 0.7 μm, which is consistent with the phenomenon of transmittance spectra (). This indicates that the starch scattering and water absorption have important effects on the spectral characteristics of starchy foods. It can also be seen that the spectra differences below 0.7 μm among various starchy foods are not related to the starch scattering. Additionally, the absorption coefficients of dry matter of leaves such as lignin, cellulose and pectin in the 0.45–1.4 μm band are relatively low and without abrupt changes,[Citation29] and the cell wall components in leaves and foods are similar. Therefore, it can be demonstrated that the spectra differences below 0.7 μm among various starchy foods is mainly caused by the difference in pigments. After gelatinization, the starch dispersions become lighter in color (), and their reflectances significantly decrease, while the transmittances increase, showing similar trends to those of starchy foods. These changes are related to the expansion of starch granules. shows the photomicrographs of starch granules. After gelatinization, the starch granules expand or even break with water absorption, and the color becomes lighter. Specifically, it is difficult to distinguish starch granules and water, suggesting that the refractive index of gelatinized starch in the visible light band is close to that of water, which will result in weaker scattering and lead to a decrease in reflectance and an increase in transmittance for starch dispersions after gelatinization. This also explains the similar phenomenon for starchy foods after heat treatment.
Figure 4. Effects of heat treatment (HT) on the (a) appearance, (b) reflectance and (c) transmittance of starch dispersions.
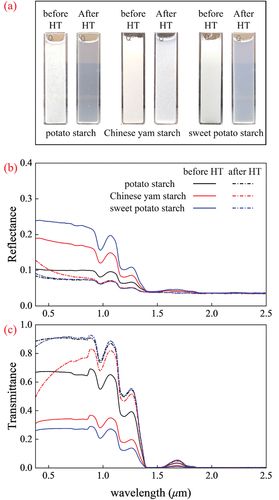
Figure 5. Photomicrographs of (a) potato starch dispersions, (b) Chinese yam starch dispersions and (c) sweet potato starch dispersions with a mass fraction of 2.0%.
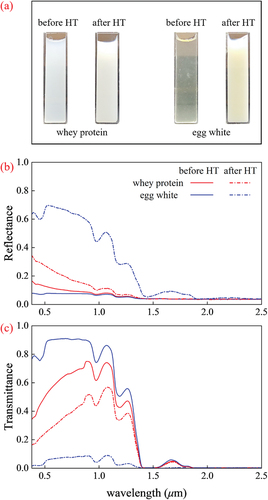
presents the radiation properties of protein dispersions. The whey protein dispersion appears milky white, and its spectra are similar to those of protein foods above 0.7 μm. In contrast, the egg white is pale yellow and transparent, and its spectra are close to those of water. After denaturation, the transparency of the whey protein dispersion decreases, and its color becomes whiter, while the egg white turns into a milky white solid. Correspondingly, the reflectances of protein dispersions significantly increase, and the transmittances decrease, exhibiting similar trends to those of protein foods, and the spectra remain similar to those of protein foods above 0.7 μm. The changes in spectra of protein dispersions are related to the denaturant behavior of proteins. The diameters of protein molecules are in the range of 1–100 nm, and their dispersions are hydrophilic colloids.[Citation30] During the heating process, the intramolecular hydrogen bonds and disulfide bonds are broken, resulting in the unfolding of the spatial structure of the protein and the exposure of internal groups, which leads to the formation of different molecular aggregates through hydrophobic interactions, hydrogen bonds, and disulfide bonds. Molecular aggregates can be mainly divided into granular aggregates and linear aggregates,[Citation31] which can be crosslinked to form gels with network structures. The granular gel is opaque due to strong scattering, while the linear gel is transparent or translucent because of weak scattering.[Citation31] Whey proteins aggregate to form granular aggregates during the heating process,[Citation32] and the egg white forms granular gels after thermal denaturation,[Citation33] which will enhance the scattering and lead to changes in the spectra of the dispersions.
Figure 6. Effects of heat treatment (HT) on the (a) appearance, (b) reflectance and (c) transmittance of protein dispersions.
Notably, the denaturation behavior of proteins in beef tenderloin, pork tenderloin and chicken breast is a combination of that of whey protein and egg white. These three types of meat are mainly composed of muscle, where proteins can be divided into globular and fibrous proteins,[Citation34] of which the latter are crosslinked to form linear gels, and their thermal denaturation processes are similar to those of whey protein and egg white. During the heating process, globular proteins aggregate and crosslink, while fibrous proteins shrink and agglomerate, leading to an increase in the disorder degree. The muscle will turn into granular gel, resulting in an increase in scattering. In fact, the transmittance of proteins may remain unchanged or even increase only if they form linear gels after denaturation.
Heating effects of a halogen lamp and a carbon fiber lamp on starchy foods
As mentioned above, using radiation in the 0.6–1.3 μm band to heat food may achieve a higher heating rate than long wavelength infrared. To verify this conjecture, we experimentally compared the heating effects of a halogen lamp (1.04 μm) and a carbon fiber lamp (1.76 μm) with peak wavelengths in and out of this band on potato, Chinese yam and sweet potato under the same heat flux received by the top surface of food and under the same temperature rising rate of the top surface of food, respectively. In the heating process of food, the key to limiting the increase in its heating rate is the surface temperature of food rather than heating power, because excessive surface temperature will lead to food carbonization.[Citation35] Therefore, the comparison results under the same temperature rising rate can provide a better reflection of the difference in the heating rate of food heated by the two different light sources.
present the temperatures of potato, Chinese yam and sweet potato during the heating process. It is noted that the standard deviations of the top surface temperatures of potato and Chinese yam widen rapidly after reaching 100°C because they generate hard shells that separate from the lower material at that temperature; hence, the temperature measured by the thermocouple may be the result of the hard shell, steam, or lower material. Considering the effect of evaporation, the top surface temperature above 100°C can be regarded as 100°C. As seen from , under the same heat flux, the temperature of the top surface of the potato heated by the halogen lamp is lower than that heated by the carbon fiber lamp, with a maximum difference in temperature of 17.3°C at 635 s. However, the temperature at the center is higher than that heated by the carbon fiber lamp, with a maximum difference in temperature of 3.4°C at 1315 s. This indicates that the temperature distribution of the potato heated by the halogen lamp is more uniform. Under the premise of retaining the crispy shell and baking flavor of food, a lower surface temperature can improve food safety, such as reducing the production of acrylamide.[Citation36] shows that under the same surface temperature rising rate, the center temperature of the potato heated by the halogen lamp is higher than that heated by the carbon fiber lamp, and the difference in temperature first increases with time, after reaching a maximum value of 8.1°C at 1110 s and then slowly decreases, with a temperature difference of 5.9°C at the end of the experiment. The time required for potatoes heated by the halogen lamp to reach 60°C and 70°C is shortened by 19.9% and 26.9%, respectively, compared to that heated by the carbon fiber lamp (), which demonstrates the volume heating effect of radiation in the 0.6–1.3 μm band. According to , the center temperature of Chinese yam heated by the halogen lamp is almost the same as that heated by the carbon fiber lamp under the same heat flux. shows that under the same surface temperature rising rate, the center temperature of Chinese yam heated by the halogen lamp is higher than that heated by the carbon fiber lamp, with a maximum difference in temperature of 6.9°C, which is slightly lower than that of potato (8.1°C). The time required for Chinese yam heated by the halogen lamp to reach 60°C and 70°C is shortened by 18.4% and 17.5%, respectively, compared to that heated by the carbon fiber lamp (). As shown in , under the same heat flux, the center temperature of sweet potato heated by the halogen lamp is slightly lower than that heated by the carbon fiber lamp, with a maximum difference in temperature of 3.8°C. It can be seen from that under the same surface temperature rising rate, the center temperature of sweet potato heated by the halogen lamp is higher than that of sweet potato heated by the carbon fiber lamp; however, the maximum difference in temperature is only 4.9°C, which is significantly lower than that of potato (8.1°C), and the time required for sweet potato heated by the halogen lamp to reach 60°C and 70°C is shortened by only 10.9% and 11.4%, respectively, compared to that heated by the carbon fiber lamp (). Compared with the results heated by the carbon fiber lamp, the temperature differences and time reductions of potato, Chinese yam and sweet potato heated by the halogen lamp decrease in turn. This is mainly because their average absorptivities (1-R) in the 0.6–1.3 μm band decrease in turn, which are 0.69, 0.58 and 0.34, resulting in weaker volume heating by radiation in this band.
Figure 7. Temperatures of (a) potato, (b) Chinese yam and (c) sweet potato heated by a halogen lamp and a carbon fiber lamp. Subscripts: H = heated by the halogen lamp, C = heated by the carbon fiber lamp.
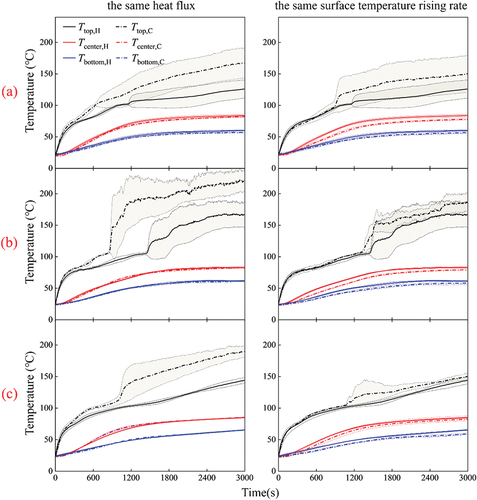
Table 2. Time required for potato, Chinese yam and sweet potato in the comparative experiments under the same surface temperature rising rate.
Although it is known that halogen lamps emit VIS-NIR radiation with a higher penetration depth than typical infrared sources that emit in the MIR band,[Citation37] the quantitative impact of this difference on the heating effect has not been studied. Moreover, the RPDs of food in the entire VIS-NIR band have rarely been reported in the literature, hence the band that can achieve volume heating is unknown. By contrast, our radiation property measurements and radiant heating experiments demonstrate that radiation in the 0.6–1.3 μm range can achieve volume heating, and using radiation in this band to heat food can achieve a higher heating rate than long wavelength infrared radiation. Notably, the halogen lamp radiates a large amount of radiation above 1.3 μm. For a blackbody with a peak wavelength of 1.04 μm, 37.6% of its radiation is in the 0.6–1.3 μm band according to Wien’s displacement law and Planck’s Law for blackbody radiation,[Citation29] and 9.2% for a blackbody with a peak wavelength of 1.76 μm as a comparison. A large amount of radiation above 1.3 μm will heat the food by surface heating; thus, measures that can increase the energy proportion of radiation in the 0.6–1.3 μm band, such as depositing designed one-dimensional photonic crystals on the lamp tube[Citation38] will further increase the heating rate. In addition, considering that the food types and the heat treatment process can affect radiation properties, radiant heating on different foods will result in different heating effects; hence, finding an electromagnetic wave with an appropriate RPD for most foods may achieve a universal balance between rapid heating and baking flavor.
Conclusion
The same kind of foods have similar spectra above 0.7 μm because of the same main component but different spectra below 0.7 μm due to the effect of pigments. The RPDs of all tested foods are relatively high in the 0.6–1.3 μm band, with maximum values in the range of 4–8 mm. After heat treatment, the RPDs of starchy foods slightly increase, and those of protein foods decrease to approximately 1/2 of the original values. The experimental results demonstrate that using radiation in the 0.6–1.3 μm band to heat food can achieve a higher heating rate and a more uniform temperature distribution than long wavelength infrared.
Acknowledgments
We would like to thank support from the CAS Talent Introduction Program (Category B) and the Startup Funds for Introduced Talents of USTC (KY2090000076).
Disclosure statement
No potential conflict of interest was reported by the author(s).
Additional information
Funding
References
- Kubo, M. T. K.; Baicu, A.; Erdogdu, F.; Poças, M. F.; Silva, C. L. M.; Simpson, R.; Vitali, A. A.; Augusto, P. E. D. Thermal Processing of Food: Challenges, Innovations and Opportunities. A Position Paper. Food Rev. Int. 2021, 1–26. DOI: 10.1080/87559129.2021.2012789.
- Porep, J. U.; Kammerer, D. R.; Carle, R. On-Line Application of Near Infrared (NIR) Spectroscopy in Food Production. Trends Food Sci. Technol. 2015, 46(2), 211–230. DOI: 10.1016/j.tifs.2015.10.002.
- Shahi, S.; Khorvash, R.; Goli, M.; Ranjbaran, S. M.; Najarian, A.; Mohammadi Nafchi, A. Review of Proposed Different Irradiation Methods to Inactivate Food‐Processing Viruses and Microorganisms. Food Sci. Nutr. 2021, 9(10), 5883–5896. DOI: 10.1002/fsn3.2539.
- Huang, D.; Yang, P.; Tang, X.; Luo, L.; Sunden, B. Application of Infrared Radiation in the Drying of Food Products. Trends Food Sci. Technol. 2021, 110, 765–777. DOI: 10.1016/j.tifs.2021.02.039.
- Delfiya, D. S. A.; Prashob, K.; Murali, S.; Alfiya, P. V.; Samuel, M. P.; Pandiselvam, R. Drying Kinetics of Food Materials in Infrared Radiation Drying: A Review. J. Food Process Eng. 2022, 45(6), e13810. DOI: 10.1111/jfpe.13810.
- Zhou, Y.; Vidyarthi, S. K.; Yang, X.; Duan, X.; Liu, Z.; Mujumdar, A. S.; Xiao, H. Conventional and Novel Peeling Methods for Fruits and Vegetables: A Review. Innov. Food Sci. Emerg. Technol. 2022, 77, 102961. DOI: 10.1016/j.ifset.2022.102961.
- Puneet, K.; Chakraborty, S. K. Infrared Radiation: Principles and Applications in Food Processing. In Thermal Food Engineering Operations; New York: John Wiley & Sons, 2022.
- Zeng, S.; Li, M.; Li, G.; Lv, W.; Liao, X.; Wang, L. Innovative Applications, Limitations and Prospects of Energy-Carrying Infrared Radiation, Microwave and Radio Frequency in Agricultural Products Processing. Trends Food Sci. Technol. 2022, 121, 76–92. DOI: 10.1016/j.tifs.2022.01.032.
- Aboud, S. A.; Altemimi, A. B.; RS Al-HiIphy, A.; Lee, Y.; Cacciola, F. A Comprehensive Review on Infrared Heating Applications in Food Processing. Molecules. 2019, 24(22), 4125. DOI: 10.3390/molecules24224125.
- Yadav, G.; Gupta, N. Infrared Heating and Its Application in Food Processing. Pharma. Innov. 2020, 9(2), 142–152.
- Dagerskog, M. Infrared Radiation for Food Processing I: A Study of the Fundamental Properties of Infrared Radiation. Food Sci. Technol. 1979, 12(4), 237–243.
- Lao, Y.; Zhang, M.; Chitrakar, B.; Bhandari, B.; Fan, D. Efficient Plant Foods Processing Based on Infrared Heating. Food Rev. Int. 2019, 35(7), 640–663. DOI: 10.1080/87559129.2019.1600537.
- Downing, H. D.; Williams, D. Optical Constants of Water in the Infrared. J. Geophysical Res. 1975, 80(12), 1656–1661. DOI: 10.1029/JC080i012p01656.
- Almeida, M.; Torrance, K. E.; Datta, A. K. Measurement of Optical Properties of Foods in Near- and Mid-Infrared Radiation. Int. J. Food Prop. 2006, 9(4), 651–664. DOI: 10.1080/10942910600853667.
- Pan, Z.;, and Atungulu, G. G.Infrared heating for food and agricultural processing. Boca Raton, FL: CRC Press, 2010.
- Erdogdu, S. B.; Eliasson, L.; Erdogdu, F.; Isaksson, S.; Ahrné, L. Experimental Determination of Penetration Depths of Various Spice Commodities (Black Pepper Seeds, Paprika Powder and Oregano Leaves) Under Infrared Radiation. J. Food Eng. 2015, 161, 75–81. DOI: 10.1016/j.jfoodeng.2015.03.036.
- Chizoba Ekezie, F. G.; Sun, D.; Han, Z.; Cheng, J. Microwave-Assisted Food Processing Technologies for Enhancing Product Quality and Process Efficiency: A Review of Recent Developments. Trends Food Sci. Technol. 2017, 67, 58–69. DOI: 10.1016/j.tifs.2017.05.014.
- Chhanwal, N.; Bhushette, P. R.; Anandharamakrishnan, C. Current Perspectives on Non-Conventional Heating Ovens for Baking Process—A Review. Food Bioprocess. Technol. 2018, 12(1), 1–15. DOI: 10.1007/s11947-018-2198-y.
- Cappelli, A.; Lupori, L.; Cini, E. Baking Technology: A Systematic Review of Machines and Plants and Their Effect on Final Products, Including Improvement Strategies. Trends Food Sci. Technol. 2021, 115, 275–284. DOI: 10.1016/j.tifs.2021.06.048.
- Lloyd, B. J.; Farkas, B. E.; Keener, K. M. Quality Comparison of French Fry Style Potatoes Produced by Oven Heating, Immersion Frying and Controlled Dynamic Radiant Heating. J. Food Process. Preserv. 2004, 28(6), 460–472. DOI: 10.1111/j.1745-4549.2004.23075.x.
- Ssemwanga, M.; Makule, E.; Kayondo, S. I. Performance Analysis of an Improved Solar Dryer Integrated with Multiple Metallic Solar Concentrators for Drying Fruits. Solar Energy. 2020, 204, 419–428. DOI: 10.1016/j.solener.2020.04.065.
- Mohana, Y.; Mohanapriya, R.; Anukiruthika, T.; Yoha, K. S.; Moses, J. A.; Anandharamakrishnan, C. Solar Dryers for Food Applications: Concepts, Designs, and Recent Advances. Solar Energy. 2020, 208, 321–344. DOI: 10.1016/j.solener.2020.07.098.
- Blutinger, J. D.; Meijers, Y.; Lipson, H. Selective Laser Broiling of Atlantic Salmon. Food Res. Int. 2019, 120, 196–208. DOI: 10.1016/j.foodres.2019.02.043.
- Blutinger, J. D.; Tsai, A.; Storvick, E.; Seymour, G.; Liu, E.; Samarelli, N.; Karthik, S.; Meijers, Y.; Lipson, H. Precision Cooking for Printed Foods via Multiwavelength Lasers. npj Sci. Food. 2021, 5(1). DOI: 10.1038/s41538-021-00107-1.
- Zhu, Q.; Zhang, F. Component Analysis of Proteins in Egg White. Sichuan J. Zool. 2004, 23(4), 3.
- Almeida, M.; Torrance, K.; Datta, A. Measurement of Optical Properties of Foods in Near-And Mid-Infrared Radiation. Int. J. Food Prop. 2006, 9(4), 651–664. DOI: 10.1080/10942910600853667.
- Feng, Y.; Kai, L.; Xiaoling, Z. Error Theory and Data Processing; Harbin Institute of Technology Press: Harbin, 2020.
- Bombrun, L.; Gatellier, P.; Portanguen, S.; Kondjoyan, A. Analysis of the Juice and Water Losses in Salted and Unsalted Pork Samples Heated in Water Bath. Consequences for the Prediction of Weight Loss by Transfer Models. Meat. Sci. 2015, 99, 113–122. DOI: 10.1016/j.meatsci.2014.07.033.
- Bergman, T. L.; Incropera, F. P.; Dewitt, D. P.; Lavine, A. S. Fundamentals of Heat and Mass Transfer; New York: John Wiley & Sons, 2011.
- Feng, Y. Research of Protein Denaturation Process by Dielectric Spectroscopy. YILI Normal University, YiLi, 2012.
- Chang, C. The Interface Adsorption, Aggregation and Application Properties of Egg White Protein, in College of Food Science; WuXi: Jiangnan University, 2018.
- Anema, S. G. The whey proteins in milk: Thermal denaturation, physical interactions, and effects on the functional properties of milk. Milk Proteins: From expression to food; Oxford, UK: Academic Press, 2020.
- Luo, X.; Wang, Q.; Wu, Y.; Duan, W.; Zhang, Y.; Geng, F.; Song, H.; Huang, Q.; An, F. Mechanism of Effect of Heating Temperature on Functional Characteristics of Thick Egg White. LWT - Food Sci. Technol. 2022, 154, 112807. DOI: 10.1016/j.lwt.2021.112807.
- Tornberg, E. Effects of Heat on Meat Proteins - Implications on Structure and Quality of Meat Products. Meat Sci. 2005, 70(3), 493–508. DOI: 10.1016/j.meatsci.2004.11.021.
- Matsuda, H.; Llave, Y.; Fukuoka, M.; Sakai, N. Color Changes in Fish During Grilling–Influences of Heat Transfer and Heating Medium on Browning Color. J. Food Eng. 2013, 116(1), 130–137. DOI: 10.1016/j.jfoodeng.2012.11.027.
- Keramat, J.; LeBail, A.; Prost, C.; Jafari, M. Acrylamide in Baking Products: A Review Article. Food Bioproc. Tech. 2011, 4(4), 530–543. DOI: 10.1007/s11947-010-0495-1.
- Sumnu, G.; Sahin, S.; Sevimli, M. Microwave, Infrared and Infrared-Microwave Combination Baking of Cakes. J. Food Eng. 2005, 71(2), 150–155. DOI: 10.1016/j.jfoodeng.2004.10.027.
- Leroy, A.; Bhatia, B.; Wilke, K.; Ilic, O.; Soljačić, M.; Wang, E. N. Combined Selective Emitter and Filter for High Performance Incandescent Lighting. Appl. Phys. Lett. 2017, 111(9), 094103. DOI: 10.1063/1.4989522.