
 ?Mathematical formulae have been encoded as MathML and are displayed in this HTML version using MathJax in order to improve their display. Uncheck the box to turn MathJax off. This feature requires Javascript. Click on a formula to zoom.
ABSTRACT
Orthosiphon stamineus Benth (O. stamineus) leaves are herb plant parts that can act as an antioxidant and α-glucosidase inhibitor. Finding the best O. stamineus extract that serves as an antioxidant and α-glucosidase inhibitory agent is an essential requirement. Additionally, a clustering analysis based on FTIR spectra should be performed using principal component analysis (PCA) and partial least squares (PLS). Based on this study, the 40% ethanolic extract of O. stamineus leaves is a potent extract as an antioxidant and α-glucosidase inhibitory agent. Whereas 20% ethanolic extract of O. stamineus leaves is only applied as an α-glucosidase agent. Furthermore, discrimination analysis of O. stamineus leaf extracts showed that FTIR-based analysis can discriminate nicely each water, 60%, 80%, and 100% ethanolic extracts. This study reported that the obtained model has the determination coefficient of R2X: 0.991, R2Y: 0.964, and Q2Y: 0.946, which showed a good model and a good prediction. However, the classification method did not distinguish clearly between 20% and 40% ethanolic extracts. 20% ethanolic extract of O. stamineus leaves is always paired with 40% ethanolic extract of O. stamineus. Furthermore, several functional groups from O. stamineus leaf extracts contribute toward both biological activities including alkane groups, carbonyl groups, methylene groups, ester groups, and alkyl di-substitutions. Based on this study, quality control of potent extract as an antioxidant and as an α-Glucosidase Inhibitor should be conducted using a specific marker-based analysis.
Introduction
Herbal plants are traditional medicines that are widely used to treat an extensive variety of diseases, particularly by civil society in developing nations. One of the Asian countries, China developed herbal medicines, known as traditional Chinese Medicines (TCM). According from Yu et al.[Citation1] said that TCM in China has been familiarized as long as more than 3000 years ago. Besides TCM from China, Japan developed herbal medicines known as Kampo and India familiarized Ayurveda.[Citation2,Citation3] Currently, more than 80% of people worldwide used and consumed herbal plants for keeping their bodies fit and healthy. However, they give many benefits to human health.
One of the herbal plants applied for treating several diseases is O. stamineus. It contains many active compounds, such as sinensetin, eupatorin, salvigenin, etc.[Citation4] They act as a significant function in the management of a variety of diseases, including antioxidants, anti-diabetes, anti-inflammation, and others.[Citation5,Citation6] The phenolic compounds found in 34 herb plants have been recognized as important compounds that promote human health.[Citation7] However, the biological activities are greatly influenced by containing active compounds in the herb.[Citation8] Therefore, some researchers look for the best extract or fractionated extract that can positively affect the human body. To fulfill this, the extraction processes, solvents chosen for the extraction process, and the manner of drying have to be investigated. Many factors will influence the quality of herbal extract. Furthermore, the cultivated plant offers significant effects on the contained active chemicals in the herb, which affects the end-product quality of herbal extract.
Therefore, the focus of this research was to identify an outstanding extract of O. stamineus as an antioxidant agent, because this property is required across many kinds of commercial products, such as pharmaceuticals, foods, and cosmetics. This study will assess total phenolic content (TPC), total flavonoid content (TFC), and antioxidant activity such as the scavenging activity of DPPH and ABTS radicals to evaluate extract quality. Based on the study from Sukweenadhi et al.,[Citation9] explained that phenolic and flavonoid compounds are constituents that are responsible for antioxidant activity. Therefore, TPC and TFC have a positive correlation toward their activity.
Furthermore, quality control of herb products can be determined using instrumental methods such as marker-based analysis (univariate techniques) and multivariate techniques. A previous study has identified successfully the mixtures of the leaf and root extract using chromatography-based techniques.[Citation10,Citation11] The use of a reliable analytical method is a useful strategy to control the quality of herbal medicine and avoid negative effects.[Citation12] Therefore, it is very prominent for the plant’s quality control because the forgery of raw material or extracts will be detected early using FTIR spectroscopy.
This study employed FTIR spectroscopy to identify and classify the ethanolic extract of O. stamineus leaves as quality control of the extract that will be used and chosen. The classification technique is used to ensure that the best extract can be selected and distinguished from others using FTIR spectroscopy combined with chemometrics. The combination of FTIR spectroscopy with chemometrics strongly classified the methanolic extract of O. stamineus leaves and its fraction.[Citation13] Despite this, previous investigations from Nipun et al.,[Citation14] successfully applied FTIR spectroscopy to predict the α-glucosidase inhibitory activity of P. Malayana. The choice of this analytical method is based on the benefits gained because it is a simple and rapid analysis, nondestructive, short time consumed, and is easy to prepare. At present, the use of FTIR spectroscopy to classify the potent O. stamineus as antioxidants and α-Glucosidase inhibitors has not been mentioned. As a result, we conduct this investigation as a recommended part of the quality control of the collected O. stamineus extracts that will be selected.
Material and methods
Samples preparation
O. stamineus leaves were collected from Kaliurang Street km 21.5, Sidorejo, Hargobinangun, Pakem, Sleman, Yogyakarta, Indonesia. This plant was identified by the Department of Biology, Universitas Ahmad Dahlan. Leaf samples were washed using water and dried in Oven at 45°C for 4 days. Finally, the sample powder was created by grinding into a size of 60 mesh.[Citation15]
Extraction procedure
The powder of O. stamineus leaves was extracted by following an extraction method from Li et al.,[Citation16] with slight modification. The powder was dissolved using various ethanol concentrations (0–100%) with a solid-to-solvent ratio is 1:10 (w/v). Then, the solution was sonicated at 30°C for 60 min and placed overnight. To gain the dried filtrate, the solution was filtered, evaporated, and the last step is dried using freeze-drying. Several parameters, including yields, TPC, TFC, inhibition activity of DPPH, ABTS, and α-glucosidase, were determined on all dried extracts.
Phenolic total content (TPC)
The determination of TPC in the extract of O. stamineus leaves following the study reported by Ahda et al.,[Citation17]) with slight modification. To determine the TPC, 10 mg extract of O. stamineus leaves was reacted with 1.5 mL Folin Ciocalteu (1:10 in water) and mixed for 3 min. After that, it was mixed with 1.2 mL of 7.5% sodium carbonate (b/v) and awaited for 60 min. The TPC was measured by a UV-Vis spectrophotometer at a maximum lambda of 743 nm. The standard solution used is a gallic acid solution in ranging concentrations of 30–80 µg/mL. The TPC was expressed in µg/mg equivalent of gallic acid.
Total flavonoid content (TFC)
TFC was measured using the aluminum chloride colorimetric technique, as previously reported by Chandra et al.,[Citation18] with slight modifications. 25 mg ethanolic extracts of O. stamineus leaves were dissolved in 25 mL ethanol. 1 mL of the solution was reacted with 0.5 mL AlCl3 10% and incubated for 74 min at room temperature. The Absorbance was read at 410 nm using a spectrophotometer Uv-Vis 1800 Shimadzu. The quercetin standard was performed with similar work ranging from 5 to 20 μg/mL. The TFC was expressed as µg quercetin equivalent (QE)/mg of dried extract. All the determinations were carried out in six replicates.
Inhibition activity of DPPH (2,2-diphenyl-1-picrylhydrazyl) radicals
The determination of the antioxidant activity of DPPH was illustrated by Ahda et al.,[Citation17] with slight modification. The extract of O. stamineus leaves was dissolved using various ethanol concentrations (ranges of 0–500 µg/mL). 1 mL extract solution was added with 1 mL of 0.05 mM DPPH solution and mixed for 1 min and then kept for 1 h. Finally, the solution was read the absorbance by a UV-Vis spectrophotometer at 516 nm, and then determine the inhibition concentration 50 (IC50) using the following equation:
where A0 is the absorbance of control; A1 is the absorbance of the samples
Inhibition activity of ABTS (2,2’-azino-bis(3-ethylbenzothiazoline-6-sulfonic acid) radicals
The effects of this extract on ABTS radicals were studied using a slightly modified approach previously described by Byun et al..[Citation19] After mixing 7.4 mM ABTS and 2.45 mM potassium persulfate solution in a 1:1 (v/v) ratio, the reagent was incubated for 24 h at 37°C to create radicals. The ABTS technique was utilized when the absorbance of the working solution was 0.70 ± 0.02 at 734 nm. In brief, 1 mL of ABTS solution was mixed with 1 mL of extract for 74 min. Quercetin was used as a control, and all investigations were repeated three times. The radical scavenging activity of ABTS was determined using the following equation:
Where A0 is the absorbance of control; A1 is the absorbance of the samples
Inhibition activity of α-glucosidase
The evaluation of the inhibition activity of O. stamineus leaf extract against α-glucosidase was performed using a concentration assay at 25 µg/mL. The procedure follows previous work from Chelladurai and Chinnachamy[Citation20] with slight modification. The O. stamineus leaf extracts as much as 200 µL were mixed with 200 µL α-glucosidase solution (15 U/100 mL in sodium phosphate buffer, pH 6.8) for 15 min. Hereinafter, the solution was mixed with 200 µL 5 mM p-nitrophenylα-glucopyranoside (pNPG) for 20 min. Lastly, 1000 µL 0.2 M Na2CO3 was added and homogenized by vortex to stop the reaction occurred. The inhibition activity was analyzed using a spectrophotometer Uv-Vis 1800 Shimadzu at 400 nm and determined by the equation:
where: As is absorbance of sample, Ab is absorbance of Blank, and Ac is absorbance of control. The control solution is solvent (DMSO), enzyme, and substrate (pNPG), the blank solution is the mixtures without enzyme, and the sample solution is the extracts or quercetin, enzyme, and substrate.
Analysis of functional groups of O. stamineus leaf extract using FTIR spectroscopy
Identification of functional groups of O. stamineus was conducted using an attenuated total reflectance-Fourier Transform Infrared (ATR-FTIR) spectrometer (Thermo Nicolet Corp, Madison, Wi). The instrument was set at wavenumber regions of 400–4000 cm−1 and a resolution of 8 cm−1 with number of scanning of 32. The obtained data were then treated using multivariate data analysis (MDA).
Data analysis
Data obtained are written by mean ± standard deviation (SD). The Analysis of One-way variance (ANOVA) at a confidence interval up to 95% and a significant value of p < .05. The MDA of FTIR spectrum using partial component analysis (PCA) and partial least square (PLS) for discriminant analysis and quantification, respectively.
Results and discussion
Yields of O. satmineus ethanolic extracts
The extraction technique is an integral part of taking out active compounds from herb plants. Many factors influenced the extracted active compounds from them. Setford et al.,[Citation21] reported that some parameters that affect the extraction process of the herb, such as solvent composition, contact area, temperature, time contact, and solute molecular structure, which play in the diffusion mechanism. Even, active compounds particularly phenolic compounds are significantly affected by solvent concentrations, extraction method used, temperature, and purification method.[Citation22]
shows that the increase in polarity solvent caused the resulting yields to increase. The trend order of the resulted yields (%) is 100% ethanol < 80% ethanol < 60% ethanol < 40% ethanol > 20% ethanol >water. Based on yields, this investigation concluded that 40% ethanol may take out efficient chemical compounds. According to a prior study by Abdul Razak et al.,[Citation23] the highest extraction yields are H2O, ethyl acetate, ethanol, and hexane, with percentage yields of 33.69 wt%, 6.05%, 4.42%, and 3.08%, respectively. This occurs due to an effect of the herb’s phenolic components. Therefore, the polarity of the solvent will have an effect on the yields collected. For industrial processes, it is very important due to its economic value causing the profit will increase.
Table 1. Yield (%) of the extraction of O. stamineus leaves.
Total phenolic content (TPC) and total flavonoid content (TFC) of O. stamineus leaf extracts
In most cases, TPC and TFC are both general parameters that denote medicinal herb ability as an alternative drug candidate in disease treatment including antidiabetes and antioxidants. Bingol et al.,[Citation24] declared that phenolic content was proportional to its biological activity. Therefore, the determination of TPC and TFC is an important part of the preliminary study to conclude whether the herb is potent or not. Somewhile, TPC and TFC present a good correlation with their biological activity.[Citation7,Citation8] . Illustrated TPC and TFC in the ethanolic extract of O. stamineus leaves.
Table 2. TPC and TFC of O. stamineus Leaf Extracts.
Based on , it shows that the water extract of O. stamineus leaves has the highest TPC and the 100% ethanol extract is the lowest. The orders of TPC are water extract > 20% ethanolic extract > 40% ethanolic extract > 60% ethanolic extract > 80% ethanolic extract > 100% ethanolic extract. However, the order of TFC in this herb is not equal compared with TPC. Even though the highest TFC is 100% ethanolic extract and the lowest is the water extract of O. stamineus leaves. The increase of polarity solvent (100% ethanol to water) will decrease TFC but not TPC. This is because the flavonoids found in O. stamineus are methoxy flavonoids, which are classified as non-phenolic compounds. The difference in the order of TPC and TFC showed that active compounds in the extracts are different. Besides, the basic reaction of the determination of phenolic compounds and total flavonoid levels is different.
The determination of TPC is related to chemical compounds that reduce easily a molybdenum reagent. These active compounds are mostly containing hydroxyl groups including flavonoids and their derivatives, glucose, rosmarinic acid, etc. Phong et al.[Citation25] explained that the higher phenolic content of the herb is not only flavonoids present but other compounds, such as triterpenoids, alkaloids, tannins, coumarins, saponins, and reducing sugars will lead TPC to increase. In addition, TFC was detected based on a complex reaction between aluminum(III) and flavonoid types. The reaction will occur with aluminum(III): flavonoids ratio is 1:2.[Citation26] Thus, TPC and TFC may not always correlate positively due to their dependence on the chemical compounds contained in the herb extract. Previous research from Wang et al.[Citation27] reported that any more than 62 active compounds in O. stamineus were grouped into 35 volatile oils, 21 terpenoids, 12 flavonoids, and phenolic groups. However, the ethanolic extract of O. stamineus contains a lower rosmarinic acid-to-sinensetin ratio than the water extract.[Citation23] Therefore, the increase of polarity solvent will take up more phenolic compounds than flavonoid derivates such as sinensetin, eupatorin, and 3’-hydroxy-5,6,7,4’-tetramethoxyflavone (TMF).
Inhibition activity of DPPH, ABTS+ radicals, and α-glucosidase
Based on , the highest TPC and TFC are water extract and ethanolic extracts of O. stamineus leaves, respectively. However, the water extract, 80% ethanolic extract, and 100% ethanolic extract of O. stamineus leaves have a weak inhibition activity of DPPH and ABTS+ radicals due to they have low inhibition activity (%) compared with others (). Besides, 80% and 100% ethanolic extract of O. stamineus leaves at 25 µg/mL has the lowest α-glucosidase inhibition, while water extract of O. stamineus has weak inhibition activity of α-glucosidase (inhibition activity: 27.473 ± 0.126 µg/mL). It has been supported by Bassalat et al.[Citation28] reported that water extract of O. stamineus at 100 µg/mL inhibited DPPH radicals of 53.3 ± 4.8%. Based on this result, several O. stamineus leaf extracts including water extract, 80% ethanolic extract, and 100% ethanolic extract of O. stamineus leaves are not good for antioxidants and α-glucosidase inhibitors. shows that 40% ethanolic extract and 20% ethanolic extract of O. stamineus have had the best inhibition activity of ABTS, DPPH radicals, and α-glucosidase which have inhibition activity of 53.665 ± 0.508%, 48.299 ± 1.749%, 42.757 ± 1.050%, respectively.
Table 3. Inhibition Activity of DPPH and ABTS Radicals and α-glucosidase from several ethanolic extracts of O. stamineus leaves.
Based on , the best extracts of O. stamineus as antioxidants and α-glucosidase inhibitory agents are not the same extract. Therefore, the use of O. stamineus leaf extract is adapted by its applications. In the case of antioxidant application, 40% ethanolic extract from O. stamineus leaves is the best choice. While 20% ethanolic extract of O. stamineus is a potent extract as an α-glucosidase inhibitory agent. Kamarudin et al.,[Citation29] explained that 50% ethanol of O. stamineus is the highest DPPH inhibitory activity compared with 100% ethanol and water extract of O. stamineus. In fact, it contains several active compounds such as sinensetin, salvigenin, tetramethylscutellarein, 3,7,4’-tri-O-methylkaempferol, and orthosiphol A.[Citation30] To keep the consistency of the best extracts, we should decide on the extract use via controlling the quality of the obtained extract.
Fingerprinting FTIR-based analysis of ethanolic extract of O. stamineus
The screening of functional groups of O. stamineus using FTIR spectroscopy was intended to find the different functional group vibrations of the obtained extract. shows that 100% ethanolic extract of O. stamineus has a different FTIR spectrum compared with others. 100% ethanolic extract of O. stamineus has specific spectrum characteristics at wavenumbers 3010–3110 cm-1, 1700–1750 cm-1 as alkene groups and carbonyl groups, respectively (). In addition, this extract contains methyl groups from methoxy flavonoids as the major alkane groups (specific vibration at 2900–3000 cm−1 and 1455 cm−1). Some methoxy flavonoids including sinensetin and TMF have been reported by previous studies. Furthermore, all extracts contain alkenes’ aromatics as benzene groups at 1590 cm−1. The fact that the water extract of O. stamineus leaves has the highest intensity of aromatic regions of alkenes indicates that it includes a lot of phenolic groups that are supported by TPC. Several phenolic groups have been reported from this plant including rosmarinic acid and caffeic acid.[Citation31,Citation32] It correlated with biological activities where the highest TFC is 100% ethanolic extract of O. stamineus leaves and the highest TFC is a water extract.
Figure 1. Vibration of functional group types of several extracts of O. stamineus Leaves.
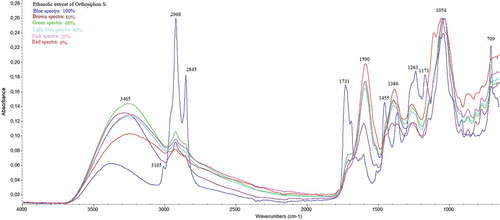
Table 4. The vibrational of functional group types from active compounds in the several ethanolic extracts of O. stamineus.
To control the extract quality of O. stamineus leaves used, the discriminant analysis should be performed, especially both 20% and 40% ethanolic extract of O. stamineus due to both 40% and 20% ethanolic extracts are the highest antioxidant activities and α-glucosidase inhibition, respectively (). Therefore, the classification of these extracts is very helpful to control consistently the extract quality. In this study, FTIR spectroscopy was chosen as an analytical method for evaluating herbal medicine because it is a fingerprinting technique and a rapid method. In addition, Aziz et al.,[Citation33] have discriminated successfully Yakon leaf extracted by various solvent concentrations (water, 50% ethanol, and 95% ethanol) using FTIR spectroscopy in combination with chemometrics.
The use of FTIR spectroscopy using partial least square (PLS) has the determination coefficient R2X: 0.991, R2Y: 0.964, and Q2Y: 0.946. These results are a good model and a good prediction with R2X, R2Y, and Q2Y values from 0 to 1.0, 0 to 1.0, and 0.5 to 0.9, respectively.[Citation34] The model has a strong predictive ability if Q2Y >0.9 and accuracy if R2Y > 0.9.[Citation35] According to Easmin et al.,[Citation36] said that both R2Y and Q2Y parameters should be higher than 0.5 for accepting the obtained model.
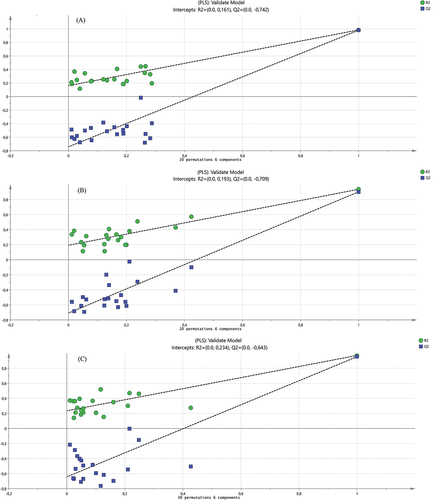
Furthermore, the validation models of the partial least square (PLS) of DPPH, ABTS, and α-glucosidase inhibitors produce R2 are 0.193, 0.234, and 0.193, respectively. While the Q2Y value of these biological activities is below 0.3 (). The permutation test score has acceptable criteria of the R2Y and Q2Y are lower than 0.3 and 0.05, respectively,[Citation34] or R2Y <0.3–0.4 and Q2Y <0.05.[Citation37] Based on this result, the developed models are good models for predicting DPPH radicals inhibitors and α-glucosidase inhibitors.
Figure 2. The validated Partial least square model used for the prediction of functional groups of O. stamineus leaf extracts is responsible for its biological activities. (A) Validated models for α-glucosidase inhibitors; (B) Validated model for DPPH radicals scavenging; (C) Validated model for ABTS radicals scavenging.
FTIR spectroscopy in combination with principal component analysis (PCA) has successfully grouped herbal products (Jamu) and contaminated herbal products with synthetic drugs including prednisone, metamizole, and diclofenac sodium.[Citation38] Nipun et al.,[Citation14] who has also classified successfully Psychotria malayana Jack extracted using various methanol concentrations using FTIR combined with chemometrics. The result of this study showed that the discriminant analysis based on the infrared spectrum has separated each extract of O. stamineus, except for water extracts, 20%, and 40% ethanolic extract of O. stamineus leaves (). demonstrates how the discriminant analysis successfully clustered data with a total variance of 89.8%.
Figure 3. Principal Component Analysis of Ethanolic Extract of O. stamineus Leaves: (0) water, (20) 20% ethanol, (40) 40% ethanol, (60) 60% ethanol; (80) 80% ethanol, and (100) 100% ethanol. (a) Score plot; (b) loading plot. Inhibition activity of α-glucosidase (a); DPPH radicals (b); and ABTS radicals (c).
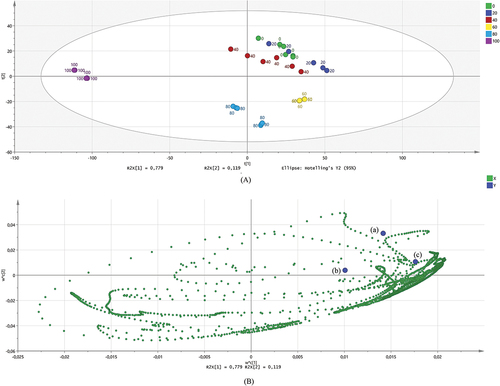
Based on this study, we showed that 20% and 40% ethanolic extract of O. stamineus leaves are nearest to both biological activities. As an outcome, both extracts of O. stamineus leaves are potent extracts to inhibit α-glucosidase and DPPH radicals. The functional groups from O. stamineus extract as elaborated in . Several functional groups from O. stamineus leaf extracts contribute toward both biological activities including alkane groups, carbonyl groups, methylene groups, ester groups, and alkyl di-substitutions. A previous study from Juliani et al.,[Citation13] reported that carbonyl, methoxy, hydroxyl, and ester groups have positively correlated with α-glucosidase inhibition. Therefore, this study has a different result where hydroxyl groups do not affect significantly both biological activities.
Figure 4. Loading of functional groups from O. stamineus extracts is responsible for the Inhibition of ABTS radicals, DPPH radicals, and α-glucosidase.
It was clearly explained from an in-vitro evaluation that phenolic compounds (TPC) are not correlated with both activities (). In general, hydroxyl groups might influence this activity; however, this is very affected by the contained active compounds from this herb. A previous study reported that water extract of O. stamineus contains caffeic acid, chlorogenic acid, 4-amino butanoic acid, and quercetin, while methanolic extract extracted active compounds such as palmitic acid, phytol, alpha-linolenic acid, stearic acid, 1,3-dihydroxyanthraquinone, and stigmasterol[Citation28] and sinensetin as methyl flavonoid groups present.[Citation23] In addition, the use of infrared fingerprinting can be applied as a quality control technique for the 100% ethanolic extract, 80% ethanolic extract, and 60% ethanolic extract of O. stamineus leaves, but not for 40% ethanolic extract, 20% ethanolic extract, and water extract of this herb. Therefore, the development of an analytical method using marker-based analysis should be conducted so that the quality control of O. stamineus extract as an α-glucosidase agent can be undertaken.
Multivariate analysis of FTIR spectra of ethanolic extract of O. stamineus
The choice of wavenumbers of FTIR spectra in combination with Partial least square (PLS) for quantitative analysis affects significantly the acceptable result. Therefore, the optimization of the calibration curve may be conducted to ensure whether the obtained regression model is an achieved method or not. Fatmarahmi et al.,[Citation38] explained that the accuracy and precision of the regression model can be seen by the low value of root mean square error of cross-validation (RMSECV) and root mean square error of calibration (RMSEC) and the highest of determination coefficient resulted (R2 is nearest to 1).
The prediction value and the actual value produce the high value of the determination coefficient (R2) which are 0.9701, 0.9366, and 0.9842 for ABTS radicals scavenging, DPPH radicals scavenging, and α-glucosidase inhibitors, respectively. The regression models contain equations are Y: actual + 6.20 10−7, Y: actual + 1.026 10−6, and Y: actual + 1.43 10−6 for ABTS radical scavenging, DPPH radicals scavenging, and α-glucosidase inhibitors, respectively (). The error of these models is lower than 3 hence we can conclude that both models also have good detection.
Figure 5. Quantitative analysis of O. stamineus extracts based on predicted value and actual value: (a) α-glucosidase inhibitors; (b) DPPH radicals scavenging; (c) ABTS radicals scavenging.
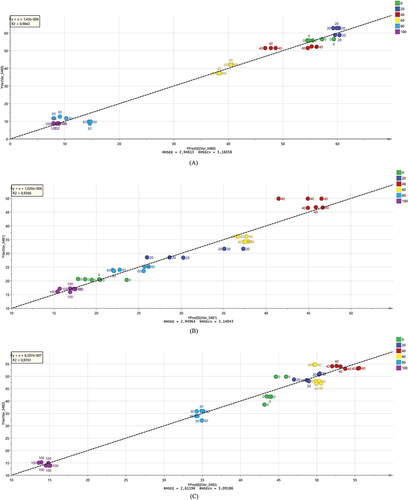
These regression models were used to predict the inhibition of ABTS radicals, DPPH radicals, and α-glucosidase by O. stamineus leaf extract. This study revealed that FTIR spectroscopy and chemometrics can predict the biological activity of this herb. However, the performance of the FTIR spectroscopy design and experimental work should be redundant more regularly. It is critical for ensuring the statistical analysis of the data that was obtained (see ). Although the biological activity trends are comparable, hence FTIR spectra can be used in quality control and screening approaches for this plant. However, to ensure the biological activities of the herb products, laboratorium work with more replication should be undertaken.
Table 5. Comparison of the inhibition activity of O. stamineus leaf extract against ABTS radicals, DPPH radicals, and α–glucosidase.
Conclusion
This study reported that the 40% ethanolic extract of O. stamineus is the best extract as an antioxidant agent and an α-glucosidase inhibitory agent. It is supported by the highest level of TPC and TFC. While 20% ethanolic extract of O. stamineus is an extract potential as an α-glucosidase inhibitory agent. The problem is that 20% and 40% ethanolic extracts of O. stamineus contain similar functional groups where both extracts are closed together. Therefore, the use of FTIR spectroscopy for detecting good extract of O. stamineus as an α-glucosidase inhibitory agent is very difficult. We recommended detecting a specific marker that plays a significant role against the α-glucosidase inhibitory activity. However, we can classify and separate significantly 100% ethanolic extract, 80% ethanolic extract, and 60% ethanolic extract of O. stamineus based on the FTIR spectrum. Therefore, our finding offers support for the use of FTIR spectroscopy for quality control of O. stamineus ethanolic extracts, particularly for screening analysis.
Author contributions
MA: conceptualization, Data processing, writing-original draft preparation, editing, and revising the manuscript; IJ: supervision; AK: supervision; QUA: supervision; NUR: supervision and revising the manuscript, AR: supervision Data processing, and revising the manuscript, YDA: supervision. All authors approved the final version of the manuscript.
Acknowledgments
The authors are grateful and thankful to LPPM Universitas Ahmad Dahlan regarding this foundation with contract number: PD-144/SP3/LPPM-UAD/VII/2022, The Ministry of Education, Culture, Research, and Technology for a research grant with contract number: 071/E5/PG.0200PT/2022, and International Islamic University of Malaya for the supporting funding with number RMCG20-042-0042.
Disclosure statement
No potential conflict of interest was reported by the authors.
References
- Yu, F.; Takahashi, T.; Moriya, J.; Kawaura, K.; Yamakawa, J.; Kusaka, K.; Itoh, T.; Morimoto, S.; Yamaguchi, M.; Kanda, T. Traditional Chinese Medicine and Kampo: A Review from the Distant Past for the Future. J. Int. Med. Res. 2006, 34(3), 231–239. DOI: 10.1177/147323000603400301.
- Motoo, Y.; Seki, T.; Tsutani, K. Traditional Japanese Medicine, Kampo: Its History and Current Status. Chin. J. Integr. Med. 2011, 17(2), 85–87. DOI: 10.1007/s11655-011-0653-y.
- Lele, R. D. History of Medicine in India, National Centre of Indian Medical Heritage Central Council for Research in Ayurvedic Sciences (CCRAS); Ministry of AYUSH, Government of India: New dehli, India, 2021.
- Hossain, M. A.; Mizanur Rahman, S. M. Isolation and Characterisation of Flavonoids from the Leaves of Medicinal Plant Orthosiphon Stamineus. Arabian J. Chem. 2015, 8(2), 218–221. DOI: 10.1016/j.arabjc.2011.06.016.
- Ashraf, K.; Sultan, S.; Adam, A. Orthosiphon Stamineus Benth. is an Outstanding Food Medicine: Review of Phytochemical and Pharmacological Activities. J. Pharm. Bioallied Sci. 2018, 10(3), 109–118. DOI: 10.4103/jpbs.JPBS_253_17 (Accessed Jul-Sep 2018).
- Retinasamy, T.; Shaikh, M. F.; Kumari, Y.; Zainal Abidin, S. A.; Othman, I. Orthosiphon Stamineus Standardized Extract Reverses Streptozotocin-Induced Alzheimer’s Disease-Like Condition in a Rat Model. Biomed. 2020, 8(5), 104. DOI: 10.3390/biomedicines8050104.
- Hemmami, H.; Seghir, B. B.; Zeghoud, S.; Ben Amor, I.; Kouadri, I.; Rebiai, A.; Zaater, A.; Messaoudi, M.; Benchikha, N.; Sawicka, B., et al. Desert Endemic Plants in Algeria: A Review on Traditional Uses, Phytochemistry, Polyphenolic Compounds, and Pharmacological Activities. Molecules. 2023, 28(4), 1834. DOI: 10.3390/molecules28041834.
- Khalil, N.; El-Jalel, L.; Yousif, M.; Gonaid, M. Altitude Impact on the Chemical Profile and Biological Activities of Satureja Thymbra L. Essential Oil. BMC Complement. Med. Ther. 2020, 20, 186. DOI: 10.1186/s12906-020-02982-9.
- Sukweenadhi, J.; Yunita, O.; Setiawan, F.; Kartini, S.; Danduru, M. T.; Avanti, A. P.; Avanti, C. Antioxidant Activity Screening of Seven Indonesian Herbal Extract. Biodiversitas. 2020, 21(5), 2062–2067. DOI: 10.13057/biodiv/d210532.
- Wang, C. Z.; Ni, M.; Sun, S.; Li, X. L.; He, H.; Mehendale, S. R.; Yuan, C.-S. Detection of Adulteration of Notoginseng Root Extract with Other Panax Species by Quantitative HPLC Coupled with PCA. J. Agric. Food Chem. 2009, 57(6), 2363–2367. DOI: 10.1021/jf803320d.
- Bampali, E.; Germer, S.; Bauer, R.; Kulić, Z. HPLC-UV/HRMS Methods for the Unambiguous Detection of Adulterations of Ginkgo Biloba Leaves with Sophora Japonica Fruits on an Extract Level. Pharm. Biol. 2021, 59(1), 438–443. DOI: 10.1080/13880209.2021.1910717.
- Pratiwi, R.; Dipadharma, R. H. F.; Prayugo, I. J.; Layandro, O. A. Recent Analytical Method for Detection of Chemical Adulterants in Herbal Medicine. Molecul. 2021, 26(21), 6606. DOI: 10.3390/molecules26216606.
- Juliani, Y.; Budijanto, N. D.; Wijaya, C. H.; Khatib, A. α-Glucosidase Inhibitors and Antioxidant Compounds from Orthosiphon Stamineus Benth Using FTIR Based Metabolomic. J. Teknologi dan Industr. Panagan. 2016, 27(1).
- Nipun, T. S.; Khatib, A.; Ahmed, Q. U.; Redzwan, I. E.; Ibrahim, Z.; Khan, A. Y. F.; Primaharinastiti, R.; Khalifa, S. A. M.; El-Seedi, H. R. Alpha-Glucosidase Inhibitory Effect of Psychotria Malayana Jack Leaf: A Rapid Analysis Using Infrared Fingerprinting. Molecul. 2020, 25(18), 4161. DOI: 10.3390/molecules25184161.
- Sulaiman, N.; Idayu, M. I.; Ramlan, A. Z.; Fasha, M. N.; Farahiyah, A. N. N.; Mailina, J.; Azah, M. A. N. Effect of Extraction Methods on Yields, Chemical Compounds of Gaharu (Aquilaria malaccensis). J. Trop. Forest Sci. 2015, 27(3), 413–419.
- Li, X.; Zhu, F.; Zeng, Z. Effects of Different Extraction Methods on Antioxidant Properties of Blueberry Anthocyanins. Open Chem. 2020, 19(1), 138–148. DOI: 10.1515/chem-2020-0052.
- Ahda, M.; Lestari, W.; Rahayu, T. Total Phenol Content and Antioxidant Activity of Various Concentration of Ethanol Extract of Psidium Guajava L. Int. J. Pharm.Res. 2019, 11(3), 1077–1082. DOI: 10.31838/ijpr/2019.11.03.078.
- Chandra, S.; Khan, S.; Avula, B.; Lata, H.; Yang, M. H.; ElSohly, M. A.; Khan, I. A. Assessment of Total Phenolic and Flavonoid Content, Antioxidant Properties, and Yield of Aeroponically and Conventionally Grown Leafy Vegetables and Fruit Crops: A Comparative Study. Evid. Based Complement. Altern. Med. 2014, 1–9. DOI: 10.1155/2014/253875.
- Byun, N. Y.; Heo, M. R.; Yim, S. H. Correlation of Anti-Wrinkling and Free Radical Antioxidant Activities of Areca Nut with Phenolic and Flavonoid Contents. Food Sci. Technol. 2021, 41(4), 1041–1049. DOI: 10.1590/fst.35520.
- Chelladurai, G. R. M.; Chinnachamy, C. Alpha Amylase and Alpha Glucosidase Inhibitory Effects of Aqueous Stem Extract of Salacia Oblonga and Its GC-MS Analysis. Braz. J. Pharm. Sci. 2018, 54(1), 1–10. DOI: 10.1590/s2175-97902018000117151.
- Setford, P. C.; Jeffery, D. W.; Grbin, P. R.; Muhlack, R. A. Factors Affecting Extraction and Evolution of Phenolic Compounds During Red Wine Maceration and the Role of Process Modelling. Trends Food Sci. Technol. 2017, 69, 106–117. DOI: 10.1016/j.tifs.2017.09.005.
- Mariya John, K. M.; Vijayan, D.; Raj Kumar, R.; Premkumar, R. Factors Influencing the Efficiency of Extraction of Polyphenols from Young Tea Leaves. Asian J. Plant Sci. 2006, 5(1), 123–126. DOI: 10.3923/ajps.2006.123.126.
- Abdul Razak, M. F. B.; Yong, P. K.; Shah, M. D.; Abdullah, L. C.; Yee, S. S.; Yaw, T. C. S. The Effect of Varying Solvent Polarity on Extraction Yields of Orthosiphon Stamineus Leaves. J. Appl. Sci. 2012, 12(11), 1207–1210. DOI: 10.3923/jas.2012.1207.1210.
- Bingol, Z.; Kızıltaş, H.; Gören, A. C.; Kose, L. P.; Topal, M.; Durmaz, L.; Alwasel, S. H.; Gulcin, İ. Antidiabetic, Anticholinergic and Antioxidant Activities of Aerial Parts of Shaggy Bindweed (Convulvulus Betonicifolia Miller Subsp.) – Profiling of Phenolic Compounds by LC-HRMS. Heliyon. 2021, 7(5), e06986. DOI: 10.1016/j.heliyon.2021.e06986.
- Phong, H. X.; Viet, N. T.; Quyen, N. T. N.; Thinh, P. V.; Trung, N. M.; Ngan, T. T. K. Phytochemical Screening, Total Phenolic, Flavonoid Contents, and Antioxidant Activities of Four Spices Commonly Used in Vietnamese Traditional Medicine. Mater. Today Proc. 2021, 56, 1–5. DOI: 10.1016/j.matpr.2021.12.142.
- Zhang, J.; Wang, J.; Brodbelt, J. S. Characterization of Flavonoids by Aluminum Complexation and Collisionally Activated Dissociation. J. Mass. Spectrom. Mar, 2005, 40(3), 350–363. PMID: 15674859. DOI: 10.1002/jms.793.
- Wang, X.; Zhao, W.; Zhang, X.; Wang, Z.; Han, C.; Xu, J.; Yang, G.; Peng, J.; Li, Z. The Prediction of Active Ingredients and Polypharmacological Mechanisms of Orthosiphon Stamineus Benth. (Lamiaceae) of Dai Medicine Based on Network Pharmacology. bioRxiv. 2021, 1–24. DOI: 10.1101/2021.06.12.448214.
- Bassalat, N.; Kadan, S.; Melamed, S.; Yaron, T.; Tietel, Z.; Karam, D.; Kmail, A.; Masalha, M.; Zaid, H. In vivo and in vitro Antidiabetic Efficacy of Aqueous and Methanolic Extracts of Orthosiphon Stamineus Benth. Pharmaceut. 2023, 15(3), 945. DOI: 10.3390/pharmaceutics15030945.
- Kamarudin, N. A.; Markom, M.; Latip, J. Effects of Solvents and Extraction Methods on Herbal Plants Phyllanthus Niruri, Orthosiphon Stamineus and Labisia Pumila. Indian J. Sci. Technol. 2016, 9(21). DOI: 10.17485/ijst/2016/v9i21/95235.
- Damsud, T.; Grace, M. H.; Adisakwattana, S.; Phuwapraisirisan, P. Orthosiphol a from the Aerial Parts of Orthosiphon Aristatus is Putatively Responsible for Hypoglycemic Effect via α-Glucosidase Inhibition. Nat. prod. communicat. 2014, 9(5), 1934578X1400900. DOI: 10.1177/1934578x1400900512.
- Saidan, N. H.; Hamil, M. S. R.; Memon, A. H.; Abdelbari, M. M.; Hamdan, M. R.; Mohd, K. S.; Abdul Majid, A. M. S.; Ismail, Z. Selected Metabolites Profiling of Orthosiphon Stamineus Benth Leaves Extracts Combined with Chemometrics Analysis and Correlation with Biological Activities. BMC Complementary Altern. Med. 2015, 15(1). DOI: 10.1186/s12906-015-0884-0.
- Islam, A. K. M. S.; Ahmad, M. N.; Mee Sim, M. Y.; Ismail, Z.; Noor, A. M. Quantification of Bioactive Caffeic Acid in Orthosiphon Stamineus Benth Using a Disposable Taste Sensor. Int. J. Electrochem. Sci. 2016, 11(1), 322–332. DOI: 10.1016/S1452-3981(23)15846-9.
- Aziz, Z.; Yuliana, N. D.; Simanjuntak, P.; Rafi, M.; Syamsudin, S. FTIR and HPLC-Based Metabolomics of Yacon Leaves Extracts (Smallanthus Sonchifolius [Poepp & Endl.] H. Robinson) from Two Locations in Indonesia. Indones. J. Chem. 2020, 20(3), 567–578. DOI: 10.22146/ijc.43453.
- Tew, W. Y.; Ying, C.; Wujun, Z.; Baocai, L.; Yoon, T. L.; Yam, M. F.; Jingying, C. Application of FT-IR Spectroscopy and Chemometric Technique for the Identification of Three Different Parts of Camellia Nitidissima and Discrimination of Its Authenticated Product. Front. Pharmacol. 2022, 13, 931203. DOI: 10.3389/fphar.2022.931203.
- Huang, B.; Chen, T.; Xiao, S.; Zha, Q.; Luo, P.; Wang, Y.; Cui, X.; Liu, L.; Zhou, H. A New Approach for Authentication of Four Ginseng Herbs and Their Related Products Based on the Simultaneous Quantification of 19 Ginseng Saponins by UHPLC-TOF/MS Coupled with OPLS-DA. R.S.C. Adv. 2017, 7(74), 46839–46851. DOI: 10.1039/c7ra06812c.
- Easmin, S.; Sarker, M. Z. I.; Ghafoor, K.; Ferdosh, S.; Jaffri, J.; Ali, M. E.; Mirhosseini, H.; Al-Juhaimi, F. Y.; Perumal, V.; Khatib, A. Rapid Investigation of α-Glucosidase Inhibitory Activity of Phaleria Macrocarpa Extracts Using FTIR-ATR Based Fingerprinting. J. Food Drug. Anal. 2017, 25(2), 306–315. DOI: 10.1016/j.jfda.2016.09.007.
- Tsanaktsidou, E.; Karavasili, C.; Zacharis, C. K.; Fatouros, D. G.; Markopoulou, C. K. Partial Least Square Model (PLS) as a Tool to Predict the Diffusion of Steroids Across Artificial Membranes. Molecul. 2020, 25(6), 1387. DOI: 10.3390/molecules25061387.
- Fatmarahmi, D. C.; Susidarti, R. A.; Swasono, R. T.; Rohman, A. A Development Method of FTIR Spectroscopy Coupled with Chemometrics for Detection of Synthetic Drug Adulterants of Herbal Products in Quaternary Mixture. J. Appl. Pharm. Sci. 2022, 12(3), 191–201. DOI: 10.7324/JAPS.2022.120320.