
 ?Mathematical formulae have been encoded as MathML and are displayed in this HTML version using MathJax in order to improve their display. Uncheck the box to turn MathJax off. This feature requires Javascript. Click on a formula to zoom.
ABSTRACT
Leafy vegetables are very healthy for human beings having high contents of phyto- and physico-chemicals and are low in fat and calories. Mountainous regions worldwide have diverse agroclimatic conditions conducive for the cultivation of different leafy vegetables. Present research study assessed six leafy vegetables for their composition at fifteen different agroecological sites. Fresh leaves of six leafy vegetables, i.e. alfalfa, water clover, spinach, leaf mustard, pennywort, and fenugreek, were collected from the mountainous region. Procured leaf samples were brought to analytical laboratory and were subjected to physicochemical and phytochemical analysis, i.e. moisture content, pH, TSS, ascorbic acid, carotenoids, phenolic content, flavonoids, and antioxidant potential. Among all the sampling sites and vegetables, a significant variation was observed for the physicochemical and phytochemical parameters. In samples procured from different agroecological sites, the better retention of quality parameters was observed among the leaf sample collected from fifteen different agroecological sites. The highest values were recorded for moisture content in spinach at site 1, for pH in leaf mustard at sites 4, 5 and 6, for TSS in spinach at sites 6 and 9, for ascorbic acid in alfalfa at site 6, for total phenolics in spinach at site 5, for carotenoid in leaf mustard at site 5, for flavonoids in fenugreek at site 5, and for antioxidant in spinach at site 6. It can be concluded that mountainous regions are rich in agroecological conditions suitable for producing leafy vegetables carrying healthful constituents for the consumption by human beings.
Introduction
Green leafy vegetables being the major source of numerous physicochemical and phytochemical constituents play a significant role for growth and maintenance of good health of human being. Life on earth faces harsh intimidation by a variety of never-ending diseases and ailments such as cancer, strokes, and cardiovascular ailments. There is requirement to utilize nature’s best and gifted weapons which are vegetables and fruits to fight intimidating ailments. Vegetables are house of treasure for diversity of bioactive phytochemicals and nutrients which are important constituents of human daily diet.[Citation1] Leafy vegetables make a key fraction of diet for daily requirement of human body universally and helps in growth, development, and immunity of human body as resource of phytochemicals i.e., (carotenoids, total phenolics, antioxidants etc.) and vitamins.[Citation2]
In vegetables, occurrence of plant chemicals, adding together to vitamins and pro-vitamins, helps in vital nutritional requirement for preventing never-ending ailments such as heart problems, cancer, and diabetes. Several among these phytochemicals show essential role in providing strong antioxidant properties compared to vitamins E and C and â-carotene present within the food.[Citation3] Vegetables have phytochemicals along with antioxidant potential and have capability of scavenging free radicals and helpful for prevention of abnormal cell division from formation of tumor and numerous research shown that many agricultural produces with phytochemicals prevent growth of cancer cells.[Citation4] Moreover, vegetables are important in daily routine diet of human body for helping the regular functioning of various body organ systems. Vegetables are low in fats and calories.[Citation5] Vegetables as therapeutic plants contain low toxic effects and are capable to produce several secondary metabolites of comparatively compound structures to generate antimicrobial properties in human body.[Citation6] From a food system point of view, constancy, and functionality of phytochemical components in human body differ as it is dependent on quantity, variety, association of molecules, position in food matrix, and existence of rest of other bioactive constituents in vegetables.[Citation7] Nutritional significance of vegetable green leaves concerned to their situation as major manufacturers in human food chain. As plants are manufacturers they absorb minerals and water from soil for different anabolic phenomenon.[Citation8]
Green vegetables are plants with edible leaves which are derived from large diversity of plants which are grown in different environments. Spinach and mustard are grown near the beginning springtime and provide important source of vitamin C. Carotenoids, minerals and dietary fiber are present in green leafy vegetables.[Citation9] The significance of indigenous vegetables of mountainous region is not yet recognized and distinguished to make a deeper attention to discover how to propagate these and their capability as source of phytochemicals. Research regarding to antioxidant potential of indigenous vegetables helps to recognize leafy greens with good potential for health benefits.[Citation10] Alfalfa is in family Fabaceae, is a perennial flowering vegetable and Medicago sativa is botanical name.[Citation11] Alfalfa is known for its great capability as food and fodders both. It is rich in digesting enzymes, b-carotene, chlorophyll, and vitamins it is also known for its secondary metabolites having biological activities and its carotenoids and saponins are well known secondary metabolites in it.[Citation12] Water clover (Marsilea quadrifolia) is a water loving and amphibious plant its roots are found embedded into land soil. It has a preference to grow on light sandy and medium loamy soils.[Citation13] It is usually found in soil with moisture and its nutritional is very high due to presence of carbohydrates, proteins and amino acids and it also shows its richness in flavonoids and saponins as well. It is used as a diuretic and febrifuge and is useful for the treatment of snakebite and applied to abscesses.[Citation14]
Spinach is rich source of ample iron, and it is rich in inositol and choline, the constituents that help to inhibit arteriosclerosis, it is rich in Vitamin K. Spinach has been shown to be helpful with protecting the central nervous system. Dietetic consumption of spinach can have constructive special effects on numerous sorts of cancer.[Citation15] Leaf mustard’s botanical name is Brassica juncea L. It holds countless health supporting plant chemicals including glucosinolates, carotenoids and phenolic compounds. These complexes are frequently linked with their capability to turn as detoxifiers counter to oxidative anxiety.[Citation16] It contains dietary fibers, vitamins, and minerals but it is also rich in flavonoids and in leaf mustard it can inhibit, or cure diabetes and mustard influenced antioxidant potential.[Citation17] Pennywort’s botanical name is Centella asiatica (L) belongs to Urban (Apiaceae) family and it has numerous therapeutic properties and antioxidant potentials. It is used in the treatment of asthma, ulcers, antidepressant, antibacterial memory improvement, antifungal, psoriasis lepsory, vein diseases.[Citation18] It is good source of vitamins, niacin, and carotene. It contains alkaloids, flavonoids, amino acids, terpenoids and essential oils.[Citation19] Fenugreek’s botanical name is (Trigonella foenumgraecum L.) is one of the utmost ancient curative vegetation belongs to family Leguminosae. It is cultivated worldwide as semi-arid crop.[Citation20] The vegetable comprises of oils, flavonoids, fibers, polysaccharides, minerals, protein, and amino acids. Fenugreek has been comprehensively considered and experimental and clinical research revealed its antioxidant, anti-inflammatory, wound-healing, CNS stimulant, anticancer.[Citation21]
In terms of climatic variation, mountainous areas are recognized as global hot spot of climate change[Citation22] and its direct affects are on food security.[Citation23] Mountainous regions are hard areas with having a minute cultivable land even less than 10% and only 9% is devoted for growing vegetables.[Citation24] Mountainous areas are granted with varied climatic conditions favorable for cultivation of diverse locally important vegetables. Due to diversity of climatic conditions including soil, air and topography, leafy vegetables may vary in physicochemical and phytochemical composition and inherent potential for human health benefits compared to non-local vegetables transported and brought from rest of the country. There is lack of research work on physicochemical and phytochemical composition of locally grown leafy vegetables in different parts of mountainous regions. Objectives of this research were to gather basic information about type of leafy vegetables grown under different management practices, to assess variations in physicochemical composition of leafy vegetables and to evaluate leafy vegetables carrying higher levels of antioxidant potential for healthy life.
Materials and methods
Leafy vegetables grown in mountainous areas
The cultivable land in mountainous area is limited and most of the vegetables are grown in house gardens. These are the vegetables which are grown and consumed in significant quantity on daily basis. These green leafy vegetables are vital for growth and good health as these vegetables carry vital nutrients required for human body. Additionally, these are rich source of calcium, beta carotene, vitamin C and many other antioxidants. The consumption of green leafy vegetables in daily routine can reduce the risk of many diseases by increasing fiber for the better gut function. Some of the green leafy vegetables grown in mountainous areas are listed in . Pictorial depiction of some leafy vegetables grown at different agroecological sites is presented in .
Figure 1. Pictorial view of leafy vegetables grown at different agroecological sites.
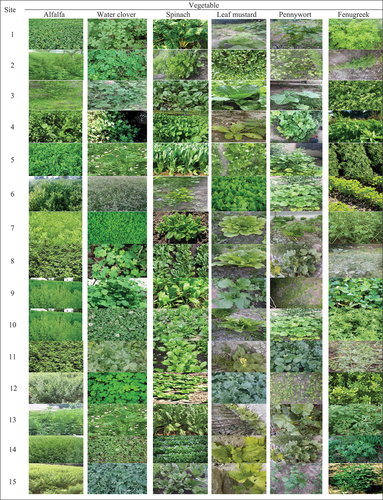
Table 1. Leafy vegetables grown in mountainous areas.
Agroecological conditions and plant material sampling
Present research was a comparison study where locally grown six leafy green vegetables were selected based on quantity consumed on daily basis. These six leafy vegetables were spinach (Spinacia oleracea), fenugreek (Trigonella foenum-graecum), water clover (Marsilea quadrifolia), leaf mustard (Brassica juncea), pennywort (Centella asiatica) and alfa alfa (Medicago sativa) identified by Dr. Ali Noor Shah, Faculty Member in the Department of Plant Sciences, Karakoram International University, Gilgit, Pakistan. The leafy vegetables were compared and evaluated based on the assessment of physicochemical and antioxidant potential. For this, fifteen different agroecological sites were selected (). From each of the selected sites and for each type of vegetable, leaf samples were procured. The collected leaf samples were analyzed for physicochemical and phytochemical properties including antioxidant potentials.
Table 2. Agroclimatic conditions at sampling sites.
Sample preparation
Leaf samples of vegetables were freshly ground for getting juice for the determination of various parameters except for moisture in which fresh vegetables were dried at 70°C in oven. Triplicate samples were prepared for each vegetable sample per each site of collection. Prepared samples were analyzed for phytochemical and physicochemical constituents.
Physicochemical analysis
The pH of each vegetable was estimated by standard method proposed by AOAC[Citation25] with digital pH meter (AD 1020). For measuring pH, vegetable samples were squeezed to get a juice type of solution. Juice of every sample was put separately in 100 mL beaker. After that electrode of pH meter was inserted to calibrate it by using buffer solutions of pH 4.0, pH 7.0 and pH 9. Electrode was wiped with tissue after washing it with distilled water. TSS was measured with digital refractometer using procedure of AOAC[Citation25] at ambient temperature. To find TSS, vegetables were juiced to get liquid matter. Composite juice of each vegetable was taken in separate beakers to take TSS of each vegetable. For calibration, lenses were wiped with distill water. Percent moisture was estimated with procedure set by AOAC[Citation25] using EquationEquation 2(2)
(2) . Petri dishes were cleaned and wiped with tissue for drying and were weighed out with electric balance. Then vegetable samples were kept at petri dishes for weighing purpose. Then dishes with samples were kept in oven for drying at 70°C. Dishes were then drawn out from oven and cooled down in desiccator and this step was repeated several times to achieve a constant weight. Moisture content was measured using EquationEq. 1
(1)
(1) .
Ascorbic acid or vitamin C was determined with standard procedure reported by AOAC[Citation25] and AL Majidi and Qubury.[Citation26] Firstly, solutions were made. Standard solution of dye was made by mixing 42 mg of NaHCO2 and 50 mg of 2, 6 dichlorophenol indophenol dyes and was gathered with hot water with making volume up to 250 mL. A 0.4% oxalic acid solution was prepared as well. For making standard ascorbic acid Oxalic acid was used to make volume of 50 mg of ascorbic acid was put in 50 mL flask. Then vegetable samples were prepared by juicing them from about 100 g of sample. Extracted juice was put in conical flask for sedimentation. Thereafter, 10 mL juice was taken from that sedimented layer and put in beaker and make volume with oxalic acid up to 100 mL. 10 mL of that diluted sample was taken in a conical flask for titration against dye solution in burette and titrated till pink color was observed in conical flask. Ascorbic acid was determined using Eq. 2.
where, F_ mL of ascorbic acid/mL of dye used for sample = factor of standardization, T_ mL of dye used in sample, S_ mL of sample taken for dilution, D_ mL of sample diluted by oxalic acid
Phytochemical analysis
Antioxidant inhibition percentage was carried out with the help of DPPH technique projected by Brand-Williams et al.[Citation27] through small changes employing Equation 1. DPPH solution was newly prepared every day because DPPH is heat sensitive and light that’s why it was enclosed by means of foil of aluminum and reserved at cold place. To calculate capacity of antioxidant sample, five gram of each sample was first ground for homogenization then was kept in 10 mL methanol for two days. From that solution, 0.1 mL was taken out in a volumetric type of flask and 3.9 mL of DPPH containing solution was mixed with reaction container placed at room temperature in incubation for about 30 mins. Then absorbance was measured at a wavelength of 517 nm in spectrophotometric after incubation. Antioxidant inhibition percentage was estimated with the Equation 3.
Carotenoids were determined by technique approved from Rodriguez-Amaya[Citation28] by small changes. Aimed at this reason, the 5 g of vegetables were ground, regimented and took out in methanol of 10 mL for 2 days. One mL of extract (mg/mL) gathered with 18 mL of petroleum ether with two mL methanol by making a proportion of (1:9) by using a separating funnel. After establishment of two layers one of layer of solution at bottom was separated. After draining of that layer in remaining solution petroleum ether was added and volume was made up to 20 mL then that solution was tested at spectrophotometer by using βeta carotene as standard at 450 nm wavelength. Folin-Ciocalteu procedure anticipated by Keskin et al.[Citation29] was taken as standard procedure to calculate phenolic content with few variations. Five grams of vegetables were ground, homogenized and took out in methanol of 10 mL for 2 days. One mL (mg/mL) of extracts of vegetables of diverse samples were gathered independently with one mL 1N F-C and 4.6 mL distilled water. After a while of 3 mints 3 mL of 2% of NaCO3 was added to the solution and left back for a period of 120 mints. Solution was analyzed at a wavelength of 760 nm on spectrophotometer. Flavonoids in vegetables were calculated with the technique anticipated by Kale et al.[Citation30] Five grams of vegetables samples were ground and put in 10 mL of methanol for extraction of phytochemicals for 2 days. Then one mL of sample (mg/mL) was taken from diverse samples and added four mL distill water, 0.3 mL 10% aluminum chloride and two mL 1 molar sodium hydroxide in a flask and volume was made up to 10 mL with distill water. Then at 510 nm absorbance of samples was checked by using standard curve of Quercitine using spectrophotometer.
Statistical analysis
Statistical program SAS version 9.0 was used to statistically analyze the data obtained from laboratory analysis of vegetable samples. The data was subjected to analysis of variance (ANOVA) for the level of significance (≤0.05) of difference and to Fisher protected Least Significant Difference (LSD) for differentiation of mean values.
Results and discussion
Physicochemical and phytochemical status of selected leafy vegetables
Moisture
The data regarding moisture content in all samples is presented in . The data revealed that moisture content of alfalfa was within the range of 66.3–75.3%. The maximum value of moisture (75.3%) was noted for site 1 followed by the site 9 having moisture 73.7%. The lowest moisture content (66.3%) amongst the samples was noted at site 12. The moisture content in all samples of water clover (Marsilea quadrifolia) from each of the sampling sites was within the range of 65.3–74.3%. The maximum value 74.3 was noted at site 1 and was followed by water clover (Shaptal) collected from the site 6 having a value of 72.7%. The lowest moisture content was 65.3% amongst the samples was noted in water clover (Shaptal) collected from the site 7. There was not a significant (p ≤ .05) difference in moisture content among the samples procured from various sites of the mountainous areas.
Figure 2. Effect of site and type of vegetable on contents of moisture (a, b) and pH (c, d) in leafy vegetables.
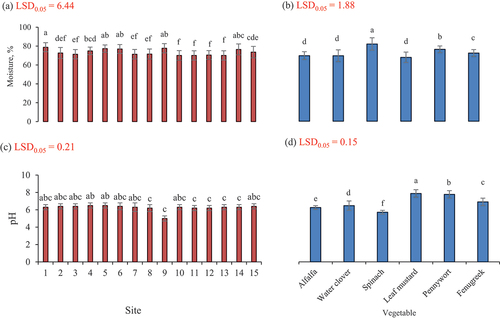
The moisture content in all the samples of spinach from each of the sampling sites was within the range of 77.7–88.3%. The maximum value of 88.3% moisture content was found at site 6 that was followed by spinach procured from 9 and 5 having a value of 87%. The lowest moisture content 77.6% amongst the samples was found in spinach collected from 11. Analysis of data showed a highly significant (p ≤ .05) difference in moisture content among the samples procured from various sites of mountainous valleys. These values of moisture content are higher compared to that recorded previously in leaves of water clover.[Citation31] These research findings are greater than that of flavonoid content (3.5 mg/g) in M. quadrifolia.[Citation14] Study results are slightly lower than the values reported by Tewani et al.[Citation15] who found moisture content 92% in spinach whereas current research results are greater than results in a study where moisture in spinach was 76%. Moisture content in all samples of leaf mustard (Brassica juncea L.) from each of the sampling site was within the range of 62.6–79.3%. The maximum value 79.3% was found at site 1. The lowest moisture content 62.6% amongst the samples was found in mustard collected from site 10. Analysis of data showed a very highly significant (p ≤ .05) difference found in moisture content among the samples procured from various locations of mountainous region. Results for moisture in pennywort samples for different areas are presented in . The moisture content in all samples of Centella asiatica from each of sampling site was within the range of 70.0–85.6%. The maximum value of moisture content 85.6% was noted at site 1. The lowest moisture content 70% amongst samples was found in the pennywort collected from site 13. Analysis of data showed a very highly significant (p ≤ .05) difference for moisture among the samples procured from various locations of the mountainous region. The research results found are slightly less than the results of a study where in pennywort moisture content was found as 87.5%[Citation32] and current values are also lower than the results of another study in which moisture content in centella asiatica was estimated as 88%.[Citation33] The moisture content in all samples of fenugreek leaves from each of the sampling sites was within the range of 69.6–78.7%. The maximum value 78.6% was found at site 6. The lowest moisture content 69.6% amongst the samples was found in sample collected from site 13. Analysis of data with statistical software showed a non-significant (p ≤ .05) difference for moisture among the samples procured from various sites of mountainous valleys. The research results found are slightly less than the results for a study where it was noted that moisture content in fenugreek puree was 87%.[Citation20] It was found that among all the vegetables the highest moisture content was noted in spinach collected from the site 6.
pH
Results for pH of all samples of leafy vegetables are presented in . The pH recorded in samples of alfalfa was in the range of 5.7–5.9. It was the highest pH 5.9 at sites 1, 4, 5, 6, 9 and 14 followed by pH 5.8 at sites 2, 3, 8, 10, and 11. The lowest pH (5.7) was noted at sites 7, 12, 13, and 15. Analysis of data showed a non-significant (p ≤ .05) difference for pH among samples procured from various sites of mountainous region. The pH noted in all samples of Marsilea quadrifolia (Shaptal) was in the range of 5.4–6.4. At most of the sites the pH was noted as 6.3 at sites 4, 6 and 9. The highest pH 6.4 was found at site 5 while the lowest pH 5.4 was observed at site 14. There was a non-significant (p ≤ .05) difference noted for pH among the samples procured from various locations of the mountainous region. The moisture content in leafy vegetables was greater at site where these were cultivated using glacier and rainfall water, cow manure and animal or manual tillage operations and moisture content was minimal at site where vegetables were grown using cow rainfall water, cow manure and manual tillage practices.
The pH was noted in samples of spinach in the range of 5.1–5.6. The highest pH 5.6 was found at site 14 while the lowest pH 5.1 was noted at site 12. These findings are less than the results of Grzeszczuk et al.[Citation34] who found that in raw spinach pH were 5.9. There was a significant (p ≤ .05) difference found in pH among the samples procured from various sites of mountainous region. These results are higher compared to flavonoids 7.46 mg/g found in leaf water clover.[Citation31] Research findings are higher as well than that noted by Agarwal et al.[Citation14] The pH found in all samples of mustard was in range of 7.1–7.5. The highest pH 7.5 was found at site 2 while the lowest pH 7.1 was at site 6. Analysis of data with statistical software showed a non-significant (p ≤ .05) difference for pH among the samples procured from various sites of mountainous region. These values are in line with results of study in which pH in Brassica juncea was noted as 7.2.[Citation35] The pH found in all samples of pennywort was in the range of 6.9–7.3. The highest pH (7.3) was noted at sites 4 and 5 while the lowest pH (6.9) was at site 8. The pH noted in all samples of fenugreek leaves was in the range of 6.2–6.6. The highest pH (6.6) was recorded at sites 4 and 5 while the lowest pH (6.2) was observed at sites 8 and 6. It was recorded that among all vegetables the highest pH was noted in leaf mustard that was collected from site 2.
The pH of leaf extract of leafy vegetables was greater where these were grown at middle altitudes (2200 m), medium climatic temperatures (22–34°C) and with glacier water as irrigation, cow manure as soil amendment and manual tillage practices. The pH of leaf extract was significantly reduced at lower altitudes with mild increases of temperature where vegetables are irrigated with glacier water, goat and cow manure applied and soil tilled manually.
Total soluble solids
Results for total soluble solids (TSS) of all samples are presented in . Regarding the leafy vegetable alfalfa, TSS analyzed for different samples procured from different sites was within the range of 4.9–5.7 ºBrix. Among the samples, the highest TSS value was found in samples procured from the site 6 that was 5.7 followed by the TSS values 5.6 at sites 5 and 9 and a TSS of 5.5 was found at site 10. Whereas 5.4 TSS was found at sites 2, 3, 7, 8, 11, 13 and 15. A TSS of 5.2 was examined at site 4 while the lowest TSS was noted 4.9 at the sites 1 and 14. The TSS analyzed for different samples of water clover procured from different sites was within the range of 5.3–6.37º Brix. Among the samples the highest TSS value (6.4) was noted in sample collected from the site while the lowest TSS (5.3) was examined at site 14.
Figure 3. Effect of site and type of vegetable on contents of TSS (a, b) and ascorbic acid (c, d) in leafy vegetables.
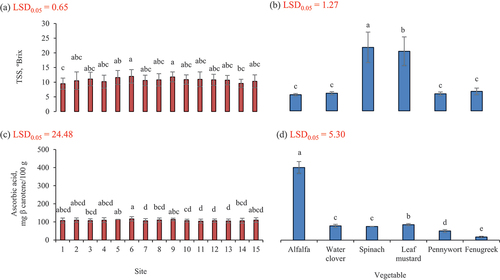
The TSS observed for different samples of spinach procured from different areas of three districts was within a range of 18.0–25.7 ºBrix. Among the samples, the highest TSS value was noted in samples collected from the site 6 was 25.67 while TSS 18.0 ºBrix was examined at site 4. There was a non-significant (p ≤ .05) difference found for TSS among the samples procured from various sites. TSS analyzed for different samples of leaf mustard procured from different areas was within the range of 14.7–22.6 ºBrix. Among samples the highest TSS value was observed in sample collected from the site 11 that was 22.6 ºBrix while TSS of 14.7 was the lowest at site 14. These results agree with a study in which TSS in brassica juncea was found as18%.[Citation36] These TSS values are higher than the TSS in brassica junea as found by Singh et al.[Citation37]
The TSS assessed for different samples procured from different sites was within the range of 5.2–6.4 ºBrix. Among samples the highest TSS value was noted in samples collected from the site 6 that was 6.4% while TSS of 5.2% and the lowest was examined for site 1. Current findings for TSS in vegetable samples were slightly higher than the results of a previous study where TSS found in pennywort was in the range of 4.2–4.3%.[Citation18]
The TSS determined for different samples procured from different areas was within the range of 6.0–6.8 ºBrix. Among the samples the highest TSS value was found in sample collected from sites 8 and 9 that was 6.8 while TSS of 6 °Brix as the lowest was examined at site 15. These findings for TSS in vegetable samples were in line with results of a study where TSS in fenugreek was found in the range of 6.4–6.7.[Citation38] It was found that among all vegetables the highest TSS was noted in spinach, and it was collected from the site 9.
The TSS was greater in vegetables grown at mid altitude (2251 m) having seasonal temperature 22–32°C and irrigated by glacier water and land prepared with cow manure and manual tillage. The TSS was significantly reduced at high altitude (2457 m) having low temperature (21–28 °C).
Ascorbic acid
Results of Ascorbic acid of different areas are presented in . Ascorbic acid was quantified for samples of Alfalfa procured from different sites and this parameter was within the range of 363.7–391.7 mg/100 g and among all the samples it was observed that maximum value (363.7 mg/100 g) of ascorbic acid was at the site 6 whereas the lowest value was 363.7 mg/100 g that was noted at the site 7. These research results are comparatively greater than results of Ancuceanu et al.[Citation39] in which sample of Medicago sativa leaves had low ascorbic acid concentration (225 mg/100 g). Ascorbic acid was examined for all samples of water clover procured from different sites and this parameter was within the range of 69.7–79.6 mg/100 g and among all the samples it was observed that maximum value of ascorbic acid was found ate site 5 whereas the lowest value was 69.7 mg/100 g that was noted at site 12.
Ascorbic acid was observed in samples of spinach procured from different sites and this parameter was within the range of 65.7–79.6 mg/100 g and among all the samples it was observed that maximum value of ascorbic acid was noted at site 8 whereas the lowest value was 65.7 mg/100 g that was noted at 11. Results of this research are higher than results of Mazzucotelli et al.[Citation40] who found total ascorbic acid content as 60.8 AAE/100 g in spinach whereas Karaca and Velioglu[Citation41] found it as 35 mg which is also less than current research. And Grzeszczuk et al.[Citation34] found that in raw spinach the ascorbic acid was 36.1%.
Ascorbic acid was recorded in all samples of leaf mustard procured from sites and this parameter was within the range of 74.0–91.0 mg/100 g and among all the samples it was observed that maximum value of ascorbic acid was noted at site 5 whereas the lowest value was 74 mg/100 g that was found at 12. Research results are also within range of findings for ascorbic acid content in brassica juncea that was found as 88 mg/g.[Citation36] While current results are greater than the results of previous study in which it was found that ascorbic acid in brassica juncea was 0.8 mg/g.[Citation38]
Ascorbic acid was quantified in all samples of pennywort procured from different sites and this parameter was within the range of 44.3–53.0 mg/100 g and among all the samples it was observed that maximum value of ascorbic acid was noted at site 9 whereas the lowest value was 44.3 mg/100 g that was found at site 14. These findings are in line with results of study where in pennywort vitamin C was noted as 42 mg/100 g.[Citation32] Research results are lower than results of a study where ascorbic acid in pennywort leaves was recorded as 0.8 mg/g.[Citation19]
Ascorbic acid was analyzed for all samples of fenugreek procured from different areas and this parameter was within the range of 14.0–21.3 mg/100 g and among all the samples it was detected that maximum value of ascorbic acid was at site 5 whereas the lowest value that was 14 mg/100 g that was recorded at sites 10 and 12. Research results are compatible with results of previous study where Vitamin C in fenugreek was found in the range of 14.7–15.1 mg/100 g.[Citation38] It was found that among all vegetables the highest ascorbic acid was found in alfalfa that was collected from the site 6.
Ascorbic acid content was significantly higher in leaf vegetables at mid altitude (2251 m) where temperature fluctuates between 23 to 34 C where vegetables were grown with rainfall water and land prepared with cow manure and synthetic fertilizer and tilled with animals and manually. Ascorbic acid content was decreased in vegetables grown at low altitudes with little high temperature where land was plowed manually and supplied with cow manure and synthetic fertilizer.
Total phenolic content
Results for total phenolics are presented in . Total phenolic content was measured for Alfalfa collected from different areas and it was found out that total phenolics ranged from 39.3–55.3 mg GAE/100 g. It was found that the highest phenolic content in Alfalfa samples was 55.3 mg GAE/100 g that was noted at sites 5 and 6. The lowest phenolic content (39.3 mg GAE/100 g) was observed at the site 14. In the rest of the areas, phenolic content was within this limit. These research results are slightly higher compared to the values of the total phenolic content in Alfalfa as 37.0 mg/g.[Citation11] The total phenolic content measured for water clover (Marsilea quadrifolia) collected from different sites was ranged from 61.0–74.6 mg GAE/100 g. It was noted that the highest phenolic content in water clover samples was 74.67 mg GAE/100 g that was noted at site 6. The lowest phenolic content was observed at site 14 and it was 61 mg GAE/100 g. Study results are higher than the phenolic content (8.34 mg/g) observed in leaf of M. quadrifolia.[Citation31] Research results for phenolic content are higher as compared to total phenolics in marsilea quadrifolia where 60.2 mg/g were noted in petroleum ether extract.[Citation42]
Figure 4. Effect of site and type of vegetable on contents of phenolics (a, b) and carotenoids (c, d) in leafy vegetables.
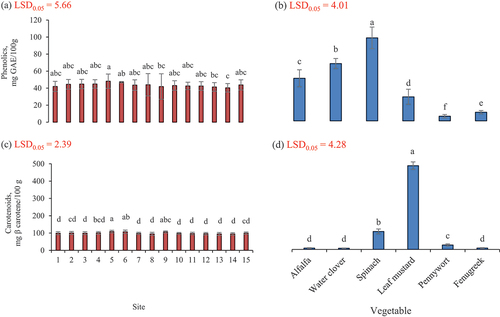
The total phenolic content was measured for spinach collected from different locations and it was ranged as 82.8–109.7 mg GAE/100 g. It was observed that the highest phenolic content in spinach samples was 109.7 mg GAE/100 g at the site 5. The lowest phenolic content was observed at site 9 that was 82.8 mg GAE/100 g. This study results are in line with the findings of Mazzucotelli et al.[Citation40] who found total phenolic content as 104.7 mg GAE/100 g in spinach. For spinach, TPC values reported by other authors[Citation43] noted was 107.0 and were also coherent with these results. Total phenolic content in fresh spinach was 2088 mg GAE/kg FW which were greater than the current findings.[Citation44]
Total phenolic content was measured for Mustard collected from different sites and was found out that total phenolics ranged as 22.5–49.2 mg GAE/100 g. It was observed that the highest phenolic content in Mustard samples was 49.2 mg GAE/100 g at the site 8. The lowest phenolic content was observed at site 9 as 49.2 mg GAE/100 g. It was observed that these results are in line with values of study in which phenolic content was ranged from 2.68 mg/g to 7.48 mg/g in different cultivars of Brassica juncea[Citation16] and research results are lower than this study in which it was found in brssica juncea as 21.98 mg/g.[Citation17] In another study it was recorded in brassica juncea as 8 mg/g that was also less than current findings.[Citation38]
Total phenolic content was computed for pennywort collected from different areas and it was noted in the range of 4.8–7.9 mg GAE/100 g. It was revealed the highest in the pennywort samples as 7.9 mg GAE/100 g at site 9. The lowest phenolic content was observed at site 14 as 4.83 mg GAE/100 g. It was observed that current results are higher than results of study where phenolic content in centella asiatica was found in the range of 0.3–0.4 mg/g.[Citation18] In another study it was observed that these findings are greater than levels of phenolics 2.9 g/100 g in centella asiatica.[Citation45] Research results are also in coherence with results of another author’s study where total phenolic content was determined according to Folin – Ciocalteu method, that varied from 3.2 to 11.7 g/100 g dry sample of pennywort.[Citation46] Another study indicated that these results are lower compared to their study where phenols in pennywort leaves were as 2.9 mg/g.[Citation19]
Total phenolics content was recorded for fenugreek leaves collected from various sites and it was noted that total phenolics were ranged from 9.3–12.7 mg GAE/100 g. It was noted that the highest phenolic content in samples was 12.7 mg GAE/100 g found at the site 5. The lowest phenolic content was observed at site 10 as 9.3 mg GAE/100 g. It was observed that the results are lower than results of previous study where total phenolics in Fenugreek leaves were quantified as 100 mg/g.[Citation21] Research results are higher than the previous study where total phenolics in Fenugreek leaves were noted as 8.7 μg GAE/mg samples.[Citation47] It was recorded that among all vegetables the highest total phenolic content was in spinach collected from site 5.
Total carotenoid content
Results for the carotenoid content are given in . Alfalfa samples procured from different areas of mountainous region for carotenoid content. It was observed that carotenoids content was in the range of 6.0–10.2 mg β carotene/100 g. It was investigated that the highest total carotenoids were observed in samples procured from site 6 as 10.2 mg β carotene/100 g whereas the lowest was observed in samples procured from site 1 as 6.0 mg β carotene/100 g.
Water clover (Shaptal) samples from various sites were analyzed for carotenoids content and it was done with petroleum ether method. It was observed that carotenoids content was in the range of 5.5–7.5 mg β carotene/100 g. It was investigated that the highest total carotenoids were observed in samples procured from site 7 as 7.5 mg β carotene/100 g whereas the lowest was observed in samples procured from the site 14 as 5.5 mg β carotene/100 g. Study results are higher in comparison with results of a previous study in which M. quadrifolia contained b carotene in the range of 2.8–2.6 due to seasonal variation.[Citation48]
Spinach samples from different sites were analyzed for the carotenoid contents. It was observed that the research results found for carotenoid content was in the range of 88.0–116.0 mg β carotene/100 g. It was investigated that the highest total carotenoids were observed in samples procured from the site 5 that was 116 mg β carotene/100 g whereas the lowest was observed in samples procured from site 8 as 88.0 mg β carotene/100 g. There was a very highly significant (p ≤ .05) difference found for carotenoids among the samples procured from various parts of mountainous region. Study results are in line with the findings of Mazzucotelli et al.[Citation40] Current findings are in line with results of Tiveron et al.[Citation49] who found that carotenoids were noted as 104.7 mg whereas these values are lower than those of Bunea et al.[Citation44] who found carotenoids in the range of 18.9 to 31.5 mg/kg in spinach.
Leaf mustard samples from different locations were analyzed for carotenoids content. It was observed that the values were in the range of 436.3–480.0 mg β carotene/100 g. It was investigated that the highest total carotenoids were observed in samples procured from the site 5 as 480 mg β carotene/100 g whereas the lowest was observed in samples procured from site 14 as 436.3 mg β carotene/100 g. Analysis of data showed a significant (p ≤ .05) difference for carotenoid among the samples procured from various parts of mountainous region. Values are less than results of previous study in which carotenoid content was ranged from 476 mg/g DW to 1114 mg/g in different cultivars of Brassica juncea[Citation16] and whereas research are greater than results of another study in which carotenoid content in Brassica juncea was found as 1.2 mg/g.[Citation36]
Pennywort leaves samples from different areas from mountainous valleys were analyzed for carotenoids contents and it was observed that the research results for carotenoids contents was in the range of 21.7–28.8 mg β carotene/100 g. It was investigated that the highest total carotenoids were observed in samples procured from site 5 as 28.8 mg β carotene/100 g whereas the lowest was observed in samples procured from site 11 as 21.9 mg β carotene/100 g. Analysis of data with showed a significant (p ≤ .05) difference for carotenoids among the samples procured from various parts of mountainous region. Current findings are much greater than findings of a study where in centella asiatica carotenoid content was found as 2400 μg/100 g.[Citation50]
Fenugreek leaves samples from different sites were analyzed for carotenoids contents and it was observed that carotenoids content was in the range of 6.2–8.7 mg β carotene/100 g. It was investigated that the highest total carotenoids were observed in samples procured from site 5 as 8.7 mg β carotene/100 g whereas the lowest was observed in samples procured from site 1 as 6.23 mg β carotene/100 g. Analysis of data showed highly significant (p ≤ .05) difference for carotenoids among the samples procured from various parts of mountainous region. Our research findings are much greater than findings of a previous study where carotenoids found were ranged from 3.34 to 4.11 mg/g in the leaves of fenugreek.[Citation51] Study results are lower than results of a previous study where in Fenugreek leaves carotenoid content was found as 0.6 mg/g.[Citation52] It was found that among all vegetables the highest carotenoid content was noted in leaf mustard collected from site 5.
Both phenolics and carotenoids in leafy greens were increased at 2280 m altitude where temperature remains 22 to 34 oC and land receives rainfall, soil is amended with cow and goat manures and tilled manually. Phenolics and carotenoids were significantly decreased in leaves at low altitude (2005 m) with high temperature (31–37°C) where land receives rainfall water and soil is amended goat manure and artificial fertilizer and tilled with tractor.
Total flavonoids content
Results for total flavonoids are presented in . Total flavonoid contents were also analyzed for samples procured from five areas of each of three districts and it was observed among districts that total flavonoid content was in the range of 14.0–18.6 mg Quercitne/100 g. The highest flavonoid content (18.6 mg Quercitne/100 g) found was observed in samples procured from site 5 and it was followed by samples procured from site 6 and it was 18.4 mg Quercitne/100 g while lowest flavonoid content among samples was found at site 7 and it was 14.1 mg Quercitne/g and rest of samples results were within above mentioned range. Analysis of data showed a significant (p ≤ .05) difference for flavonoids among the samples procured from various parts of mountainous region. Research results are higher than results of the total flavonoid content in alfalfa in research which was estimated as 12.6 mg/g.[Citation11]
Figure 5. Effect of site and type of vegetable on contents of flavonoids (a, b) and antioxidants (c, d) in leafy vegetables.
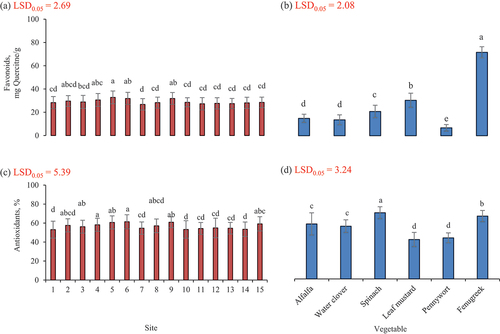
Total flavonoid contents were also analyzed for samples procured from different sites and was observed in the range of 8.3–18.3 mg Quercitne/g. The highest flavonoid content (18.3 mg Quercitne/g) was observed in samples procured from site 8 followed by samples procured from site 4 as 18.0 mg Quercitne/g while the lowest flavonoid content among the samples was recorded from the site 14 as 8.3 mg Quercitne/g. These results are higher compared to flavonoids content 7.5 mg/g found in leaf of water clover.[Citation31] These research findings are greater than that of flavonoid content noted in M. quadrifolia as 3.5 mg/g.[Citation14]
Total flavonoid contents were also computed from samples procured different sites and was observed in the range of 15.87–28.4 mg Quercitne/g. The highest flavonoid content (28.4 mg Quercitne/g) was observed in samples procured from site 5 while the lowest flavonoid content among samples was noted at site 7 as 15.9 mg Quercitne/g. There was a significant (p ≤ .05) difference noted for flavonoids among the samples procured from various parts of the mountainous region. Current values are less than the values noted by Mazzucotelli et al.[Citation40] as 160.6 mg QE/100 g in spinach. Research findings are in line with results of Lin and Tang[Citation53] who found it as 133.1 mg Quercitne/100 g.
Total flavonoid contents were also analyzed for samples procured from different locations and was noted ere in the range of 29.2–37.7 mg Quercitne/g. The highest flavonoid content (37.73 mg Quercitne/g) was observed in samples procured from site 5 while the lowest flavonoid content among samples was computed for site 12 as 29.23 mg Quercitne/g. These findings are in line with results of research where flavonoid content in Brassica juncea was noted as 31.2 mg/g.[Citation36]
Total flavonoid content was also recorded for samples procured from different sites and was observed in the range of 6.9–8.6 mg Quercitne/g. The highest flavonoid content (8.6 mg Quercitne/g) was observed in samples procured from the site 6 while the lowest flavonoid content among samples was noted at sites 11), 12 and 13 as 6.9 mg Quercitne/g. Analysis of data showed a significant (p ≤ .05) difference for flavonoids among the samples procured from different parts of mountainous region. These research results are greater than the findings of a previous study where flavonoids in centella asiatica leaves were found as 2.6 mg/g.[Citation19]
Total flavonoid content was also analyzed for samples procured from different locations and was observed in the range of 72.7–86.8 mg Quercitne/g. The highest flavonoid content (8.63 mg Quercitne/g) was recorded in samples brought from site 5 while the lowest flavonoid content was found for site 13 as 72.7 mg Quercitne/g. Analysis of data showed a very highly significant (p ≤ .05) difference for flavonoids among the samples procured from different parts of mountainous region. Research results agree with findings of a previous study where total flavonoids in Fenugreek leaves were quantified as 91.1 mg/g.[Citation21] It was noted that among all vegetables the highest flavonoid content was recorded in fenugreek collected from the site 5.
Total flavonoids in leafy vegetables were increased at 2280 m altitude where the temperature remained 22–34°C and land gets rainfall, soil is supplied with cow and goat manures and manually tilled. Phenolics were significantly decreased in leaves at mid altitude (2211 m) with temperature (25–35°C) where land receives glacier water and soil is amended cow manure and tilled with tractor.
Antioxidant potential
Results for antioxidants of Alfalfa are shown in . Alfalfa collected from various sites was analyzed for antioxidant potential and it was found that antioxidant potential among the samples were within the range of 54.0–65.0%. It was revealed that the highest antioxidant potential (65%) was noted in samples procured from the site 6 and 9. Whereas the lowest antioxidant potential was 54.0% observed at sites 1 and 14. Analysis of data showed a highly significant (p ≤ .05) difference for antioxidants among the samples procured from different sites of the mountainous region. Water clover collected from different sites was analyzed for antioxidant potential and it was noted that antioxidant potential among the samples were within the range of 53.3–63.7%. It was revealed that the highest antioxidant potential (63.7%) was noted in samples procured from the site 8 whereas the lowest antioxidant potential was 53.3% observed at site 1. Research results are comparatively greater in coherence with the results of previous research in which they found that DPPH radical scavenging activity of water clover in methanol extract was 60% and total antioxidant potential was noted as 48%.[Citation54]
Spinach collected from different sites were also analyzed for antioxidant potential and was within the range of 60.0–76.7%. It was revealed that the highest antioxidant potential (76.67%) was found in samples procured at site 6 whereas the lowest antioxidant potential was 60% observed at site 10. There was a highly significant (p ≤ .05) difference noted for antioxidants among the samples procured from various parts of the mountainous region.
Leaf mustard collected from different sites was also analyzed for antioxidant potential and was in the range of 32.7–46.7%. It was revealed that the highest antioxidant potential (46.7%) was noted in samples procured from site 5 whereas the lowest antioxidant potential was 32.7% observed at site 1. Current findings agree with study where they noted antioxidant potential ranged from 21.7 to 41.4% in different cultivars of Brassica juncea[Citation16] whereas in another study we found that antioxidant potential in Brassica juncea was 31.2% and it was slightly less than the current findings.[Citation36]
Pennywort collected from various sites were also analyzed for antioxidant potential and was recorded within the range of 39.3–51.0%. It was noted that the highest antioxidant potential (51%) was in samples procured from site 15 whereas the lowest antioxidant potential was 39.3% and was observed at sites 7 and 10. Analysis of data indicated a significant (p ≤ .05) difference for antioxidants among the samples procured from various parts of the mountainous region. These findings agree with the previous study where antioxidant activity in pennywort leaves was found as 40%.[Citation17] Observed values are lower than the results of study where antioxidant in pennywort was estimated as 88%.[Citation33]
Fenugreek leaves collected from different sites were also analyzed for antioxidant potential and was within the range of 59.0–75.3%. It was revealed that the highest antioxidant potential (75.3%) was recorded in samples procured from the site 9 whereas the lowest antioxidant potential was 59% observed at site 12. Analysis of data presented highly significant (p ≤ .05) difference for pH among the samples procured from various sites of the mountainous region. Research results are similar with previous study where total antioxidant potential in Fenugreek leaves was quantified as 78%.[Citation21] It was found that among all vegetables the highest antioxidant potential was recorded in spinach collected from the site 6.
Antioxidant potential of leaf vegetables was increased for medium altitudes with temperature range of 23–34°C where land receives rainfall as source of water and supplied with cow manure and synthetic fertilizers and tilled with animals and using hand tools. Antioxidant potential in leafy vegetables was significantly reduced when they were grown at low altitude (2005 m) where high temperature prevails (31–37°C) and land received rainfall water and prepared with goat manure and fertilizers and tilled with tractor.
Conclusion
From the research findings, it can be concluded that different areas of mountainous regions having diverse agroclimatic conditions are suitable for growing different vegetables. Some of those leafy vegetables (alfalfa, water clover, spinach, leaf mustard, pennywort, fenugreek) were assessed for different quality parameters (moisture, pH, TSS, ascorbic acid, phenolics, carotenoids, flavonoids, and antioxidants) and it was observed that some areas have shown better results for the quality parameters compared to the rest. It was noted that the better retention of quality parameters was in samples procured from sites with river irrigation, animal manure as source of soil amendment and tilled manually or using bullocks. Among all areas significant variation was observed in all the physico- and phyto-chemical parameters. These differences in quality attributes might be due to altitudinal and climatic variability of the area, cultural practices, soil organic content, soil pH, irrigation cum drainage patterns, cropping sequences, fertilizer cum manure application practices and quality of seeds adopted by the farmers. Hence, mountains can be suitable for growing leafy vegetables carrying high physicochemical and antioxidant potential for human health benefits through adopting appropriate crop management systems.
Availability of data and materials
The data that support the findings of this study are available from the corresponding author upon reasonable request.
Acknowledgment
The authors would like to extend their sincere appreciation to the Researchers Supporting Project , King Saud University, Riyadh, Saudi Arabia for funding this work through the project number (RSP-2024R437).
Disclosure statement
No potential conflict of interest was reported by the author(s).
References
- Agrawal, S. Investigating Chemical Attributes, Nutritional Significance, and Bioactive Elements in Horticultural Wonders. Pharma. Innov. J 2023, 12(12), 228–233. https://www.mdpi.com/2076-3417/12/19/9937.
- Mallor, C.; Bertolín, J. R.; Paracuellos, P.; Juan, T. Nutraceutical Potential of Leafy Vegetables Landraces at Microgreen, Baby, and Adult Stages of Development. Foods 2023, 12(17), 3173. DOI: 10.3390/foods12173173.
- Kumar, A. P. N.; Jose, M.; Kumar, A.; Oz, V.; Tomer, E.; Zeng, C.; Proestos, M.; Elobeid, T. K. S.; Oz, F.; K, S. Major Phytochemicals: Recent Advances in Health Benefits and Extraction Method. Molecules 2023, 28(2), 887. DOI: 10.3390/molecules28020887.
- Solomon, A.; Golubowicz, S.; Yablowicz, Z.; Bergman, M.; Grossman, S.; Altman, A.; Kerem, Z.; Flaishman, M. A. Protection of Fibroblasts (NIH-3T3) Against Oxidative Damage by Cyanidin-3-Rhamnoglucoside Isolated from Fig Fruits (Ficus Carica L.). J. Agric. Food Chem. 2010, 58(11), 6660–6665. DOI: 10.1021/jf100122a.
- Banerjee, A.; Datta, J. K.; Mondal, N. K. Biochemical Changes in Leaves of Mustard Under the Influence of Different Fertilizers and Cycocel. J. Agric. Technol. 2012, 8(4), 1397–1411. http://www.ijat-aatsea.com.
- Bhat, R. S.; Al-Daihan, S. Phytochemical Constituents and Antibacterial Activity of Some Green Leafy Vegetables. Asian Pac. J. Trop. Biomed. 2014, 4(3), 189–193. DOI: 10.1016/S2221-1691(14)60230-6.
- Leong, S. Y.; Oey, I. Effects of Processing on Anthocyanins, Carotenoids and Vitamin C in Summer Fruits and Vegetables. Food Chem. 2012, 30, 1–11. DOI: 10.1016/j.foodchem.2012.02.052.
- Walt, A. M. V.; Loots, D. T.; Ibrahima, M. I. M.; Bezuidenhout, C. C. Minerals, Trace Elements and Antioxidant Phytochemicals in Wild African Dark-Green Leafy Vegetables (Morogo). South Afr. J. Sci. 2009, 105, 444–448. http://www.scielo.org.za/scielo.php?script=sci_arttext&pid=S0038-23532009000600016&lng=en&nrm=iso>.
- Duma, M.; Alsina, I.; Zeipina, S.; Lepse, L.; Dubova, L. Leaf Vegetables as Source of Phytochemicals. Food Balt. 2014, 262–265. https://api.semanticscholar.org/CorpusID:10765640.
- Baang, R. P.; Rosario, R. M. D.; Palmes, N. D. Phytochemical Profiles and Antioxidant Activity of Selected Indigenous Vegetables in Northern Mindanao, Philippines. Int. J. Biol. Biomol. Agric. Food Biotechnol. Eng 2015, 9(8). https://zenodo.org/records/1107397.
- Karimi, E.; Oskoueian, E.; Oskoueian, A.; Omidvar, V.; Hendra, R.; Nazeran, H. Insight into the Functional and Medicinal Properties of Medicago Sativa (Alfalfa) Leaves Extract. J. Med. Plants Res. 2013, 7(7), 290–297. DOI: 10.5897/JMPR11.1663.
- Golawska, S.; Lukasik, I.; Kapusta, I.; Janda, B. Analysis of Flavonoids Content in Alfalfa. Ecol. Chem. Eng 2010, 17(2–3), 261–267. https://bibliotekanauki.pl/articles/389243.
- Soni, P.; Singh, L. Marsilea Quadrifolia Linn. a Valuable Culinary and Remedial Fern in Jaduguda, Jharkhand, India. Life Sci. Plant. Ecol. 2012, 2(3), 99–104. http://ijlpr.com/admin/php/uploads/106_pdf.pdf.
- Agarwal, S. K.; Roy, S.; Pramanick, P.; Mitra, P.; Gobato, R.; Mitra, A. Marsilea Quadrifolia: A Floral Species with Unique Medicinal Properties. Parana. J.Sci. Educ. (PJSE) 2018, 4(5), 15–20. https://zenodo.org/records/3843336.
- Tewani, R.; Sharma, J. K.; Rao, S. V. Spinach (Palak) Natural Laxative. Int. J. Appl. Res. Technol 2016, 1(2). http://www.ijart.info/.
- Frazie, M. D.; Kim, M. J.; Ku, K. M. Health-Promoting Phytochemicals from 11 Mustard Cultivars at Baby Leaf and Mature Stages. Molecules 2017, 22(10), 17–49. DOI: 10.3390/molecules22101749.
- Huang, S.; Huang, M.; Feng, B. Antioxidant Activity of Extracts Produced from Pickled and Dried Mustard (Brassica Juncea Coss. Var. Foliosa Bailey). Int. J. Food Prop. 2012, 15(2), 374–384. DOI: 10.1080/10942912.2010.487628.
- Gupta, A.; Verma, S.; Kushwaha, P.; Srivastava, S.; Rawat, A. K. S. Quantitative Estimation of Asiatic Acid, Asiaticoside and Madecassoside in Two Accessions of Centella Asiatica (L) Urban for Morpho-Chemotypic Variation. Indian J. Pharm. Educ. Res 2014, 48(3), 75–79. DOI: 10.5530/ijper.48.3.9.
- Asti Arum Sari, A. A.; Munawaroh, R.; Sofyanita, E. N. Bibliometric Analysis of Antibacterial Activity of Centella asiatica: A Study Based on Scopus Database. J. Appl. Pharm. Sci. 2023, 13(11), 001–015. DOI: 10.7324/JAPS.2023.139686.
- Najeeb, M. D. M.; Zubair, S.; Sawate, A. R.; Gadhe, K. S. Studies on Physico-Chemical and Sensory Quality of Noodles Incorporated with Fenugreek Leaves (Trigonella Foenum-Graecum L.) Puree. Int. J. Chem. Stud. 2018, 6(2), 3150–3153.
- Gungor, S. S. U.; Guzel, S.; İlcim, A.; Kokdil, G. Total Phenolic and Flavonoid Content, Mineral Compositionand Antioxidant Potential of Trigonella Monspeliaca. Turk J. Pharmcy. Sci. 2014, 11(3), 255–262. https://api.semanticscholar.org/CorpusID:218914038.
- IPCC, W.G.I. Climate Change 2007: The Physical Science Basis: Contribution of Working Group I to the Fourth Assessment Report of the Intergovernmental Panel on Climate Change; UK, Cambridge University Press: Cambridge, 2007.
- Gioli, G.; Khan, T.; Scheffran, J. Gender and Environmentally Induced Migration in Gilgit-Baltistan, Pakistan. In Sustainable Development in South Asia: Shaping the Future, Sustainable Development Policy Institute, Aneel, S., Haroon, U., and Niazi, I., Eds. Islamabad and Sang-e-Meel Publishers: Lahore, Pakistan, 2014; pp. 355–378.
- Government of Pakistan (GOP) and IUCN. Northern Areas State of Environment and Development; IUCN Pakistan: Karachi, Pakistan, 2003.
- AOAC. Official Methods of Analysis, 18th ed.; Association of Official Analytical Chemists: Gaithersburg, MD, USA, 2006.
- Al Majidi, M. I. H.; Qubury, H. Y. Determination of Vitamin C (Ascorbic Acid) Contents in Various Fruit and Vegetable by UV-Spectrophotometry and Titration Methods. J. Chem. Pharm. Sci 2016, 9(4), 2972–2974.
- Brand-Williams, W.; Cuvelier, M. E.; Berset, C. Use of a Free Radical Method to Evaluate Antioxidant Activity. LWT - Food Sci. Technol. 1995, 28(1), 25–30. DOI: 10.1016/S0023-6438(95)80008-5.
- Rodriguez-Amaya, D. B. A Guide to Carotenoid Analysis in Foods; International Life Sciences Institute (ILSI) Press: Washington, 1999.
- Keskin, S.; Karlidag, S.; Mayda, N.; Ozkok, A. Comparison of Biochemical and Antimicrobial Activities of Different Honey Samples. Czech J. Food Sci. 2021, 39(4), 273–280. DOI: 10.17221/38/2021-CJFS.
- Kale, A.; Gaikwad, S.; Mundhe, K.; Deshpande, N.; Salvekar, J. Quantification of Phenolics and Flavonoids by Spectrophotometer from Junglans Regia. Int. J. Pharma Bio. Sci 2010, 1, 1–4.
- Gopalakrishnan, K. Phytochemical Content of Leaf and Stem of Marsilea Quadrifolia (L.). J. Plant Sci. Phytopathol 2017, 1(1), 026–037. DOI: 10.29328/journal.jpsp.1001003.
- Tee, E. S.; Ismail, M. N.; Nasir, M. A.; Khatijah, I. Nutrient Composition of Malaysian Foods. Malaysian Food Composition Database Programme, 4th ed.; Ministry of Health: Malaysia, 1997.
- Odhav, B.; Beekrum, S.; Akula, U. S.; Baijnath, H. Preliminary Assessment of Nutritional Value of Traditional Leafy Vegetables in KwaZulu-Natal, South Africa. J. Food Composition Anal. 2007, 20(5), 430–435. DOI: 10.1016/j.jfca.2006.04.015.
- Grzeszczuk, M.; Jadczak, D.; Podsiadło, C. The Effect of Blanching, Freezing and Freeze-Storage on Changes of Some Chemical Compounds Content in New Zealand Spinach. Res. Gate. 2007, 66(1), 95–103. DOI: 10.2478/v10032-007-0012-x.
- Achumi, H. A.; David, A. A.; Dawson, J.; Thomas, T. Response of FYM Nitrogen and Sulphur on Soil Pysico-Chemical Properties and Yield of Mustard (Brassica Juncea L.) Var. Varuna Int. J. Chem. Stud 2018, 6(4), 2028–2032.
- Golubkina, N.; Kekina, H.; Caruso, G. Yield, Quality and Antioxidant Properties of Indian Mustard (Brassica Juncea L.) in Response to Foliar Biofortification with Selenium and Iodine. Plants. 2018, 7(4), 80. DOI: 10.3390/plants7040080.
- Singh, Y.; Rao, D. V.; Batra, A. Biochemical Changes in Brassica Juncea (L.) Czern & Coss Infected with Albugo Candida Kuntz. (Pers.) Int. J.Pharm Sci. Rev. Res 2011, 7(1). https://api.semanticscholar.org/CorpusID:85657561.
- Ahmed, M. A.; Ibrahim, O. M.; Elham, A. B. Effect of Bio and Mineral Phosphorus Fertilizer on the Growth, Productivity and Nutritional Value of Fenugreek (Trigonella Foenum Graecum L.) in Newly Cultivated Land. Res. J. Agri. Biol. Sci 2010, 6(3), 339–348. https://api.semanticscholar.org/CorpusID:111360754.
- Ancuceanu, R.; Arama, C.; Neagu, A. F.; Dinu, M.; Hovanet, M. V.; Olaru, O. T.; Popescu, C.; Anghel, A. I. Ascorbic Acid Is Virtually Degraded in Dried Herbal Products - an Hplc Assessment of Six Plant Species. Farmacia 2015, 63(5), 745–750. https://api.semanticscholar.org/CorpusID:198162216.
- Mazzucotelli, C. A.; González-Aguilar, G. A.; Villegas-Ochoa, M. A.; Domínguez-Avila, A. J.; Ansorena, M. R.; Di Scala, K. C. Chemical Characterization and Functional Properties of Selected Leafy Vegetables for Innovative Mixed Salads. J. Food Biochem. 2018, 42(1), e12461. DOI: 10.1111/jfbc.12461.
- Karaca, H.; Velioglu, Y. S. Effects of Ozone Treatments on Microbial Quality and Some Chemical Properties of Lettuce, Spinach, and Parsley. Postharvest Biol. Technol. 2014, 88, 46–53. DOI: 10.1016/j.postharvbio.2013.09.003.
- Pepsi, A.; Ben, C. P.; Jeeva, S. Phytochemical Analysis of Four Traditionally Important Aquatic Species. Int. Res. J. Biol. Sci. 2012, 1(5), 66–69. https://www.isca.me/IJBS/Archive/v1/i5/11.ISCA-IRJBS-2012-145.pdf.
- Ninfali, P.; Bacchiocca, M. Polyphenols and Antioxidant Capacity of Vegetables Under Fresh and Frozen Conditions. J. Agric. Food Chem. 2003, 51(8), 2222–2226. DOI: 10.1021/jf020936m.
- Bunea, A.; Andjelkovic, M.; Socaciu, C.; Bobis, O.; Neacsu, M.; Verhe, R.; Camp, J. V. Total and Individual Carotenoids and Phenolic Acids Content in Fresh, Refrigerated and Processed Spinach (Spinacia Oleracea L.). Food Chem. 2008, 108(2), 649–656. DOI: 10.1016/j.foodchem.2007.11.056.
- Pittella, F.; Rafael, C. D.; Dalton, D. J.; Miriam, T. P. L.; Barbosa, N. R. Antioxidant and Cytotoxic Activities of Centella Asiatica (L) Urb. Int. J Moecular Sci 2009, 10(9), 3713–3721. DOI: 10.3390/ijms10093713.
- Zainol, M. K.; Hamid, A.; Yousof, S.; Muse, R. Antioxidative Activity and Total Phenolic Compounds of Leaf, Root and Petiole of Four Accessions of Centella Asiatica (L.) Urban. Food Chem. 2003, 81(4), 575–5581. DOI: 10.1016/S0308-8146(02)00498-3.
- Pasricha, V.; Gupta, R. K. Nutraceutical potential of Methi (Trigonella foenumgraecum. L.) and Kasuri methi (Trigonella corniculata). J. Pharmacogn. Phytochem 2014, 3(4), 47–57.
- Dewanji, A.; Krewski, D.; Goddard, M. J. A Weibull Model for Estimating Tumorigenic Potency. Biometrics 1992, 49(2), 367–377. DOI: 10.2307/2532550.
- Tiveron, A. P., Melo, P. S., Bergamaschi, K. B., Vieira, T. M., Regitanod’arce, M. A. and Alencar, S. M. Antioxidant Activity of Brazilian Vegetables and its Relation with Phenolic Composition. Int. J. Mol. Sci. 2012, 13(7), 8943–8957. DOI: 10.3390/ijms13078943.
- Sneha, V.; Pooja, A.; Amrita, D.; Divya, K.; Viswanatha, C. K. Antimicrobial and Antioxidant Activities in the Root, Stem and Leaf Extracts of Centella Asiatica. Adv. Biotech. Micro 2017, 3(4), 555618. DOI: 10.19080/AIBM.2017.03.555618.
- Kadam, V. B.; Deore, S. V.; Kadam, U. B. Estimation of Chlorophyll Content in Leaves of Trigonella Foenum-Graecum Linn. World J Pharm Sci 2017, 6(3), 569–572. DOI: 10.20959/wjpps2017.
- Ramezani, S.; Yousefshahi, B.; Farrokhzad, Y.; Ramezan, D.; Zargar, M.; Pakina, E. Selenium and Iodine Biofortification Interacting with Supplementary Blue Light to Enhance the Growth Characteristics, Pigments, Trigonelline and Seed Yield of Fenugreek (Trigonella Foenum-Gracum L.). Agronomy. 2023, 13(8), 2070. DOI: 10.3390/agronomy13082070.
- Lin, J.; Tang, C. Determination of Total Phenolic and Flavonoid Contents in Selected Fruits and Vegetables, as Well as Their Stimulatory Effects on Mouse Splenocyte Proliferation. Food Chem. 2007, 101(1), 140–147. DOI: 10.1016/j.foodchem.2006.01.014.
- Kolodziejczyk-Czepas, J.; Nowak, P.; Kowalska, I.; Stochmal, A. Biological Activity of Clovers – Free Radical Scavenging Ability and Antioxidant Action of Six Trifolium Species. Pharm. Biol. 2014, 52(10), 1308–1314. DOI: 10.3109/13880209.2014.891042.