
 ?Mathematical formulae have been encoded as MathML and are displayed in this HTML version using MathJax in order to improve their display. Uncheck the box to turn MathJax off. This feature requires Javascript. Click on a formula to zoom.
ABSTRACT
Organic carbon (OC), elemental carbon (EC), and 90 organic compounds (36 polycyclic aromatic hydrocarbons [PAHs], 25 n-alkane homologues, 17 hopanes, and 12 steranes) were concurrently quantified in atmospheric particulate matter of PM2.5 and PM10. The 24-hr PM samples were collected using Harvard Impactors at a suburban site in Doha, Qatar, from May to December 2015. The mass concentrations (mean ± standard deviation) of PM2.5 and PM10 were 40 ± 15 and 145 ± 70 µg m−3, respectively, exceeding the World Health Organization (WHO) air quality guidelines. Coarse particles comprised 70% of PM10. Total carbonaceous contents accounted for 14% of PM2.5 and 10% of PM10 particulate mass. The major fraction (90%) of EC was associated with the PM2.5. In contrast, 70% of OC content was found in the PM2.5–10 fraction. The secondary OC accounted for 60–68% of the total OC in both PM fractions, indicating photochemical conversions of organics are much active in the area due to higher air temperatures and solar radiations. Among the studied compounds, n-alkanes were the most abundant group, followed by PAHs, hopanes, and steranes. n-Alkanes from C25 to C35 prevailed with a predominance of odd carbon numbered congeners (C27–C31). High-molecular-weight PAHs (5–6 rings) also prevailed, within their class, with benzo[b + j]fluoranthene (Bb + jF) being the dominant member. PAHs were mainly (80%) associated with the PM2.5 fraction. Local vehicular and fugitive emissions were predominant during low-speed southeasterly winds from urban areas, while remote petrogenic/biogenic emissions were particularly significant under prevailing northwesterly wind conditions.
Implications: An unprecedented study in Qatar established concentration profiles of EC, OC, and 90 organic compounds in PM2.5 and PM10. Multiple tracer organic compounds for each source can be used for convincing source apportionment. Particle concentrations exceeded WHO air quality guidelines for 82–96% of the time, revealing a severe problem of atmospheric PM in Doha. Dominance of EC and PAHs in fine particles signifies contributions from combustion sources. Dependence of pollutants concentrations on wind speed and direction suggests their significant temporal and spatial variability, indicating opportunities for improving the air quality by identifying sources of airborne contaminants.
Introduction
In recent decades, deteriorated air quality has become one of the most severe environmental concerns globally. Airborne particulate matter (PM), that is, PM2.5 and PM10 (particles of aerodynamic diameter less than or equal to 2.5 and 10 µm, respectively), has received great scientific and public attention, due to its critical roles in atmospheric processes, adverse health effects, and global climate change (Alves et al. Citation2014; Choi et al. Citation2016; Kocak, Mihalopoulos, and Kubilay Citation2007; Liu et al. Citation2015; Pipal and Satsangi Citation2015). PM10 is of primary concern for global environmental issues, such as visibility, air quality deterioration (Andreae et al. Citation2002; Khan et al. Citation2016; Kocak, Mihalopoulos, and Kubilay Citation2007), and impact on solar energy utilization due to airborne dust deposition on photovoltaic panels (Guo et al. Citation2015; Javed, Guo, and Figgis Citation2017; Sarver, Al-Qaraghuli, and Kazmerski Citation2013). PM2.5 has significant impacts on human health (Mar et al. Citation2000; Ostro, Broadwin, and Lipsett Citation2000), cloud condensation and ice nucleation (Tang, Cziczo, and Grassian Citation2016), radiative forcing (Wang et al. Citation2015b), and regional air quality (Zhou et al. Citation2016). Fine particles have a large surface-to-volume ratio, with a relatively long residence time in the atmosphere, and thus are composed of higher fractions of organic compounds compared to PM10 (Bi et al. Citation2005; Sanchez-Soberon et al. Citation2016; Sarti et al. Citation2017). Because of these differences, characterization of size-segregated PM is very important for both epidemiological and regulatory purposes.
Depending on the method of classification and area of interest, various components of PM may be the subject of studies, such as trace metals, inorganic salts, ions, black carbon, organic compounds, and bioaerosols. The organic fraction of PM is a complex mixture of compound including polycyclic aromatic hydrocarbons (PAHs), n-alkanes, n-alkanoic acid, hopanes, and steranes (Mandalakis et al. Citation2002). These organic compounds can originate from various natural and anthropogenic sources, such as industrial emissions, vehicle exhaust, and other fossil fuel combustion like coal combustion (Choi et al. Citation2016; Rushdi et al. Citation2017). Some of these PM-bound organic compounds, such as PAHs, are of great concern owing to their well-known mutagenic and carcinogenic characteristics (Liu et al. Citation2015; Pongpiachan et al. Citation2015). On the other hand, these organic substances can also be used as tracers for source apportionment.
A number of epidemiological and toxicological studies have investigated both short- and long-term health effects of PM exposure, especially on the cardiovascular and respiratory systems (Liu et al. Citation2015; Mar et al. Citation2000; Ostro, Broadwin, and Lipsett Citation2000; Pongpiachan et al. Citation2015). The impact of size-segregated PM composition on health is not yet well understood, but it appears that the composition and size of particles play a significant role in the type and severity of health effects caused (Ostro, Broadwin, and Lipsett Citation2000). Considerable toxicity appears to be associated with the organic fractions of PM, particularly with species such as PAHs and persistent organic pollutants (POPs) (Cassee et al. Citation2013; Liu et al. Citation2015; Pongpiachan et al. Citation2015). Due to the high variability in composition and size distribution, the organic compounds in atmospheric PM fractions need to be quantified for purposes of evaluating PM health effects and characterizing emission sources.
A vast number of measurements of atmospheric concentrations of organic compounds have been reported from large cities around the world (Mancilla et al. Citation2016; Shirmohammadi et al. Citation2016; and references therein). However, there have been limited information and existing data relating to mass concentration, composition, and source characteristics of airborne organic compounds in the Middle East region, particularly in Qatar. This lack of information constrains the development of control strategies to reduce PM pollution in the area. Therefore, there is a great concern about the regional and global environmental consequences of organic aerosol pollution in the region. Doha, the capital of Qatar, is one of the major urban centers in the Middle East. With rapid economic growth and a concomitant increase in energy consumption, Doha has been suffering from air pollution with unusually high levels of atmospheric PM (PM2.5 ranged from 67 to 172 µg m−3 and PM10 from 65 to 267 µg m−3) (Engelbrecht et al. Citation2009; Saraga et al. Citation2017). The World Health Organization (WHO) ranked Doha at 12th among the world’s top 20 most polluted cities, based on the annual mean concentration of PM2.5 and PM10 (WHO Citation2014). The city is highly populated, densely motorized, and industrialized, which gives rise to various PM sources in the region. Although the environmental and health effects of air pollution may have already been felt by the residents of Qatar (Janahi, Bener, and Bush Citation2006), there is a lack of research on the chemical composition and sources of PM over this region.
In this study, carbonaceous aerosol in PM2.5 and PM10 samples, collected at a suburban site in Doha, Qatar, were identified and quantified. The chemical analysis included the concentrations and compositions of PM, organic carbon (OC), elemental carbon (EC), and organic compounds, comprising PAHs, n-alkanes, hopanes, and steranes (a total of 90 individual organic species) in PM2.5 and PM10. This is the first report regarding the compositional profile of organic aerosols in Qatar. The study provides useful information to monitor trends over time, identify primary sources of organic environmental contamination, evaluate health and environmental consequences, and initiate pollution mitigation strategies.
Materials and methods
Sampling location
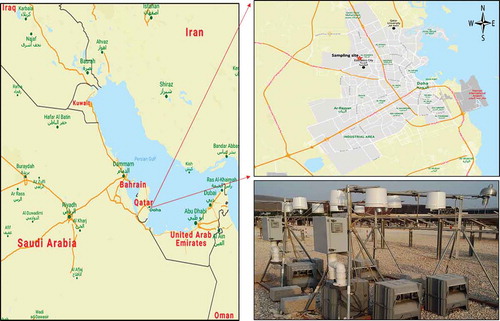
Qatar is a desert country situated on a peninsula. Its unique geography and climate, as well as the typical petroleum industry, make it unique and different from other studied areas of the world. PM sampling was carried out at the Solar Test Facility (STF), Qatar Foundation (at latitude 25º19’32.68” N and longitude 51º25’59.55” E), located in Doha, Qatar. The elevation of the site was approximately 11 m above sea level. This suburban site was located northwest of the city center and in a residential and commercial area with residences, schools/universities, gas stations, health centers, shopping centers, and several governmental facilities. As a result, it is impacted by local pollution sources, such as traffic and construction activities, which often are important contributors to population exposure to air pollutants in urban areas. Influence from regional sources is also expected, considering the meteorological conditions that often favor long-range transport. The sampling site location in Doha Qatar is shown in .
Figure 1. Location of PM sampling site in Doha, Qatar.
PM sampling
The 8-month sampling campaign was conducted from May 18 to December 14, 2015. Twenty-four-hour PM2.5 and PM10 filter samples were collected every other day for PM mass and EC/OC analysis. In total, 105 PM2.5 and 105 PM10 samples were collected for mass and EC/OC analysis. Filter samples of PM2.5 and PM10 for organic compounds analysis were collected every sixth day, resulting in a total of sixty-eight 24-hr samples (34 concurrent pairs) of PM2.5 and PM10 for organic compound analysis. Additionally, six duplicates of each PM2.5 and PM10 for PM mass and EC/OC analysis and four duplicates for organics analysis were collected using co-located samplers. Moreover, three to five field blank samples were also collected for quality control. All samples were collected from 9:00 a.m. (local time; GMT +3) to 9:00 a.m. the following day. PM10 particle samples were collected at a flow rate of 10 L min−1 (total air volume: 14.4 m3 day−1) and PM2.5 at a flow rate of 16.7 L min−1 (total air volume: 24.05 m3 day−1).
All PM samples were collected using modified Rupprecht & Patashnick Co., Inc., model 3500 ChemCombs speciation samplers (Brown et al. Citation2008). All samplers used dual-stage polyurethane foam impaction surfaces to remove particles above the relevant particle diameter (2.5 or 10 µm). The capacity of the polyurethane foam impaction surface is 35 mg of PM, which makes it possible to collect particles in challenging desert environments (dust storm and extreme temperature conditions). With slight differences in configuration, these impactor-type samplers were used to obtain PM10 and PM2.5 samples for mass and organics analyses on Teflon filters (37-mm Teflo, 2-μm pore; Pall Life Sciences, Ann Arbor, MI), and EC/OC samples on prefired quartz filters (37-mm quartz fiber, Sunset Laboratory, Inc., Tigard, OR).
Gravimetric analysis
All PM10 and PM2.5 Teflon filters were weighed (pre and post sampling) at the Harvard School of Public Health using a Mettler MT-5 microbalance to determine mass concentrations. Particle mass concentrations were determined using gravimetric analysis in a temperature- and humidity-controlled weighing room (temperature: 20–23°C; relative humidity: 40 ± 5%). The filters were left to equilibrate for 24 hr before the initial weighing and 48 hr before post-sampling weighing. All Teflon filters were refrigerated immediately after collection to minimize semivolatile particle losses. A correction of 4 µg was applied for every 1 mm Hg change in barometric pressure between the pre- and post-sampling weighing sessions (Brown et al. Citation2008).
EC/OC analysis
The EC and OC fractions in both PM2.5 and PM10 samples were quantified using a Desert Research Institute (DRI) model 2001 carbon analyzer (Atmoslytic, Inc., Calabasas, CA). The IMPROVE-A thermal/optical reflectance (TOR) protocol was used for the analyses. The detailed analytical approach has been described in Chow et al. (Citation2007).
Organics analysis
The analytical cleanup and fractionation procedure for the determination of PM-bound PAH and aliphatic (n-alkanes, hopanes, and steranes) fractions has been described in detail elsewhere (Mandalakis et al. Citation2002; Tsapakis and Stephanou Citation2005). Briefly, each Teflon filter, after the removal of the polyethylene ring, was spiked with a mixture of perdeuterated surrogates (d10-phenanthrene, d10-pyrene, d12-perylene, 5a,14a,17a-cholestane-d6, n-C16-d34, and n-C24-d50, in n-hexane), before extraction. The extraction of the organic content of each filter was carried out by sonication (3 times of each 15 min) in 1:1 hexane:dichloromethane mixture (Unisolv grade; Merck-Millipore), while the separation of the aliphatic/aromatic content was achieved by liquid–liquid partitioning, using n-pentane (Unisolv grade; Merck) and an equal volume of 5% water-deactivated N,N-dimethylformamide (DMF; Suprasolv grade; Merck). The aromatic fraction, containing all PAH compounds analyzed (36 alkylated and parent PAH members), after solvent exchange to n-hexane, followed by treatment with a known amount of nonactivated granular silica gel (Grade 60, Sigma Aldrich) and precleaned anhydrous Na2SO4 (EMSURE grade, Merck) into a microcolumn, in order to remove any water/DMF traces, was finally concentrated to approximately 0.5 mL and transferred to a 0.9-mL gas chromatography (GC) vial. The aliphatic fraction (25 n-alkanes, 17 hopanes, and 12 steranes) was further concentrated by using a gentle stream of pure nitrogen and transferred to a 0.9-mL GC vial. Prior to GC/mass spectrsocopy (MS) analysis, each fraction was spiked with a known amount of internal standard mixture (anthracene-d10), in order to assess the absolute recoveries of each compound class in every set of samples.
GC/MS analysis was carried out on an Agilent 6890N high-resolution gas chromatograph, equipped with a deactivated fused silica guard column (5 m, Restek, Bellefonto, PA), following by a 30 m × 0.25 mm ID × 0.25 μm film thickness fused silica column (Agilent J&W DP-5MS) and coupled with an Agilent 5973A inert mass-selective detector, operating in selective ion monitoring (SIM) mode. The chromatographic and mass spectrometric conditions were based on the study of Tsapakis and Stephanou (Citation2005) and Mandalakis et al. (Citation2002), with some modifications. PAH and aliphatic fractions were separately analyzed by performing on-column injections. The GC oven temperature program for the determination of PAHs was 50°C initial temperature (held for 1 min), first ramp to 150°C at 30°C/min, and second ramp to 300°C at 5°C/min (held for 20 min), while the corresponding oven program for aliphatic hydrocarbons was as follows: 50°C initial temperature (held for 1 min), ramp to 300°C at 5°C min−1, and finally maintained for 20 min.
Quality assurance and control (QA/QC)
The possible contamination during the collection and transportation of filter samples was evaluated by analyzing filter blanks and field blanks. The filters were transported by placing each filter in a taped shut petri dish. A batch of petri dishes was put into plastic bottles with foam spacers in between them (to prevent shock). Then the sets of plastic bottles wrapped with bubble wrap and sealed in zipped plastic bags were placed into a cooler with blue ice packs.
All concentration values were blank-corrected using the mean value of the field blanks for each pollutant. These values were 9.3 µg for PM10 and PM2.5 (n = 6) and 0.43 µg for EC and 17.4 µg for OC (n = 6). Data collected from duplicate samples (10% of collected samples) at the site exhibited excellent agreement, with regressions of duplicate pairs resulting in a coefficient of determination values (R2) greater than 0.95 and percent relative precision of about 10% for all measured pollutants as shown in Figures S1 and S2.
All organic solvents were of pesticide residue or organic trace analysis grade (SupraSolv/Unisolv, Merck). Precleaned petri dishes were used to store polytetrafluoroethylene (PTFE) filters before and after sampling, and prebaked glassware (in 420ºC for 3 hr) was twice rinsed with n-hexane before use, in order to eliminate any contamination. Relative response factors (RRF) were used for the quantification of each single analyte, for which their identification was performed via the retention time, mass fractionation, and co-injection of known standard mixtures (LGC standards; Chiron AS), while each RRF value was calculated according to (a) the predefined concentration of each analyte in the standard mixture and (b) the corresponding surrogate standard concentration. The reported blank corrected final concentrations were therefore consequently compensated automatically for losses during extraction and cleanup steps. For a set of five samples, three replicate GC/MS analyses of RRF solution were done simultaneously, and the average value of the RRF was used for the quantification of the target compounds. If the relative standard deviation (RSD) values of the RRF replicates were above 15%, the quantification results were not taken into account, and the analysis was repeated. Surrogate recoveries ranged between 75% (d10-phenanthrene) and 124% (d10-pyrene) for PAHs, from 77% (d34-n-C16) to 119% (d50-n-C24) for n-alkanes and from 99 to 123% for 5a,14a,17a-cholestane-d6. The reported results for each sample are blank-corrected values.
Results and discussion
Particulate mass and EC/OC concentrations
The 24-hr average PM2.5 and PM10 mass and associated EC and OC concentrations are summarized in . Daily variations of PM2.5 and PM10 mass, EC and OC concentrations during the sampling period (May to December 2015) are plotted in .
Table 1. Summary of 24-hr average PM2.5, PM10, EC, OC, and TCA mass concentrations (µg m−3) and concentration of organic compounds (ng m−3) in ambient air of Doha, Qatar.
Figure 2. Daily concentration of PM2.5 and PM10 mass and distribution of OC and EC in the daily particulate mass. Asterisks on bars indicate weekend days (Fridays only).
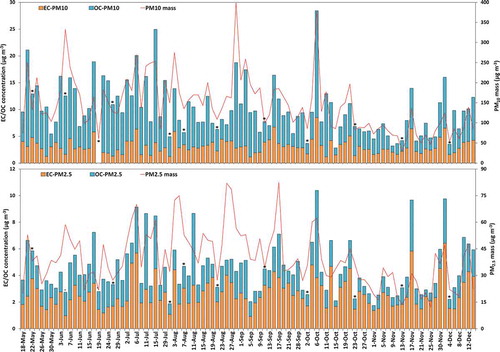
The 24-hr average PM2.5 mass concentration ranged from 12 to 82 µg m−3 (40 ± 15µg m−3 average concentration), while the PM10 corresponding concentration was 145 ± 70 µg m−3, ranging from 30 to 404 µg m−3 (). PM2.5 and PM10 concentrations in this study were lower than those measured at a remote site of Doha (average PM2.5 = 67 µg m−3 and PM10 = 165 µg m−3) during 2006–2007 (Engelbrecht et al. Citation2009). However, the measured concentrations were still often several times higher than the WHO standards of the 24-hr threshold of 25 µg m−3 for PM2.5 and 50 µg m−3 for PM10. The percentages of days with a 24-hr average PM2.5 and PM10 concentration higher than WHO standards were 82 and 96%, respectively. These results clearly indicated that the airborne PM pollution has been high in Doha, as in other areas of Middle East. It was also observed (Figure S3) that PM2.5 and PM10 have a weak correlation (R2 = 0.49), suggesting primary sources of PM2.5 and PM10 might be different. Fine particles could originate from local industrial and vehicular activities, while coarse particles could be marine aerosols, soil dust, and fugitive dust (Murillo et al. Citation2013; Pipal and Satsangi Citation2015). Furthermore, the average PM2.5/PM10 ratio was about 0.30, a typical value for sampling sites affected by the desert environment as reported in the Eastern Mediterranean (0.26) (Kocak, Mihalopoulos, and Kubilay Citation2007), Arizona, USA (0.28) (Mar et al. Citation2000), Jeddah, Saudi Arabia (0.33) (Khodeir et al. Citation2012) California, USA, (0.35) (Ostro, Broadwin, and Lipsett Citation2000), Negev Desert, Israel (0.35) (Andreae et al. Citation2002), and Kuwait (0.40) (Brown et al. Citation2008). However, higher PM2.5/PM10 ratio values were reported in typical urban sites like in Zhengzhou, China (0.66) (Wang et al. Citation2017), urban areas of Costa Rica (0.55–0.77) (Murillo et al. Citation2013), multiple urban sites of France (0.63), Italy (0.65), and the northeastern United States (0.54) (Sorek-Hamer et al. Citation2017), and across 20 European study areas (0.49–0.74) (Eeftens et al. Citation2012). The low value of this ratio indicates the dominance of coarser particles that are primarily associated with mineral/fugitive dust and marine aerosols (Kocak, Mihalopoulos, and Kubilay Citation2007; Murillo et al. Citation2013; Pipal and Satsangi Citation2015) in the arid Qatar Peninsula.
The daily average concentrations of EC and OC in both size PM fractions are presented in . EC concentrations varied from 0.69 to 6.41 µg m−3 with a mean of 2.61 ± 1.10 µg m−3 in PM2.5 and from 0.65 to 8.47 µg m−3 with an average of 3.00 ± 1.29 µg m−3 in PM10 (). Average concentrations of EC in both size fractions are higher than those previously reported by Engelbrecht et al. (Citation2009) at a remote site of Doha (1.70 and 1.97 µg m−3 in PM2.5 and PM10, respectively) and comparable to those measured at an urban site of Doha (2.83 and 2.91 µg m−3 in PM2.5 and PM10, respectively) (Saraga et al. Citation2017). Approximately 90% of EC was associated with PM2.5 (). EC in fine PM fraction likely originates from vehicle emissions and other combustion processes in the area, as significantly lower EC concentrations (1.90 µg m−3) were observed during weekend days (n = 12) as compared to weekdays (2.88 µg m−3, n = 93) as indicated in Figure S4.
EC in both PM fractions in the current study was found significantly higher compared to that in other urban sites such as in many cities across Europe (Jedynska et al. Citation2014; Oliveira et al. Citation2007), in Atlanta, GA (Yan et al. Citation2009), in six provinces of Veneto, Italy (Khan et al. Citation2016), in Mexico (Mancilla et al. Citation2016), in Los Angeles, CA (Heo et al. Citation2013; Shirmohammadi et al. Citation2016), in Incheon, Korea (Choi et al. Citation2012), and in Guangzhou, China (Wang et al. Citation2016b) (Table S2). Relatively higher EC concentration was found in other urban and semi-urban areas of China (Li et al. Citation2014; Wang et al. Citation2016a, Citation2015a), Pakistan (Stone et al. Citation2010), India (Li et al. Citation2014), and Iraq (Hamad et al. Citation2015).
The OC can either be directly emitted from primary sources, such as fossil fuel combustion, or produced via secondary formation processes (Murillo et al. Citation2013; Wang et al. Citation2015b). The average values for OC in PM2.5 and PM10 size fractions are 1.78 ± 1.14 µg m−3 and 6.97 ± 4.22 µg m−3 in the study area, respectively (). In this study, OC levels in PM10 are also found relatively higher compared to those reported by Engelbrecht et al. (Citation2009) at a remote site outside of Doha and lower than those measured at an urban site (Saraga et al. Citation2017). OC and EC in both size fractions were poorly correlated to each other, as shown in Figure S3. However, EC has a significant correlation with PM2.5 size fraction, and OC is strongly correlated with PM10 (Figure S5), suggesting uncommon primary sources of PM2.5 and PM10 fractions. These results also indicate different sources of EC and OC. While EC could mostly be associated with traffic emissions, OC could also have contributions from nontraffic sources such as secondary OC, biogenic, natural soil, and fugitive dust (Khan et al. Citation2016; Murillo et al. Citation2013; Yu et al. Citation2004; Zhou et al. Citation2016). Moreover, the PM2.5_OC/PM10_OC ratio (0.30) is about the same as the PM2.5/PM10 mass ratio. In other words, the mass fraction of OC is about the same in PM2.5 and PM2.5–10.
In our study, the measured concentration of OC was comparatively high as compared to reported values from other urban and semi-urban areas worldwide, such as at multiple urban sites across Europe (Jedynska et al. Citation2014; Oliveira et al. Citation2007), in six provinces of Veneto, Italy (Khan et al. Citation2016), and in Los Angeles, CA (Heo et al. Citation2013; Shirmohammadi et al. Citation2016) (Table S2). Relatively higher OC levels were reported in other urban and semi-urban areas of China (Li et al. Citation2014; Wang et al. Citation2016a, Citation2015a), Korea (Choi et al. Citation2012), Pakistan (Stone et al. Citation2010), India (Li et al. Citation2014), and Iraq (Hamad et al. Citation2015).
The OC/EC ratio of PM2.5 was significantly (p < 0.001) lower as compared to that of PM10 (0.76 ± 0.61 and 2.70 ± 2.08 average value, respectively), but the variation was large (0.55–9.87). In general, an OC/EC ratio exceeding 2.0 is an indicator of secondary organic carbon (SOC) formation in the atmosphere (Murillo et al. Citation2013; Wang et al. Citation2015b). The lower OC/EC ratio in PM2.5 should be the result of both higher mass fraction of EC in fine particles and the volatilization of fine particulate OC because of the high temperatures in Qatar (Brown et al. Citation2008). High OC/EC ratios in PM10 may be because of scavenging of ultrafine SOC by larger aerosol particles and condensation/adsorption of gaseous organic compounds on fine particles, producing grain size growth to larger particles (Bi et al. Citation2005; Pipal and Satsangi Citation2015). High air temperature and solar radiation throughout the year in the region would facilitate such reactions and conversions (Wang et al. Citation2015b). High contents of OC in coarse PM might have originated from biogenic (plant debris), natural soil, and fugitive dust emissions (Bi et al. Citation2005).
The minimum of OC/EC ratios can be used to estimate SOC concentrations in the PM samples, as proposed by Castro et al. (Citation1999). The levels of SOC can be determined as follows:
Using eq 1, the SOC was found to be 60 ± 20% and 68 ± 21% of the total OC in PM2.5 and PM10 mass, respectively. This is in agreement with SOC percentages to OC in urban areas found in other studies (Khan et al. Citation2016; Murillo et al. Citation2013; Yu et al. Citation2004; Zhou et al. Citation2016). However, there is high uncertainty associated with this SOC calculation method by using minimum OC/EC ratio, as it does not consider the variability of primary sources and noncombustion OC associated with EC, which is mainly of biogenic and fugitive origin (Castro et al. Citation1999; Khan et al. Citation2016). The SOC concentrations might be the result of more intensive gas-to-particle conversions of gas-phase compounds due to favorable meteorological conditions (most likely in higher temperatures and solar radiations) and the occurrence of photochemical reactions in the area (Murillo et al. Citation2013; Pipal and Satsangi Citation2015). The presence of SOC might also explain the high proportion of unexplained OC fractions in this study, as suggested by Yu et al. (Citation2004).
Moreover, total carbonaceous aerosol (TCA) concentrations were calculated in the airborne PM samples by using eq 2 proposed by Turpin and Lim (Citation2001):
The concentration of TCA was 5.56 ± 2.5 µg m−3 in PM2.5 and 14.02 ± 7.2 µg m−3 in PM10 (). The percentages of TCA contents in PM2.5 and PM10 were about 14% and 10% of particulate mass, respectively. Compared to other urban locations worldwide, the measured TCA contents were relatively similar to those reported by Zhang et al. (Citation2012) in Tongyu, China (8–17%), by Panda et al. (Citation2015) in Delhi, India (15%), and by Zhou et al. (Citation2016) in four cities of China (16–23%), but lower than those measured in Zhengzhou, China (30–32%) (Wang et al. Citation2017), in Sanya, China (32%) (Wang et al. Citation2015b), in six cities of Italy (32–47%) (Khan et al. Citation2016), in Pune, India (57–61%) (Pipal and Satsangi Citation2015), and at nine municipalities of Costa Rica (35–56%) (Murillo et al. Citation2013). Thus, location-specific measurements affected the percentage contribution of TCA to the PM composition, driven by local and remote sources. The low percentage of TCA calculated in the current study suggests that aerosols in the studied area have a higher relative abundance of mineral dust, sea salts, and water-soluble ions.
Organic compounds bound to PM2.5/PM10
PAH concentrations
Particle-bound PAHs, which are well known to be health toxic and carcinogenic, are major by-products of incomplete combustion of fossil fuels and biomass. PAHs of low molecular weights having two or three aromatic rings (e.g., naphthalene, Acenaphthylene, Acenaphthene, and Fluorene) are found preferentially in the gaseous phase and are undetected in particulate mass, while those with higher molecular weights (four to six aromatic rings) are mostly adsorbed onto the surface of suspended particles (Zhang et al. Citation2016), and only later were measured in this study.
In total, 36 PAH species were measured in both PM2.5 and PM10 samples. Their abbreviations, concentrations, and ratios of fine to coarse particles are presented Table S1. The total concentrations of PM2.5-PAHs (∑36PAHs) over the entire study period ranged between 0.134 and 2.439 ng m−3 (0.562 ± 0.54 ng m−3 average concentration), and PM10-PAHs varied from 0.193 to 2.849 ng m−3 with an average of 0.721 ± 0.598 ng m−3 (). Concentration levels of individual PAHs, as well as their proportion to the total PAH in both PM size fractions, are illustrated in . Furthermore, daily concentration levels of total PAHs are also presented in Figure S6. Two highest PM-PAH pollution events within our study were observed: one in summer on July 15, 2015 (2.44 and 2.47 ng m−3 in PM2.5 and PM10), and the other in winter on November 17, 2015 (2.43 and 2.85 ng m−3 in PM2.5 and PM10), having PAHs concentrations four times higher than the overall average (Figure S6).
Figure 3. Concentration of PAHs, n-alkanes, hopanes, and steranes in PM2.5 and PM10.
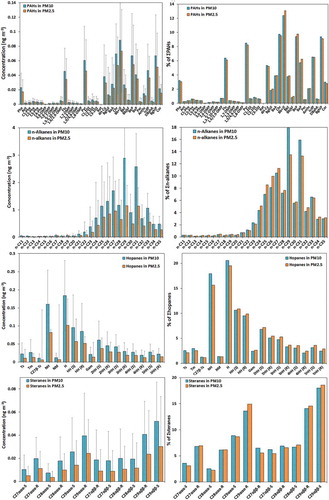
Benzo[b + j]fluoranthene (Bb + jF) was the most abundant PAH member in both fine and coarse particles (0.073 and 0.088 ng m−3 average concentration), accounting for 13.1% and 12.5% of ΣPAHs in PM2.5 and PM10, respectively (). Among the other quantified PAHs, chrysene (Chr), benzo[e]pyrene (BeP), benzo[ghi]perylene (BghiP), and pyrene (Pyr) were the most abundant ones that are likely to be of pyrolytic origin from vehicular emissions (Mikuška, Křůmal, and Večeřa Citation2015; Zhang et al. Citation2016). Weekly patterns of concentrations in this study showed a statistically significant (p < 0.01) difference in PAH concentrations when comparing weekdays (n = 30) and weekends (n = 4), with higher levels during weekdays (Figure S4), indicating a considerable contribution from vehicular activities in the area (Sanchez-Soberon et al. Citation2016). The nondetection in particulate samples of PM2.5 and PM10 samples of retene (Ret), a PAH that is mostly formed by thermal degradation of resin compounds in wood and plant, and has been proposed as a tracer for conifer combustion sources and can occur in both gas and particulate phases of the atmosphere (Simoneit et al. Citation2004), suggests either the lack of wood/biomass combustion emissions in the area (El-Mubarak et al. Citation2014), or that it may be virtually all in gas phase (and not measured in this study) due to the elevated temperatures observed in the study area.
ΣPAHs measured in both aerosol fractions in the current study were found significantly lower compared to those in other urban and semi-urban sites in the broader Middle East, such as in Iraq (Ahmed et al. Citation2015; Hamad et al. Citation2015), Saudi Arabia (Alghamdi et al. Citation2015; Bian et al. Citation2016; Rushdi et al. Citation2017), and Iran (Hoseini et al. Citation2016) (Table S2), as well as in other areas worldwide, such as in Egypt (Abdallah and Atia Citation2014; Hassan and Khoder Citation2012), Iran (Halek, Kianpour-Rad, and Kavousi Citation2008), Kashmir (Huma, Yadav, and Attri Citation2016), Pakistan (Stone et al. Citation2010), India (Li et al. Citation2014), Korea (Choi et al. Citation2012, Citation2016), China (Li et al. Citation2014; Wang et al. Citation2016a, Citation2016b, Citation2015a), and Italy (Cincinelli et al. Citation2007) (Table S2). On the contrary, we observed ΣPAH concentrations relatively similar to those measured at an urban and semi-urban site in Los Angeles, CA (Heo et al. Citation2013; Shirmohammadi et al. Citation2016), at industrial and rural locations in northern Lebanon (Melki et al. Citation2017), in suburban/rural areas of Spain (Pindado et al. Citation2009) and Atlanta, GA (Yan et al. Citation2009), at a downtown site in Mexico during spring (Mancilla et al. Citation2016), and in urban traffic/background sites in many cities across Europe (Jedynska et al. Citation2014; Oliveira et al. Citation2007) (Table S2).
Additionally, it was observed that PAHs in the current study are mainly associated with the PM2.5 size fraction (PM2.5-PAHs/PM10-PAHs: 0.80, ), with the remaining 20% of their total mass bound to airborne PM with an aerodynamic diameter larger than 2.5 μm (PM2.5–10). This favored partition to fine fraction (≤PM2.5) could originate from the relatively high adsorption of PAHs on the smaller particles’ surfaces, due to their higher surface area, lower water content (lower polarity), and sufficiently longer residence time in the air (Bi et al. Citation2005; Manoli, Voutsa, and Samara Citation2002). Moreover, the dominance of PAHs in fine particles is attributed to their direct emission from combustion processes (Sanchez-Soberon et al. Citation2016; Sarti et al. Citation2017). Previous investigations on the size distribution of particle-bound PAHs also revealed strong accumulation (80 to 95%) of PAHs on fine aerosol fractions (1–3 μm) as compared to coarse (3–10 μm) particles (Bi et al. Citation2005; Manoli, Voutsa, and Samara Citation2002; Sarti et al. Citation2017).
According to the properties of the target PAHs, they can be categorized into three-ring (Phe, Ant, Ret), four-ring (Flu, Pyr, BaA, Chr), five-ring (BghiF, Bb + jF, BkF, BbjkF, BeP, BaP, Per, Anthr), and six-ring PAHs (IcdP, BghiP, Cor) (Zhang et al. Citation2016). In this study, as expected, the atmospheric mass distribution of the particle-bound PAHs was dominated by five-ring compounds accounting for 44% of the total PAHs, followed by four-ring (30%), six-rings (19%), and lowest of three-ring PAH (7%), with almost similar distribution in both PM2.5 and PM10 fractions. Wang et al. (Citation2014) reported that two- and three-ring PAHs are mostly generated from the pyrolysis of unburned fossil fuel, while four-ring PAHs were abundant in coal combustion and biomass burning. Furthermore, five- and six-ring PAHs mainly originated from high-temperature combustion processes, such as gasoline and diesel vehicle exhaust (Ravindra, Sokhi, and Van Grieken Citation2008). Also, the low percent contribution (7%) of three-ring PAHs (i.e., Phe, Ant, Ret) indicates that PAHs in the collected samples were likely exposed to atmospheric aging and partitioning between gas and particulate phase under prevailing warm and humid climatic conditions (Sanchez-Soberon et al. Citation2016).
n-Alkane concentrations
Alkanes are one of the most abundant and ubiquitous organic compound groups in the environment. Twenty-five n-alkane compounds (n-C11–n-C35) bound to PM were quantified in this study. The average concentration of total target n-alkanes was 8.04 ± 7.74 ng m−3 within a range of 1.37–41.84 ng m−3 in PM2.5 and 15.29 ± 10.8 ng m−3 ranging from 2.68 to 57.80 ng m−3 in PM10 (). shows the average concentration of individual n-alkanes and their proportion to the total n-alkanes in both size fractions. Moreover, daily concentrations of total n-alkanes are also presented in Figure S6.
The concentrations of long-chain n-alkanes (>C25) were significantly higher than for the short-chain ones (). The concentrations of higher carbon number (n-C25 to n-C35) accounted for 90% on average of the total analyzed n-alkanes in this study. The distribution profiles of individual n-alkanes showed a predominance of odd carbon numbered congeners (C27, C29, and C31), indicating contributions from plants’ leaf wax and other vegetation-related mixed sources like road dust and fugitive dust (Rogge et al. Citation1993; Yadav, Tandon, and Attri Citation2013). The carbon number with a maximum concentration among the target n-alkanes (Cmax) was C29, followed by C31, in both PM collected fractions. Cmax at C29 is a marker of road dust, containing accumulated vehicular emissions and surface deposited plant detritus, while C31 indicates emissions arising from leaf abrasion products (Yadav, Tandon, and Attri Citation2013). It is pertinent to note that n-alkanes are almost equally partitioned in both size fraction masses, having an average PM2.5/PM10 ratio of 0.53.
In general, n-alkane concentrations in the current study were significantly lower than those measured in other urban and semi-urban areas, such as Baghdad (Hamad et al. Citation2015), Dhahran (Rushdi et al. Citation2017), Lahore (Stone et al. Citation2010), Srinagar (Huma, Yadav, and Attri Citation2016), and New Delhi (Li et al. Citation2014), as well as in other urban areas in China (Li et al. Citation2014; Wang et al. Citation2016a, Citation2016b, Citation2015a) and Korea (Choi et al. Citation2012, Citation2016) (Table S2). In contrast, concentrations similar to those measured in the current study were found in suburban and rural areas in Spain during spring and summer (Pindado et al. Citation2009), and in Atlanta, GA (Yan et al. Citation2009), Bouira Province in Algeria (Khedidji et al. Citation2017), central Los Angeles, CA (Shirmohammadi et al. Citation2016), and northern Lebanon (Melki et al. Citation2017), while relatively higher levels of particulate n-alkanes were observed in Los Angeles, CA (Heo et al. Citation2013), Monterrey (Mancilla et al. Citation2016), and Prato (Cincinelli et al. Citation2007) (Table S2).
Hopane and sterane concentrations
Concentrations of hopanes and steranes, which are indicators of petrogenic emissions in the urban areas (Sanchez-Soberon et al. Citation2016; Simoneit et al. Citation2004), are summarized in . They are typically resistant to degradation in the atmosphere and therefore can be used as markers for source identification of organic aerosols (Rushdi et al. Citation2017; Wang et al. Citation2016a). The total concentrations of the measured hopanes (∑17 hopanes) ranged from 0.081 to 3.86 ng m−3 (mean = 0.521 ± 0.677 ng m−3) in PM2.5 and 0.160 to 4.94 ng m−3 (mean = 0.893 ± 0.880 ng m−3) in PM10. However, the total measured steranes (∑12 steranes) in these PM samples had lower ranges from 0.022 to 1.385 ng m−3 (mean = 0.162 ± 0.250 ng m−3) and 0.047 to 1.771 (mean = 0.289 ± 0.322 ng m−3) in PM2.5 and PM10, respectively.
Overall, fine and coarse hopanes/steranes concentrations in the present study were found lower compared to other studies in the Middle East (Table S2). The highest levels were observed at urban sites in Pakistan (Stone et al. Citation2010) and Saudi Arabia (Rushdi et al. Citation2017), as well as in other areas in India and China (Li et al. Citation2014). Relatively higher hopanes/steranes concentrations were also found in other urban and semi-urban sites in China (Wang et al. Citation2016b), Mexico (Mancilla et al. Citation2016), and elsewhere in Europe (Jedynska et al. Citation2014) (Table S2). However, the PM10-bound hopanes/steranes levels in the current study were similar to those observed in Los Angeles, CA (Heo et al. Citation2013; Shirmohammadi et al. Citation2016), Atlanta, GA (Yan et al. Citation2009), and Incheon, Korea (Choi et al. Citation2012) (Table S2).
Hopanes and steranes are abundant in crude petroleum and are enriched in lubricating oil of engines from diesel- and gasoline-powered motor vehicles, and their presence confirms contribution from fossil fuel combustion in the region (Li et al. Citation2014; Rushdi et al. Citation2017; Sanchez-Soberon et al. Citation2016; Simoneit et al. Citation2004). Both hopanes and steranes also showed a strong linear correlation with PAHs (R2 = 0.64 in PM2.5 and R2 = 0.74 in PM10; see Figure S7). Comparing weekday and weekend patterns (Figure S4), statistically significant differences (p < 0.01) were found in the concentrations of hopanes and steranes, further confirming the contribution from vehicular emissions. Fugitive fuel emissions, waste burning, and petroleum refinery activities are also potential sources for a significant amount of petroleum product inputs to the atmosphere in urban areas (Rushdi et al. Citation2017).
The dominant homologues of hopanes had the thermodynamically more stable 17α(H), 21β(H) configuration with a predominance of the 17α(H), 21β(H)-hopane (C30αβ; 20% of total hopanes) compound, followed by 17α(H), 21β(H)-norhopane (C29αβ; 17%)—a trace of motor vehicle exhaust (Mikuška, Křůmal, and Večeřa Citation2015; Wang et al. Citation2016a). The hopane with the lowest concentration was the 17β(H), 21α(H) homologue, contributing to only 1% of the total hopanes. The distribution of hopanes shows that the 17α(H), 21β(H)-hopane series, ranging from C27 to C35 (except the C28 homologue), is the most abundant series, with the fully mature configuration for the homologues >C31 present as C22 R/S pairs (Simoneit et al. Citation2004). The higher concentrations of the 22S hopane relative to the corresponding 22R pairs also indicate that they are mostly originated from gasoline and diesel engine exhaust (Rushdi et al. Citation2017; Wang et al. Citation2016a). A series of sterane detected in the PM samples ranged from C27 to C29 with a predominance of the C29-5α,14β,17β (32% of ∑12steranes) and minor of C28-5α,14α,17α (8%) configurations, both occurring as 20S and 20R epimers. These specific compounds and their ratios have been extensively used in literature as biomarkers to identify hydrocarbons sources. The results of source apportionment analysis are presented in our companion paper.
Seasonal variations
Seasonal variability of the measured pollutants in both sized fractions is presented in Figure S9. Higher concentrations of organic species (sum of PAHs, n-alkanes, and hopanes/steranes) in both PM fractions were measured in winter months (November, December) than in summer months. Higher levels of PM mass were reported in summer months (June, July) as compared to colder months. Likewise, total OC was also found higher in warmer months, suggesting the presence of higher secondary OC concentration as a result of the photochemical transformations in these hot and sunny months. These seasonal variations of OC prove that more secondary organic aerosol was formed in the summer, while there was no distinct seasonal variation observed in the EC concentrations. Similar to our study, high levels of organic species were often observed in winter periods in other studies (Wang et al. Citation2015b, Citation2017; Zhang et al. Citation2016), because of the meteorological conditions (such as lower boundary layer height and lower horizontal wind speed), and thus cause pollutant accumulation.
The concentration and composition of organic aerosols are dependent on sources, atmospheric conditions, gas-to-particle partitioning, transport processes, and deposition (Choi et al. Citation2016). Despite the presence of higher EC and OC concentrations, the average concentrations of organic species found in this study are mostly lower as compared to those reported in other cities in the region and around the world (see the comparison in Table S2). These low levels of measured organic compounds in the area might be related to its arid climate that is characterized by high air temperature and solar radiation throughout the year, strong winds, and thicker mixing layers, which favor the dispersion of polluting agents and atmospheric photochemical degradation, thus contributing to lower levels of organics. High temperatures and solar radiations occurring in the area also facilitate the transfer of semivolatile organic compounds from the particulate to the gas phase. Moreover, oxidizing agents such as ozone, nitrogen oxides, hydrogen peroxide, and free radicals can react with organic compounds, converting them to secondary aerosols in air, while these reactions are generally more pronounced in warm and humid climates such as that of the study area (Alves et al. Citation2014; Yadav, Tandon, and Attri Citation2013). Thus, the low levels of measured organic species indicate the prevalence of photochemical processes and formation of secondary aerosols as found in this study, such that about 60–68% of OC was present in the form of SOC.
Polar scatter plots
In this study, polar scatter plots were also created () to show the dependence of pollutant concentrations on both wind speed and direction in polar coordinates and to get directional information of potential pollution sources. Each polar plot represents four dimensions: dot color (pollutant concentration), dot size (concentration ratio in PM2.5/PM10), wind direction on the angular axis, and wind speed on the radial scale (Grange, Lewis, and Carslaw Citation2016).
Figure 4. Polar plots of various source tracer species in PM as a function of wind speed (WS) and wind direction (WD). The dot color represents the pollutant concentration, and dot size shows the concentration ratio of PM2.5/PM10.
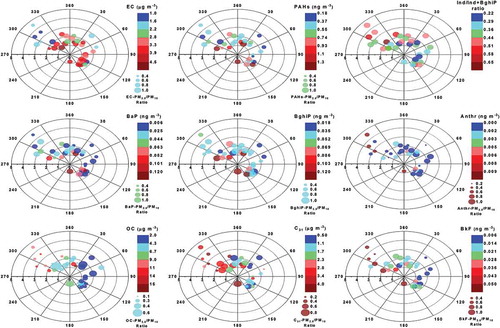
As seen in , EC and total PAHs, which are primary indicators of vehicular exhausts, are primarily associated with fine particles, as indicated by the higher PM2.5/PM10 ratios. Their higher concentrations were mostly from local sources, as occurred under low wind speed (<2 m sec−1) conditions, independent of wind direction. Stronger winds (>2 m sec−1), mostly from the prevailing northwest direction, resulted in significantly lower concentrations of these pollutants (). Similarly, BaP and BghiP (tracers of gasoline and diesel exhausts, respectively) were also associated with fine particles and had elevated concentrations at low wind speeds, suggesting that local traffic might be the primary source of these pollutants. The dominance of EC and PAHs in fine particles is attributed to their direct emission from combustion processes (Sanchez-Soberon et al. Citation2016; Sarti et al. Citation2017). In higher wind speed conditions, dilution and further dispersion of these pollutants are favored and hence their concentrations would be lower. High or low levels of these pollutants with southeast winds at the similar wind speed levels were because of the seasonal and weekend/weekday variations. Moreover, lower values of Ind/Ind + BghiP ratios (<0.44), signifying vehicular exhaust emissions, were also associated with low-speed winds and mostly from southeast directions from urban areas. These suggest that distinct local sources related to vehicular activities were primarily responsible for these organic pollutants observed at the site.
In contrast, OC, 60–68% of which is in the form of SOC, is highly dependent on wind direction (), suggesting that the OC sources are not local. Higher concentrations of OC were experienced with predominant northwesterly winds when wind speeds were high, indicating the influence of remote sources (e.g., biogenic and petroleum refineries) and long-range transport of organic aerosols. Also, high wind speed may lead to higher resuspension of local mineral/fugitive dust, which might also be responsible for the higher concentration of OC, as discussed earlier. OC is predominantly associated with coarse particles. The same trend was observed in case of n-C31 alkane, a tracer of plant waxes (Wang et al. Citation2016a), suggesting the contribution of biogenic sources related to long-distance sources in the prevailing-wind direction. The elevated concentrations of Ant (an indicator of petroleum source; Yunker et al. Citation2002) and BkF (indicative of regional transport; Wang et al. Citation2016b) were also associated with mostly high-speed winds blowing from the prevailing wind direction (northwest) and showed predominance in the coarse mode fraction, suggesting long-distance petrogenic (petroleum refineries located northwest of the sampling area) and biogenic sources.
Thus, it was found that local vehicular and fugitive emissions were predominant during low-speed southeasterly winds from urban areas, while remote petrogenic/biogenic emissions were particularly significant under prevailing northwesterly wind conditions.
Conclusion
In this study, EC, OC, and 90 individual organic compounds, grouped into PAHs, n-alkanes, hopanes, and steranes, were measured in PM2.5 and PM10 filter samples collected in Doha, Qatar, aiming to establish concentration profiles of these pollutants in the area. The PM2.5 and PM10 mass concentrations were several times higher than the WHO standards. A main proportion of EC (90%) was associated with fine PM2.5 particles, while about 70% of OC was present in the coarse size fraction of PM. Additionally, TCA contents in atmospheric aerosols were in the range of 10 to 14% of PM mass. Among the measured organic compounds in the aerosol samples, n-alkanes were the most abundant group, followed by PAHs, hopanes, and steranes, while the concentrations of the long-chain homologues (n-C25 to n-C35) accounted for about 90% of the total analyzed n-alkane series, with a predominance of odd carbon numbered congeners (C27–C31). High-molecular-weight PAHs (five and six rings) accounted for 63% of the total measured PAHs, related to a PAH profile characteristic of an urban environment. PAHs were mainly associated (80%) with PM2.5 as compared to PM2.5–10. The dominance of EC and PAHs in fine particles is attributed to their direct emissions from combustion sources, signifying potential public health concerns. The hopane and sterane tracers also indicated the contribution of fugitive petroleum emissions (fuel stations, vehicles, and refineries). Two pollution episodes were observed during the sampling period, which resulted in three to six times higher concentrations of the measured organic pollutants over this megacity. The dependence of pollutants concentrtions on wind speed and direction suggests their significant temporal and spatial variability in the area, indicating the present of opportunities for improving the air quality by reducing levels of airborne pollutants.
Supplemental Material
Download PDF (1.8 MB)Acknowledgment
The authors are grateful to Qi Ying from Zachry Department of Civil Engineering, Texas A&M University, College Station, TX, for his constructive comments that significantly improved the paper quality, and to Benjamin Figgis from the Qatar Energy and Environment Institute, Hamad Bin Khalifa University, for technical assistance in setting up the sampling station. The statements made herein are solely the responsibility of the authors.
Supplemental data
Supplemental data for this paper can be accessed on the publisher’s website.
Additional information
Funding
Notes on contributors
Wasim Javed
Wasim Javed is an assistant research scientist in the Mechanical Engineering Program at Texas A&M University at Qatar, Doha, Qatar.
Minas Iakovides
Minas Iakovides is a researcher in the Department of Chemistry, University of Crete, Heraklion, Greece, and The Cyprus Institute, Aglantzia, Republic of Cyprus.
Euripides G. Stephanou
Euripides G. Stephanou is a professor in the Department of Chemistry, University of Crete, Heraklion, Greece, and The Cyprus Institute, Aglantzia, Republic of Cyprus.
Jack M. Wolfson
Jack M. Wolfson is a researcher at Department of Environmental Health, Harvard T.H. Chan School of Public Health, Boston, MA.
Petros Koutrakis
Petros Koutrakis is a professor of environmental sciences in the Department of Environmental Health, Harvard T.H. Chan School of Public Health, Boston, MA.
Bing Guo
Bing Guo is an assistant professor in the Mechanical Engineering Program at Texas A&M University at Qatar, Doha, Qatar.
Related Research Data
References
- Abdallah, M. A., and N. N. Atia. 2014. Atmospheric concentrations, gaseous-particulate distribution, and carcinogenic potential of polycyclic aromatic hydrocarbons in Assiut, Egypt. Environ. Sci. Pollut. Res. 21 (13):8059–8069. doi:10.1007/s11356-014-2746-6.
- Ahmed, T. M., B. Ahmed, B. K. Aziz, C. Bergvall, and R. Westerholm. 2015. Native and oxygenated polycyclic aromatic hydrocarbons in ambient air particulate matter from the city of Sulaimaniyah in Iraq. Atmos. Environ. 116:44–50. doi:10.1016/j.atmosenv.2015.06.020.
- Alghamdi, M. A., M. S. Alam, J. Yin, C. Stark, E. Jang, R. M. Harrison, M. Shamy, M. I. Khoder, and I. I. Shabbaj. 2015. Receptor modelling study of polycyclic aromatic hydrocarbons in Jeddah, Saudi Arabia. Sci. Total Environ. 506–507:401–408. doi:10.1016/j.scitotenv.2014.10.056.
- Alves, C., T. Nunes, A. Vicente, C. Goncalves, M. Evtyugina, T. Marques, C. Pio, and F. Bate-Epey. 2014. Speciation of organic compounds in aerosols from urban background sites in the winter season. Atmospheric Res. 150:57–68. doi:10.1016/j.atmosres.2014.07.012.
- Andreae, T. W., M. O. Andreae, C. Ichoku, W. Maenhaut, J. Cafmeyer, A. Karnieli, and L. Orlovsky. 2002. Light scattering by dust and anthropogenic aerosol at a remote site in the Negev desert, Israel. J. Geophys. Res. 107 (D2):4008. doi:10.1029/2001jd900252.
- Bi, X. H., G. Y. Sheng, P. Peng, Y. J. Chen, and J. M. Fu. 2005. Size distribution of n-alkanes and polycyclic aromatic hydrocarbons (PAHs) in urban and rural atmospheres of Guangzhou, China. Atmos. Environ. 39 (3):477–487. doi:10.1016/j.atmosenv.2004.09.052.
- Bian, Q. J., B. Alharbi, J. Collett, S. Kreidenweis, and M. J. Pasha. 2016. Measurements and source apportionment of particle-associated polycyclic aromatic hydrocarbons in ambient air in Riyadh, Saudi Arabia. Atmos. Environ. 137:186–198. doi:10.1016/j.atmosenv.2016.04.025.
- Brown, K. W., W. Bouhamra, D. P. Lamoureux, J. S. Evans, and P. Koutrakis. 2008. Characterization of particulate matter for three sites in Kuwait. J. Air Waste Manage. Assoc. 58 (8):994–1003. doi:10.3155/1047-3289.58.8.994.
- Cassee, F. R., M. E. Heroux, M. E. Gerlofs-Nijland, and F. J. Kelly. 2013. Particulate matter beyond mass: Recent health evidence on the role of fractions, chemical constituents and sources of emission. Inhal. Toxicol. 25 (14):802–812. doi:10.3109/08958378.2013.850127.
- Castro, L. M., C. A. Pio, R. M. Harrison, and D. J. T. Smith. 1999. Carbonaceous aerosol in urban and rural European atmospheres: Estimation of secondary organic carbon concentrations. Atmos. Environ. 33 (17):2771–2781. doi:10.1016/S1352-2310(98)00331-8.
- Choi, J. K., J. B. Heo, S. J. Ban, S. M. Yi, and K. D. Zoh. 2012. Chemical characteristics of PM2.5 aerosol in Incheon, Korea. Atmos. Environ. 60:583–592. doi:10.1016/j.atmosenv.2012.06.078.
- Choi, N. R., S. P. Lee, J. Y. Lee, C. H. Jung, and Y. P. Kim. 2016. Speciation and source identification of organic compounds in PM10 over Seoul, South Korea. Chemosphere 144:1589–1596. doi:10.1016/j.chemosphere.2015.10.041.
- Chow, J. C., J. G. Watson, L. W. Chen, M. C. Chang, N. F. Robinson, D. Trimble, and S. Kohl. 2007. The IMPROVE_A temperature protocol for thermal/optical carbon analysis: Maintaining consistency with a long-term database. J. Air Waste Manage. Assoc. 57 (9):1014–1023. doi:10.3155/1047-3289.57.9.1014.
- Cincinelli, A., M. D. Bubba, T. Martellini, A. Gambaro, and L. Lepri. 2007. Gas-particle concentration and distribution of n-alkanes and polycyclic aromatic hydrocarbons in the atmosphere of Prato (Italy). Chemosphere 68 (3):472–478. doi:10.1016/j.chemosphere.2006.12.089.
- Eeftens, M., M.-Y. Tsai, C. Ampe, B. Anwander, R. Beelen, T. Bellander, G. Cesaroni, M. Cirach, J. Cyrys, K. de Hoogh, et al. 2012. Spatial variation of PM2.5, PM10, PM2.5 absorbance and PM coarse concentrations between and within 20 European study areas and the relationship with NO2 – Results of the ESCAPE project. Atmos. Environ. 62:303–317. doi:10.1016/j.atmosenv.2012.08.038.
- El-Mubarak, A. H., A. I. Rushdi, K. F. Al-Mutlaq, A. Y. Bazeyad, S. L. Simonich, and B. R. Simoneit. 2014. Identification and source apportionment of polycyclic aromatic hydrocarbons in ambient air particulate matter of Riyadh, Saudi Arabia. Environ. Sci. Pollut. Res. 21 (1):558–567. doi:10.1007/s11356-013-1946-9.
- Engelbrecht, J. P., E. V. McDonald, J. A. Gillies, R. Jayanty, G. Casuccio, and A. W. Gertler. 2009. Characterizing mineral dusts and other aerosols from the Middle East—Part 1: Ambient sampling. Inhal. Toxicol. 21 (4):297–326. doi:10.1080/08958370802464273.
- Grange, S. K., A. C. Lewis, and D. C. Carslaw. 2016. Source apportionment advances using polar plots of bivariate correlation and regression statistics. Atmos. Environ. 145:128–134. doi:10.1016/j.atmosenv.2016.09.016.
- Guo, B., W. Javed, B. Figgis, and T. Mirza. 2015. Effect of dust and weather conditions on photovoltaic performance in Doha, Qatar. Paper read at Smart Grid and Renewable Energy (SGRE), 2015 First Workshop on.
- Halek, F., M. Kianpour-Rad, and A. Kavousi. 2008. Characterization and source apportionment of polycyclic aromatic hydrocarbons in the ambient air (Tehran, Iran). Environ. Chem. Lett. 8 (1):39–44. doi:10.1007/s10311-008-0188-4.
- Hamad, S. H., J. J. Schauer, J. Heo, and A. K. H. Kadhim. 2015. Source apportionment of PM2.5 carbonaceous aerosol in Baghdad, Iraq. Atmospheric Res. 156:80–90. doi:10.1016/j.atmosres.2014.12.017.
- Hassan, S. K., and M. I. Khoder. 2012. Gas-particle concentration, distribution, and health risk assessment of polycyclic aromatic hydrocarbons at a traffic area of Giza, Egypt. Environ. Monit. Assess. 184 (6):3593–3612. doi:10.1007/s10661-011-2210-8.
- Heo, J. B., M. Dulger, M. R. Olson, J. E. McGinnis, B. R. Shelton, A. Matsunaga, C. Sioutas, and J. J. Schauer. 2013. Source apportionments of PM2.5 organic carbon using molecular marker Positive Matrix Factorization and comparison of results from different receptor models. Atmos. Environ. 73:51–61. doi:10.1016/j.atmosenv.2013.03.004.
- Hoseini, M., M. Yunesian, R. Nabizadeh, K. Yaghmaeian, R. Ahmadkhaniha, N. Rastkari, S. Parmy, S. Faridi, A. Rafiee, and K. Naddafi. 2016. Characterization and risk assessment of polycyclic aromatic hydrocarbons (PAHs) in urban atmospheric Particulate of Tehran, Iran. Environ. Sci. Pollut. Res. 23 (2):1820–1832. doi:10.1007/s11356-015-5355-0.
- Huma, B., S. Yadav, and A. K. Attri. 2016. Profile of particulate-bound organic compounds in ambient environment of Srinagar: A high-altitude urban location in the North-Western Himalayas. Environ. Sci. Pollut. Res. 23 (8):7660–7675. doi:10.1007/s11356-015-5994-1.
- Janahi, I. A., A. Bener, and A. Bush. 2006. Prevalence of asthma among Qatari schoolchildren: International study of asthma and allergies in childhood, Qatar. Pediatr. Pulmonol. 41 (1):80–86. doi:10.1002/ppul.20331.
- Javed, W., B. Guo, and B. Figgis. 2017. Modeling of photovoltaic soiling loss as a function of environmental variables. Solar Energy 157:397–407. doi:10.1016/j.solener.2017.08.046.
- Jedynska, A., G. Hoek, M. Eeftens, J. Cyrys, M. Keuken, C. Ampe, R. Beelen, G. Cesaroni, F. Forastiere, M. Cirach, et al. 2014. Spatial variations of PAH, hopanes/steranes and EC/OC concentrations within and between European study areas. Atmos. Environ. 87:239–248. doi:10.1016/j.atmosenv.2014.01.026.
- Khan, M. B., M. Masiol, G. Formenton, A. Di Gilio, G. de Gennaro, C. Agostinelli, and B. Pavoni. 2016. Carbonaceous PM2.5 and secondary organic aerosol across the Veneto region (NE Italy). Sci. Total Environ. 542:172–181. doi:10.1016/j.scitotenv.2015.10.103.
- Khedidji, S., C. Balducci, R. Ladji, A. Cecinato, M. Perilli, and N. Yassaa. 2017. Chemical composition of particulate organic matter at industrial, university and forest areas located in Bouira province, Algeria. Atmos. Pollut. Res. 8 (3):474–482. doi:10.1016/j.apr.2016.12.005.
- Khodeir, M., M. Shamy, M. Alghamdi, M. Zhong, H. Sun, M. Costa, L.-C. Chen, and P. Maciejczyk. 2012. Source apportionment and elemental composition of PM2.5 and PM10 in Jeddah City, Saudi Arabia. Atmos. Pollut. Res. 3 (3):331–340. doi:10.5094/APR.2012.037.
- Kocak, M., N. Mihalopoulos, and N. Kubilay. 2007. Contributions of natural sources to high PM10 and PM2.5 events in the eastern Mediterranean. Atmos. Environ. 41 (18):3806–3818. doi:10.1016/j.atmosenv.2007.01.009.
- Li, J., G. Wang, S. G. Aggarwal, Y. Huang, Y. Ren, B. Zhou, K. Singh, P. K. Gupta, J. Cao, and R. Zhang. 2014. Comparison of abundances, compositions and sources of elements, inorganic ions and organic compounds in atmospheric aerosols from Xi’an and New Delhi, two megacities in China and India. Sci. Total Environ. 476–477:485–495. doi:10.1016/j.scitotenv.2014.01.011.
- Liu, J., R. Man, S. Ma, J. Li, Q. Wu, and J. Peng. 2015. Atmospheric levels and health risk of polycyclic aromatic hydrocarbons (PAHs) bound to PM2.5 in Guangzhou, China. Mar. Pollut. Bull. 100 (1):134–143. doi:10.1016/j.marpolbul.2015.09.014.
- Mancilla, Y., A. Mendoza, M. P. Fraser, and P. Herckes. 2016. Organic composition and source apportionment of fine aerosol at Monterrey, Mexico, based on organic markers. Atmos. Chem. Phys. 16 (2):953–970. doi:10.5194/acp-16-953-2016.
- Mandalakis, M., M. Tsapakis, A. Tsoga, and E. G. Stephanou. 2002. Gas-particle concentrations and distribution of aliphatic hydrocarbons, PAHs, PCBs and PCDD/Fs in the atmosphere of Athens (Greece). Atmos. Environ. 36 (25):4023–4035. doi:10.1016/S1352-2310(02)00362-X.
- Manoli, E., D. Voutsa, and C. Samara. 2002. Chemical characterization and source identification/apportionment of fine and coarse air particles in Thessaloniki, Greece. Atmos. Environ. 36 (6):949–961. doi:10.1016/S1352-2310(01)00486-1.
- Mar, T. F., G. A. Norris, J. Q. Koenig, and T. V. Larson. 2000. Associations between air pollution and mortality in Phoenix, 1995-1997. Environ. Health Perspect. 108 (4):347–353. doi:10.2307/3454354.
- Melki, P. N., F. Ledoux, S. Aouad, S. Billet, B. El Khoury, Y. Landkocz, R. M. Abdel-Massih, and D. Courcot. 2017. Physicochemical characteristics, mutagenicity and genotoxicity of airborne particles under industrial and rural influences in Northern Lebanon. Environ. Sci. Pollut. Res. 24 (23):18782–18797. doi:10.1007/s11356-017-9389-3.
- Mikuška, P., K. Křůmal, and Z. Večeřa. 2015. Characterization of organic compounds in the PM2.5 aerosols in winter in an industrial urban area. Atmos. Environ. 105:97–108. doi:10.1016/j.atmosenv.2015.01.028.
- Murillo, J. H., J. F. R. Marin, S. R. Roman, V. H. B. Guerrero, D. S. Arias, A. C. Ramos, B. C. Gonzalez, and D. G. Baumgardner. 2013. Temporal and spatial variations in organic and elemental carbon concentrations in PM10/PM2.5 in the metropolitan area of Costa Rica, Central America. Atmos. Pollut. Res. 4 (1):53–63. doi:10.5094/Apr.2013.006.
- Oliveira, T. S., C. A. Pio, C. A. Alves, A. J. D. Silvestre, M. Evtyugina, J. V. Afonso, P. Fialho, M. Legrand, H. Puxbaum, and A. Gelencser. 2007. Seasonal variation of particulate lipophilic organic compounds at nonurban sites in Europe. J. Geophys. Res. 112:D23. doi:10.1029/2007jd008504.
- Ostro, B. D., R. Broadwin, and M. J. Lipsett. 2000. Coarse and fine particles and daily mortality in the Coachella Valley, California: A follow-up study. J. Expo. Sci. Environ. Epidemiol. 10 (5):412–419. doi:10.1038/sj.jea.7500094.
- Panda, S., S. K. Sharma, P. S. Mahapatra, U. Panda, S. Rath, M. Mahapatra, T. K. Mandal, and T. Das. 2015. Organic and elemental carbon variation in PM2.5 over megacity Delhi and Bhubaneswar, a semi-urban coastal site in India. Nat. Hazards. 80 (3):1709–1728. doi:10.1007/s11069-015-2049-3.
- Pindado, O., R. M. Perez, S. Garcia, M. Sanchez, P. Galan, and M. Fernandez. 2009. Characterization and sources assignation of PM2.5 organic aerosol in a rural area of Spain. Atmos. Environ. 43 (17):2796–2803. doi:10.1016/j.atmosenv.2009.02.046.
- Pipal, A. S., and P. G. Satsangi. 2015. Study of carbonaceous species, morphology and sources of fine (PM2.5) and coarse (PM10) particles along with their climatic nature in India. Atmospheric Res. 154:103–115. doi:10.1016/j.atmosres.2014.11.007.
- Pongpiachan, S., D. Tipmanee, C. Khumsup, I. Kittikoon, and P. Hirunyatrakul. 2015. Assessing risks to adults and preschool children posed by PM2.5-bound polycyclic aromatic hydrocarbons (PAHs) during a biomass burning episode in Northern Thailand. Sci. Total Environ. 508:435–444. doi:10.1016/j.scitotenv.2014.12.019.
- Ravindra, K., R. Sokhi, and R. Van Grieken. 2008. Atmospheric polycyclic aromatic hydrocarbons: Source attribution, emission factors and regulation. Atmos. Environ. 42 (13):2895–2921. doi:10.1016/j.atmosenv.2007.12.010.
- Rogge, W. F., L. M. Hildemann, M. A. Mazurek, G. R. Cass, and B. R. T. Simoneit. 1993. Sources of fine organic aerosol .3. road dust, tire debris, and organometallic brake lining dust - roads as sources and sinks. Environ. Sci. Technol. 27 (9):1892–1904. doi:10.1021/Es00046a019.
- Rushdi, A. I., A. H. El-Mubarak, L. Lijotra, M. T. Al-Otaibi, M. A. Qurban, K. F. Al-Mutlaq, and B. R. T. Simoneit. 2017. Characteristics of organic compounds in aerosol particulate matter from Dhahran city, Saudi Arabia. Arabian J. Chem. 10:S3532–S3547. doi:10.1016/j.arabjc.2014.03.001.
- Sanchez-Soberon, F., B. L. van Drooge, J. Rovira, J. O. Grimalt, M. Nadal, J. L. Domingo, and M. Schuhmacher. 2016. Size-distribution of airborne polycyclic aromatic hydrocarbons and other organic source markers in the surroundings of a cement plant powered with alternative fuels. Sci. Total Environ. 550:1057–1064. doi:10.1016/j.scitotenv.2016.01.059.
- Saraga, D., T. Maggos, E. Sadoun, E. Fthenou, H. Hassan, V. Tsiouri, S. Karavoltsos, A. Sakellari, C. Vasilakos, and K. Kakosimos. 2017. Chemical characterization of indoor and outdoor particulate matter (PM2. 5, PM10) in Doha, Qatar. Aerosol Air Qual. Res. 17:1156–1168. doi:10.4209/aaqr.2016.05.0198.
- Sarti, E., L. Pasti, I. Scaroni, P. Casali, A. Cavazzini, and M. Rossi. 2017. Determination of n-alkanes, PAHs and nitro-PAHs in PM2.5 and PM1 sampled in the surroundings of a municipal waste incinerator. Atmos. Environ. 149:12–23. doi:10.1016/j.atmosenv.2016.11.016.
- Sarver, T., A. Al-Qaraghuli, and L. L. Kazmerski. 2013. A comprehensive review of the impact of dust on the use of solar energy: History, investigations, results, literature, and mitigation approaches. Renew. Sust. Energ. Rev. 22:698–733. doi:10.1016/j.rser.2012.12.065.
- Shirmohammadi, F., S. Hasheminassab, A. Saffari, J. J. Schauer, R. J. Delfino, and C. Sioutas. 2016. Fine and ultrafine particulate organic carbon in the Los Angeles basin: Trends in sources and composition. Sci. Total Environ. 541:1083–1096. doi:10.1016/j.scitotenv.2015.09.133.
- Simoneit, B. R. T., M. Kobayashi, M. Mochida, K. Kawamura, M. Lee, H. J. Lim, B. J. Turpin, and Y. Komazaki. 2004. Composition and major sources of organic compounds of aerosol particulate matter sampled during the ACE-Asia campaign. J. Geophys. Res. 109:D19. doi:10.1029/2004jd004598.
- Sorek-Hamer, M., D. M. Broday, R. Chatfield, R. Esswein, M. Stafoggia, J. Lepeule, A. Lyapustin, and I. Kloog. 2017. Monthly analysis of PM ratio characteristics and its relation to AOD. J. Air Waste Manage. Assoc. 67 (1):27–38. doi:10.1080/10962247.2016.1208121.
- Stone, E., J. Schauer, T. A. Quraishi, and A. Mahmood. 2010. Chemical characterization and source apportionment of fine and coarse particulate matter in Lahore, Pakistan. Atmos. Environ. 44 (8):1062–1070. doi:10.1016/j.atmosenv.2009.12.015.
- Tang, M., D. J. Cziczo, and V. H. Grassian. 2016. Interactions of water with mineral dust aerosol: Water adsorption, hygroscopicity, cloud condensation, and ice nucleation. Chem. Rev. 116 (7):4205–4259. doi:10.1021/acs.chemrev.5b00529.
- Tsapakis, M., and E. G. Stephanou. 2005. Occurrence of gaseous and particulate polycyclic aromatic hydrocarbons in the urban atmosphere: Study of sources and ambient temperature effect on the gas/particle concentration and distribution. Environ. Pollut. 133 (1):147–156. doi:10.1016/j.envpol.2004.05.012.
- Turpin, B. J., and H. J. Lim. 2001. Species contributions to PM2.5 mass concentrations: Revisiting common assumptions for estimating organic mass. Aerosol Sci. Technol. 35 (1):602–610. doi:10.1080/02786820119445.
- Wang, F., Z. Guo, T. Lin, and N. L. Rose. 2016a. Seasonal variation of carbonaceous pollutants in PM2.5 at an urban ‘supersite’ in Shanghai, China. Chemosphere 146:238–244. doi:10.1016/j.chemosphere.2015.12.036.
- Wang, F., T. Lin, J. Feng, H. Fu, and Z. Guo. 2015a. Source apportionment of polycyclic aromatic hydrocarbons in PM2.5 using positive matrix factorization modeling in Shanghai, China. Environ. Sci. 17 (1):197–205. doi:10.1039/c4em00570h.
- Wang, F. W., T. Lin, Y. Y. Li, T. Y. Ji, C. L. Ma, and Z. G. Guo. 2014. Sources of polycyclic aromatic hydrocarbons in PM2.5 over the East China Sea, a downwind domain of East Asian continental outflow. Atmos. Environ. 92:484–492. doi:10.1016/j.atmosenv.2014.05.003.
- Wang, J., S. S. H. Ho, J. Cao, R. Huang, J. Zhou, Y. Zhao, H. Xu, S. Liu, G. Wang, Z. Shen, and Y. Han. 2015b. Characteristics and major sources of carbonaceous aerosols in PM2.5 from Sanya, China. Sci. Total Environ. 530–531:110–119. doi:10.1016/j.scitotenv.2015.05.005.
- Wang, J., S. S. H. Ho, S. Ma, J. Cao, W. Dai, S. Liu, Z. Shen, R. Huang, G. Wang, and Y. Han. 2016b. Characterization of PM2.5 in Guangzhou, China: Uses of organic markers for supporting source apportionment. Sci. Total Environ. 550:961–971. doi:10.1016/j.scitotenv.2016.01.138.
- Wang, Q., N. Jiang, S. Yin, X. Li, F. Yu, Y. Guo, and R. Zhang. 2017. Carbonaceous species in PM2.5 and PM10 in urban area of Zhengzhou in China: Seasonal variations and source apportionment. Atmospheric Res. 191:1–11. doi:10.1016/j.atmosres.2017.02.003.
- WHO. 2014. WHO’s ambient air pollution database: Update 2014. Ginebra, Suiza: Author.
- Yadav, S., A. Tandon, and A. K. Attri. 2013. Characterization of aerosol associated non-polar organic compounds using TD-GC-MS: A four year study from Delhi, India. J. Hazard. Mater. 252–253:29–44. doi:10.1016/j.jhazmat.2013.02.024.
- Yan, B., M. Zheng, Y. Hu, X. Ding, A. P. Sullivan, R. J. Weber, J. Baek, E. S. Edgerton, and A. G. Russell. 2009. Roadside, urban, and rural comparison of primary and secondary organic molecular markers in ambient PM2.5. Environ. Sci. Technol. 43 (12):4287–4293.
- Yu, S. C., R. L. Dennis, P. V. Bhave, and B. K. Eder. 2004. Primary and secondary organic aerosols over the United States: Estimates on the basis of observed organic carbon (OC) and elemental carbon (EC), and air quality modeled primary OC/EC ratios. Atmos. Environ. 38 (31):5257–5268. doi:10.1016/j.atmosenv.2004.02.064.
- Yunker, M. B., R. W. Macdonald, R. Vingarzan, R. H. Mitchell, D. Goyette, and S. Sylvestre. 2002. PAHs in the Fraser River basin: A critical appraisal of PAH ratios as indicators of PAH source and composition. Org. Geochem. 33 (4):489–515. doi:10.1016/S0146-6380(02)00002-5.
- Zhang, M., J. F. Xie, Z. T. Wang, L. J. Zhao, H. Zhang, and M. Li. 2016. Determination and source identification of priority polycyclic aromatic hydrocarbons in PM2.5 in Taiyuan, China. Atmospheric Res. 178:401–414. doi:10.1016/j.atmosres.2016.04.005.
- Zhang, R. J., J. Tao, K. F. Ho, Z. X. Shen, G. H. Wang, J. J. Cao, S. X. Liu, L. M. Zhang, and S. C. Lee. 2012. Characterization of atmospheric organic and elemental carbon of PM2.5 in a typical semi-arid area of Northeastern China. Aerosol Air Qual. Res. 12 (5):792–802. doi:10.4209/aaqr.2011.07.0110.
- Zhou, J. B., Z. Y. Xing, J. J. Deng, and K. Du. 2016. Characterizing and sourcing ambient PM2.5 over key emission regions in China I: Water-soluble ions and carbonaceous fractions. Atmos. Environ. 135:20–30. doi:10.1016/j.atmosenv.2016.03.054.