
 ?Mathematical formulae have been encoded as MathML and are displayed in this HTML version using MathJax in order to improve their display. Uncheck the box to turn MathJax off. This feature requires Javascript. Click on a formula to zoom.
ABSTRACT
Thallium (Tl) is a toxic element that exists in coal at trace level. Coal-fired power plants (CFPPs) consume large amounts of coal and can potentially release this element into surrounding environment. However, knowledge of fates of Tl inside CFPPs and associated atmospheric emissions is still very limited. In this study, five CFPPs with pulverized coal boilers (PC) in Guizhou province, southwest China, were selected for investigation. All input and output solid materials and the stack flue gas samples were collected simultaneously. Tl concentrations in feed coal (0.10–0.34 mg·kg−1) of the five CFPPS were only a third to one half of the national average value. Tl concentrations were obviously higher in fly ash (0.39–1.13 mg·kg−1) than in bottom ash (0.09–0.25 mg·kg−1), indicating notable redistribution of Tl during coal combustion. Tl concentrations were low in limestone (0.01–0.02 mg·kg−1), flue gas desulfurization gypsum (0.01–0.03 mg·kg−1), and the stack flue gas (0.006–0.011 μg·Nm−3). Most Tl inside these CFPPs was captured by electrostatic precipitator or electrostatic precipitator-fabric filter (ESP/ESP-FF) fly ash (88.66%–97.44%), followed by bottom ash (2.13%–10.73%), gypsum (<3.89%), and stack emissions (0.01%–0.05%). Atmospheric emission factors of Tl from different CFPPs are in the range of 0.04–0.09 mg Tl·t−1 coal, 0.02–0.04 μg·(kW·h)−1, or 0.002–0.004 g Tl·TJ−1. Using these emission factors, a total of 3.96 ± 1.32 kg (range: 2.64–5.94 kg) Tl is estimated to be released into the atmosphere annually from CFPPs in Guizhou in 2017. To avoid the cross-media contamination from the combustion products, careful treatment of the captured fly ash, bottom ash, and gypsum is needed, considering that a large amount of Tl (average: 728 kg·yr−1; range: 664–792 kg·yr−1) is retained in these solid combustion products and the possibility of formation of more toxic Tl3+ during the combustion process.
Implications: Thallium (Tl) is a rare but toxic element. Identifying and quantifying its source are high priorities for controling its contamination. Coal-fired power plants (CFPPs) were thought an important source of Tl, but few field studies had been conducted for this area. In this article, we investigated the fate of Tl in five pulverized coal utility power plants in Guizhou province, Southwest China, and found the Tl concentration in stack gas is in low levels of 0.006–0.011 μg·Nm−3, and less than 0.05% of total input of Tl is escaped into the ambient atmosphere. The majority of Tl (88.7%–97.4% of the total output) is detained by the ESP/ESP-FF fly ashes. Compared to the little amount (~4 kg·yr−1) of Tl that discharged into the atmosphere from Guizhuo’s CFPPs in 2017, more Tl (over 700 kg) ends up in the solid coal combustion products each year, which makes the need of careful disposal of this solid combustion waste to prevent the mobilization of Tl into the environment.
Introduction
Thallium (Tl) is a typical rare element distributed in the natural environment (Fang and Liu Citation2019; Liu et al. Citation2019a) but is persistent in air, water, and soil (Belzile and Chen Citation2017). Tl is considered to be a more toxic element than lead, mercury and cadmium (Maluszynski Citation2009; Peter and Viraraghavan Citation2005), with its toxic effects being frequently recognized in animals and humans (Viraraghavan and Srinivasan Citation2011). Exposure to high level of Tl can result in serious health issues to human beings, including hair loss, mild progressive gastrointestinal disturbances, encephalopathy, tachycardia, degenerative changes in heart, liver, and kidneys, changes in the central nervous system and cardiovascular system, and ultimately death (Hoffman Citation2000; Meggs et al. Citation1995; Prick, Sillevis Smitt, and Muller Citation1995; Saha et al. Citation2004; U.S. EPA Citation2009a). Thus, Tl has been listed as a priority pollutant by many agencies, such as the United States (U.S.) Environmental Protection Agency (EPA) and the European Union (Directive 67/548/EEC).
Beside the geological sources, such as rock weathering and soil erosion (Li et al. Citation2019a; Xiao et al. Citation2012), industrial facilities, including coal-fired power plants (CFPPs), lead and zinc smelters, and cement plants where Tl exists as impurity in raw materials, are the major sources releasing Tl into the natural environment (Clarke and Sloss Citation1992; López-Antón et al. Citation2013; Saha Citation2005). For example, available data indicate that CFPPs are among the main sources of Tl emissions to the atmosphere, with global atmospheric emissions from this source totally 600 tons/year (Ewers Citation1988; Kazantzis Citation2000; Peter and Viraraghavan Citation2005). In CFPPs, Tl levels in flue gas of CFPPs with as high as 700 μg·m−3 (López-Antón et al. Citation2015, Citation2013), and Tl contents in fly ash with 2–10 times higher than those in the coal before combustion were observed (Affolter et al. Citation2011; López-Antón et al. Citation2013).
China has become the largest coal consumer in the world and consumed 3.86 billion tons in 2017, in which 47% is by the power plants sector (National Bureau of Statistic of China Citation2019). However, little is known about the fates of Tl in CFPPs and its atmospheric emissions from this source in China. Guizhou province in Southwest China is the fifth largest coal reserve in China and the largest coal mining in southern China (Bai et al. Citation2018), but coal produced here is with higher ash yields and sulfur contents than those in other places in China (Li and Zhai Citation1994). Because coal property is a key factor controlling the behaviors of trace metals in combustion and air pollution control processes (Xu et al. Citation2003), the distributions of Tl inside the CFPPs might be different between Guizhou and other provinces in China. In this study, we selected five pulverized coal-fired boiler (PC) power plants in Guizhou province for investigating fates of T1 in CFPPs. The installation capacity of these five CFPPs represents about a quarter of the provincial total. Feed fuel, limestone, bottom ash, fly ash, gypsum, as well as stack flue gas were collected simultaneously and analyzed for T1 contents. The main objectives are to (1) understand the distribution behavior of Tl in these CFPPs with different air pollution control devices (APCDs); (2) obtain the release ratio of Tl during the combustion process; (3) gain the up-to-date atmospheric emission factors and the mass balance of Tl in these CFPPs; and (4) estimate the total amount of atmospheric Tl emissions from CFPPs in this province. Results from this study provide scientific knowledge and database for compiling Tl atmospheric emissions from this source category in China, which are needed for assessing possible impacts of Tl pollution caused by CFPPs.
Materials and methods
Plant description and sample collection
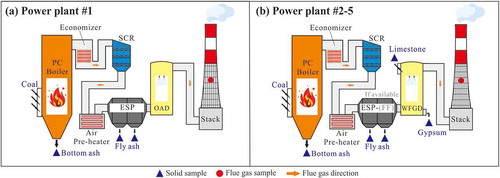
Five CFPPs in Guizhou province of southwest China were selected for sample collection in this study (). CFPPs #1 and #4 are situated in the central areas and #2, #3, and #5 in the western areas of the province. The central to western areas of the province are the main coal production areas, with most coal formed in Late Permian and in bituminous or anthracitic. All utility boilers are PC boilers, with capacity ranging from 200 to 660 MW. APCDs of these CFPPs are slightly different, namely, with selective catalytic reduction (SCR) for all CFPPs, cold-side electrostatic precipitator (C-ESP) for #1 and #2, cold-side electrostatic precipitator combined fabric filter (C-ESP-FF) for #3–5, organic amine desulfurization (OAD) for CFPPs #1, and limestone-gypsum wet flue gas desulfurization (WFGD) for #2–5. The detailed information about the boiler type, installed capacity, and APCDs are summarized in .
Figure 1. (a) Distribution and formation ages of coal in China (modified from Dai and Finkelman Citation2018), and (b) locations of the five coal-fired power plants in this study and Tl concentration in Guizhou’s coal (unpublished internal data)
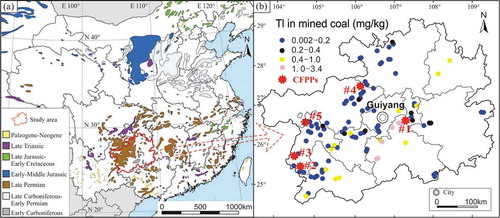
Table 1. Information of the five CFPPs investigated in the present study
The sampling points for the solid and flue gas samples in each CFPP are shown in . Only one utility boiler system in each CFPP was sampled to represent the whole CFPP because the feed coal and APCDs are the same for different units. In addition, other units might not be accessible for sampling. Feed fuel (bituminous and anthracite), coal combustion products (CCPs, referred to as bottom ash and electrostatic precipitator or electrostatic precipitator-fabric filter [ESP/ESP-FF] fly ash), limestone and desulfurized gypsum were collected simultaneously (about 1 kg per sample) for 3–6 samples during a 2–3 days period for each CFPP with half day sampling interval. Organic amines and sulfuric acid samples in CFPPs #1 were not collected. The fly ash was collected from the fly ash silo for truck transportation, and the sample was a mixture of fly ash from different hoppers of ESP/ESP-FF. The temperature of the stack flue gas is 40–50° C for the tested CFPPs, and thus only particulate matter (PM) was collected considering the much higher melting point (303.5° C) and boiling point (1,457° C) of Tl, since volatile elements like Tl would condense onto the fly ash surfaces at such low temperatures in stack flue gas (Meij Citation1994). PM in the stack flue gas was collected on a teflon filter (Whatman®, 0.45 μm pore size) with the U.S. EPA Method 5 for particulate matter sampling in the stack flue gas (Figure S1 in supporting information). PM in fly ash in CFPPs is dominantly larger than 1 μm, and thus will be mostly collected by the above method (Chen et al. Citation2018; Liu et al. Citation2019b). The sampling train for flue gas is maintained at a temperature of 120° ± 10° C to avoid water condensation (U.S. EPA Citation1996). Each flue gas sample was collected for approximately 3 hours and 3 flue gas samples were obtained for one CFPP. At the same time, information about the boiler (Table S1) was recorded during the sampling period, including the daily feed fuel/limestone consumption (t·d−1), the daily output of different solid combustion materials (t·d−1), daily flue gas emissions (Nm3·d−1), and the boiler load (MW).
Figure 2. Sampling sites inside the five coal-fired power plants
In total, 108 solid samples were collected in this study, of which, 84 were subjected to Tl analysis with 3 set of different type samples for each CFPP, in addition, all fueled coals (N = 21) were analyzed for the proximate and ultimate analysis.
Analysis methods
All solid samples were air-dried and ground into sizes smaller than 0.150 mm. The results of solid samples are given based on air-dried masses.
The proximate analysis method of feed coal was referenced to the Chinese National Standard Method (GB/T 212-Citation2008). Carbon (C), hydrogen (H), and nitrogen (N) were determined by an elemental analyzer (Vario MACRO Cube, Elementar, Germany), and total sulfur (S) was measured based on the Eschka method with Chinese standard method of GB/T 214-Citation2007. The calorific value (Q) was determined by GB/T 213-Citation2008.
Tl in solid samples was measured by inductively coupled plasma mass spectrometry (ICP-MS, Analytik Jena, Germany) after digestion with a method developed by Qi and Grégoire (Citation2000). Briefly, around 50 mg of a sample was digested with 1 mL of concentrated HF and 1 mL of concentrated HNO3 in 190° C for 24 hours, and then heated to 140° C for 5 hours with 6 mL of 40% v/v HNO3 to dissolve the possible insoluble residues. Tl concentration in stack flue gas was calculated from the total amount of Tl on the filter relative to the sampled volume of flue gas.
To reveal the possible sources of Tl in feed coal, Hg and Zn in coal samples were also measured, with Hg being determined by cold-vapor atomic absorption spectrometry with a RA915+ Hg analyzer that equipped with PYRO 915+ pyrolysis attachment, and Zn being digested and analyzed with the same procedure as that of Tl.
Quality assurance and quality control
Precautions were employed for the sampling and analysis to reduce possible contamination. All glass/Teflon tubing and bottles used for flue gas sampling and digestion were washed with 20% nitric (HNO3) acid and rinsed with deionized water. HF and HNO3 were distilled twice to remove the impurities. Quality assurance and quality control were checked with blanks, duplicated samples, and certified reference materials (CRMs). Several CRMs of coal (GSB 06-2114-2007, GSB 06-2105-2007) were used for the proximate and ultimate analysis, and the recovery rate is 95%–105% for different parameters. Standard materials of fly ash (BCR 176R), soil (GBW07404), and limestone (JLS-1; JDO-1) are also digested and analyzed along with solid samples, and the recovery of Tl was in the range of 97%–113%. In addition, the detection limit of Tl of this study was less than 0.001 mg·kg−1 based on the procedure blanks.
Calculation of thallium behavior parameters
Relative enrichment factor
The parameter of relative enrichment factor (REF) is used to reveal the enrichment or partitioning of a target element in coal combustion products of fly ash or bottom ash during the combustion process in boilers (Meij Citation1994). REF is calculated using EquationEquation (1)(1)
(1) :
where is Tl concentration in bottom ash or fly ash (mg·kg−1),
is ash yield of feed fuel on air-dried basis (%), and
is Tl concentration in feed fuel (mg·kg−1). A higher REF indicates Tl is prone to be contained in the ash, while a lower one suggests a depletion of Tl in the ash. Meij (Citation1994) classified elements into three groups according to their emission features, with Group I being hardly volatile, Group II partially volatile, and Group III very volatile. Group I elements are those that do not volatilize during combustion, so their concentrations in all types of ash are almost the same; thus REFs for these elements are around 1 with an uncertainty of ± 0.3 (Meij Citation1994). Group II elements are those redistributed in both bottom and fly ashes because they volatilize during combustion in the boiler, and then condense (when temperature drops from 1,300° C to 120° C) on the particulate matter and emit to the stack and hence have higher REFs for fly ash (≈1) than bottom ash (usually <0.7). Group III elements consist of volatile elements with very low REF (close to 0 for bottom ash and <1 for fly ash) in solid combustion products and are almost entirely emitted from the power plant.
Release ratio
Release ratio (R) is derived to evaluate the volatility of Tl during the coal combustion in boiler at high temperatures (Deng et al. Citation2014; Zhou et al. Citation2020), or as an indicator to reflect the proportion of Tl entering into flue gas during the coal combustion. It is determined using EquationEquation (2)(2)
(2) :
where is the concentration of Tl in bottom ash (mg·kg−1),
is the concentration of Tl in feed coal (mg·kg−1),
represents ash yield in feed coal (%), and
stands for the percentage of bottom ash with respect to the ash yield in coal.
Atmospheric emission factors
Emission factors (EMFs) of Tl are calculated based on different benchmarks (Wang et al. Citation2010; Zhao et al. Citation2017, Citation2008), such as coal consumption (EMF1), power generation (EMF2), and heat values (EMF3), as shown in EquationEquations (3)(3)
(3) –(Equation5
(5)
(5) ), respectively:
where is the amount of Tl emitted into the atmosphere per day (g·d−1),
is the consumption of feed coal (t·d−1, based on CFPP statistics),
is the boiler load of tested power plant (online monitoring data),
is the running time of a utility boiler (24 h·d−1), and
is heat value of feed fuel based on air-dried mass (MJ·kg−1).
Results and discussion
Coal properties
Slightly lower fixed carbon content was observed in bituminous (range 37.1%–50.2%; average 44.6 ± 5.6) used in CFPPs #1–3 and #5 than in anthracite (51.7%) used in CFPP #4 (), similar to what was found by Mokhtar, Taib, and Hassim (Citation2014). Ash yields of feed coal samples are in the range of 30.7%–45.7%, most of which fall into the median range (30.0%–40.0%), except those from CFPP #5 (45.7%), which is in the high range, according to the classification in the National Coal Classification Standard of China (GB 15224.1-2010). The sulfur contents in feed coals fall into high-sulfur category (>3.00%) for CFPPs #1 and #4, low-sulfur category (0.51%–1.00%) for CFPPs #2 and #3, and medium sulfur category (1.01%–2.00%) for CFPP #5 according to Chinese standard of GB15224.2-2010 for sulfur content classification in coal. A previous study by Cao (Citation2006) showed that the higher sulfur content observed in coal of eastern to central Guizhou than western Guizhou was a result of seawater intrusion. The calorific values of feed coals fall into medium category (21.3–24.3 MJ·kg−1) for CFPPs #1 and #4, medium to high category (24.3–27.2 MJ·kg−1) for CFPPs #2 and #3, and medium to low category (16.7–21.3 MJ·kg−1) for CFPPs #5 based on GB 15224.3–2010 for calorific value classification. The above information indicates that the coal qualities used in different CFPPs are quite different. In general, feed coals used in Guizhou’s CFPPs are featured with high ash yield, some with high sulfur content and low calorific values.
Table 2. Proximate and ultimate analysis of feed fuels
Tl concentrations in feed coals are in the range of 0.10–0.34 mg·kg−1, with the highest value (0.34 mg·kg−1) in CFPP #1 located in central Guizhou, which is 1.5–3.4 times of those in the other CFPPs (0.10–0.23 mg·kg−1) located in western and northern Guizhou (). This distribution pattern of Tl in feed coal among the different CFPPs is similar to the spatial distribution pattern of Tl in mined coal in Guizhou (). Note that coal mines in Guizhou are mainly distributed in the central to west areas of the province (, Dai and Finkelman Citation2018), and all the CFPPs surveyed in the present study are located in these areas and only use the locally mined coals, which explains the similar spatial patterns of Tl in feed coal and mined coal. The average Tl concentration in feed coal of all the five CFPPs is 0.20 ± 0.10 mg·kg−1, which is higher than that (0.09 mg·kg−1) used in Bijie thermal power plant in western Guizhou (Li and Sun Citation2016). Nevertheless, these values are lower than the global average of 0.63 mg·kg−1 (Ketris and Yudovich Citation2009) and the average of Chinese coal (0.47 mg·kg−1, Dai et al. Citation2012), but are higher than the average of western Guizhou coal (0.11 mg·kg−1, Dai et al. Citation2005, Table S2).
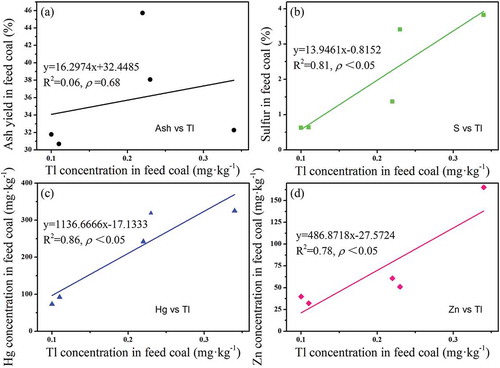
The status of Tl in coal has not been studied in great details (Dai et al. Citation2012), but is generally considered to be mainly present in sulfides (Dai et al. Citation2006; Finkelman Citation1995). Tl is concentrated in pyrite in coal along with other environmentally sensitive elements, notably Hg (Dziok et al. Citation2018; López-Antón et al. Citation2013). Therefore, correlation analysis was conducted between Tl and ash yield, sulfur, mercury, and zinc in feed coal, respectively (). It was found that Tl concentration in feed coal is not significantly correlated with ash yield of feed coal (R2 = 0.06, p = 0.68, ), but significantly correlated with sulfur concentration (R2 = 0.81, p < 0.05, ), Hg concentration (R2 = 0.86, p < 0.05, ), and Zn concentration (R2 = 0.78, p < 0.05, ) in feed coal. This suggests that Tl is a sulfophilic element, which is primarily associated with other sulfophilic elements that exist as pyrite (FeS), cinnabar (HgS), and sphalerite (ZnS) in feed coal, but do not co-exist in the ash forming materials. This is consistent with other studies that indicated thallium is mainly associated with pyrite in hard coal (Smolka-Danielowska and Fiedor Citation2018). Pyrite contains nearly all of the Hg, As, Se, Tl, and Pb and is also the major source of Mo, Ni, Cd, and Sb (Spears and Tewalt Citation2009). The analyses of pyrite by Diehl, Goldhaber, and Hatch (Citation2004) indicated the occurrence of high concentrations of Hg, As, Mo, Se, Cu, and Tl. Hence, by coal washing, the input of Tl might be potentially reduced since this process removed a lot of pyrite (Pavlish et al. Citation2003).
Figure 3. The correlation analysis of Tl with (a) ash yield, (b) sulfur, (c) mercury, and (d) zinc in feed coal
Distribution of Tl in the combustion products
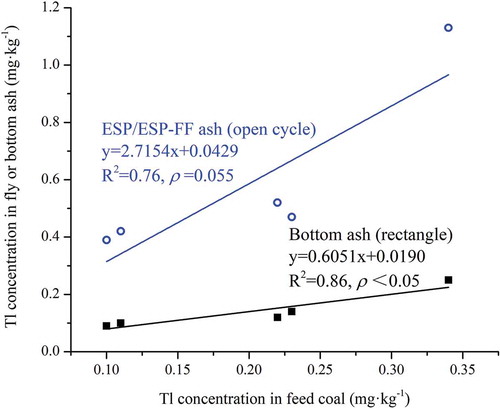
Tl concentrations in various solid combustion products and stack flue gas are presented in . Tl concentrations are in the range of 0.09–0.25 mg·kg−1 for bottom ash and 0.39–1.13 mg·kg−1 for fly ash, with much higher Tl concentration in fly ash than bottom ash in every CFPP. The highest Tl concentrations among the five CFPPs occurred in CFPP #1, e.g., in coal (0.34 ± 0.05 mg·kg−1), bottom ash (0.25 ± 0.07 mg·kg−1), and fly ash (1.13 ± 0.25 mg·kg−1) (), suggesting that Tl in bottom ash and fly ash are dominantly inherited from the feed coals. Tl concentrations in both ESP/ESP-FF fly ash and bottom ash positively correlated with those in feed coal (). The larger regression slope of fly ash than bottom ash against feed coal suggests more Tl was detained in fly ash than bottom ash.
Table 3. Tl concentration in the solid materials and stack flue gas of the five CFPPs (the analyzed sample number is three for each sample of a CFPP)
Figure 4. The Pearson correlations between Tl concentration in feed fuel and fly (open cycle)/bottom (rectangle) ashes of the five coal-fired power plants
The mean Tl concentration in ESP/ESP-FF fly ash (0.59 ± 0.31 mg·kg−1) is significantly higher than that in bottom ash (0.14 ± 0.06 mg·kg−1), e.g., by 1.5–12 times. In literature, Tl in fly ash was 13 times of that in bottom ash in Netherlands’ PC power plants (Meij Citation1994), and as high as 10.7 mg·kg−1 was found for fly ash of grate furnace (Smolka-Danielowska and Fiedor Citation2018), while similar Tl concentration were observed between fly ash (1.3 mg·kg−1) and bottom ash (1.1 mg·kg−1) in a Spanish circulating fluidized bed boiler (CFB) boiler (Table S3), which might be due to the weak redistribution effect of low combustion temperatures (800–950° C) (López-Antón et al. Citation2015). A study of Bijie CFB in the west of Guizhou province found very low Tl concentrations in fly ash (0.2 mg·kg−1) and bottom ash (0.17 mg·kg−1) (Li and Sun Citation2016; Table S3).
The re-distribution of Tl between bottom ash and fly ash depends not only on the property of fuel coal and also on the combustion conditions, especially the combustion temperature (López-Antón et al. Citation2015; Smolka-Danielowska and Fiedor Citation2018), since a higher combustion temperature might induce a more notable discrepancy of Tl between fly ash and bottom ash (Meij Citation1994). Tl could be easily melted and/or evaporated in the PC boilers since the temperature range of PC can reach 1,200–1,500° C (Chen et al. Citation2019). Therefore, Tl belongs to Group II elements with moderate volatility (Meij Citation1994), and is melted or evaporated inside the boilers and adsorbed onto the fly ash after flue gas temperature drops. Based on EquationEquation (1)(1)
(1) , REF values of Tl in bottom ash and fly ash of the five CFPPs were estimated to be in the range of 0.23–0.30 (average 0.27) and 0.76–1.25 (average 1.08), respectively (), indicating that Tl is segregated more on fly ash than bottom ash (Chen et al. Citation2019).
Figure 5. Relative enrichment factors of Tl in coal combustion productions of five coal-fired power plants
Compared with those in feed fuels and fly/bottom ashes, Tl concentrations in limestone and FGD gypsum are extremely low, e.g., in the range of 0.01–0.02 mg·kg−1 and 0.01–0.03 mg·kg−1, respectively. Tl concentrations are similar between those in limestone and gypsum in all CFPPs (); this indicates that negligible Tl was brought into gypsum from the flue gas downstream the ESP/ESP-FF. Tl concentrations in stack flue gas are 0.011 μg·Nm−3 in CFPP #1 and 0.006–0.008 μg·Nm−3 in CFPPs #2–5 (), which are lower than that observed from a PC CFPP equipped with ESP+WFGD in the Netherlands (0.18 μg·Nm−3, Meij and Te Winkel Citation2007; Table S3). Emission standards for Tl from CFPPs do not exist in China; however, there is an emission limit for Tl (0.05 mg·m−3) set for inorganic chemical industry in China (GB 31573-Citation2015) enacted by the Ministry of Environment of China in 2015. Tl emission intensities from the CFPPs investigated in the present study were far less than the limit set by this regulation.
PM emitted from the stack flue gas of the five CFPPs are in the range of 10.03–18.28 mg·Nm−3 (average 13.19 mg·Nm−3), which are higher than those from eight PC CFPPs (2.35–13.70 mg·Nm−3) that are equipped with ultra-low emission device of SCR+ESP/FF/ESP&FF+WFGD+wet ESP (Wu et al. Citation2020), and comparable to those from a 1,000 MW PC CFPP with a SCR, low-low temperature electrostatic precipitator, WFGD, and wet ESP (<15 mg·Nm−3, Li et al. Citation2019b). Both these emitted PM values are lower than the national emission standard for CFPPs (30 mg·m−3, GB 13223-2011), with PM emissions being significantly reduced after the additional installation of wet ESP (Wu et al. Citation2020).
It appears that there are two solid (TlCl3 (s) and (TlAsO4 (s)) and two condensed (TlCl (cr, l) and Tl2SO4 (cr, l)) Tl species as the major species under oxidation condition when the temperature is lower than 277° C (Yan et al. Citation2001a, Citation2001b), with cr here standing for the amorphous solid. The Tl species would be TlI (cr, l) (27° C), Tl2S (cr, l) (77° C), Tl2Se(s) (127° C), and TlBr (cr, l) (177° C) under reducing condition. Several gaseous Tl halides and free atom (Tl (g)) become dominant, e.g., TlBr (g) (227°–1127° C), TlCl (g) (227°–1227° C), Tl (g) (above 827° C), and TlI (g) (127°–927° C), at higher temperature oxidation conditions. This makes the possibility of evaporation and redistribution of Tl in the PC utility boilers where the combustion temperature is higher than 1,200° C.
Thompson and Argent (Citation2002) found the volatilization of Tl during coal combustion increases with increasing chlorine content because they react with each other, and this process intensifies under the gasification condition. A portion of gaseous Tl is condensed into fly ash, and is released into the atmosphere as a hazardous waste (López-Antón et al. Citation2013). Querol et al. (Citation1995) found the adsorption of Tl on calcium oxide is similar to the way of sulfur fixation in flue gas desulfurization (CaO+SO3=CaSO4). Therefore, the toxicity of fly ash is potentially increased when the volatile toxic element Tl is adsorbed into inhalable particles, and Tl compounds are easier than the other heavy metals to be leached out (Karbowska Citation2016).
Release ratio, mass balance and atmospheric emissions of Tl
The release ratio of a trace element from coal combustion depends on coal content and volatility of the trace element, coal property, boiler type, and operation condition (Ratafia-Brown Citation1994). As shown in , Tl has a high release ratio of 89.28%–97.88% into flue gas during coal combustion process of the five CFPPs, despite its only moderate volatility, which is likely due to the high combustion temperatures (1,200°–1,500° C) and that the vast majority of ash (80%–90%) entering the flue gas in the form of fly ash.
Table 4. Release ratio, removal efficiency and emission factors of Tl in the five CFPPs
Mass balance of Tl in every CFPP is assessed by incorporating the input/output material flows (Table S1) and Tl concentrations in solid and stack gas samples (). Tl input and output are basically balanced in every CFPP, with output/input ratio being in the range of 73.41%–127.84% ( and Table S4), which is considered to be an acceptable range (70%–130%) when taking into account the inhomogeneity of the chemical composition of the combusted fuel and the much smaller sample quantities than the actually consumed feed coal quantities (Quick and Irons Citation2002). Tl input into the installation is mostly from feed coal (>99.11%) and little from limestone (0.19%–0.89%) ( and Table S5) due to the relatively higher Tl concentration and much larger amount of consumption of feed coal than limestone ( and Table S1).
Figure 6. Proportion of Tl in input and output materials of the five coal-fired power plants (the output ratio is based on the total input of Tl)
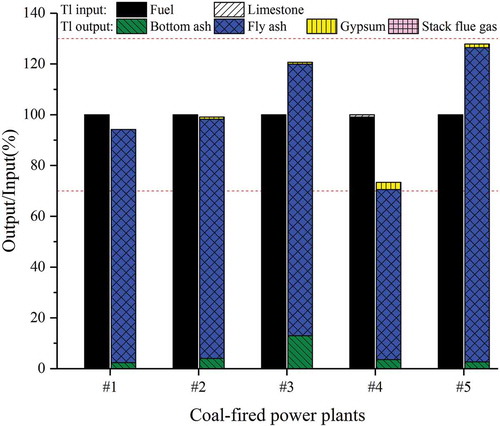
The breakdown of Tl in different input and output materials of the five utility boilers is shown in Table S5. In terms of different output materials, ESP/ESP-FF fly ash is the leading output pathway (88.66%–97.44%), followed by bottom ash (2.12%–10.72%) ( and Table S5), and the WFGD gypsum (0.57%–3.89%) ( and Table S5). It was noticed that the output percentage of Tl in bottom ash is much higher in CFPP #3 (10.73%) than in the other CFPPs (2.13%–4.86%), likely due to the much higher production of bottom ash in CFPP #3 (597 t·d−1) than in the other CFPPs (101–149 t·d−1) (Table S1).
Gas-phase volatile elements produced under high temperatures will condense or adsorb onto existing particles when the temperature drops (Klein et al. Citation1975). Tl released from coal combustion condenses rapidly when flue gas cools down, causing Tl mostly accumulated in fly ash (Pavageau et al. Citation2004). Tl in fly ash is further captured by ESP or ESP-FF at a very high removal efficiency (over 99.9%), followed by an additional removal process by downstream WFGD for particulate matters at a removal efficiency of 30%–56% (Liu et al. Citation2019b; Yao et al. Citation2019). Thus, most Tl in fly ash is captured by these devices and only 0.57%–3.89% of Tl enters into the WFGD gypsum. Eventually, Tl in stack flue gas only makes up of < 0.05% of the total Tl output ( and Table S5), which is equivalent of an atmospheric emission rate of 0.07–0.38 g Tl·d−1 for the five CFPPs (Table S4).
The atmospheric emission factors of Tl from the five CFPPs are estimated to be 0.04–0.09 (mean: 0.06 ± 0.02) mg Tl·t−1 coal, 0.02–0.04 (mean: 0.03 ± 0.01) μg Tl·(kW·h)−1, or 0.002–0.004 (mean: 0.0024 ± 0.001) g Tl·TJ−1 (), with the maximum values for CFPP #1 and the low-end values for all the other four CFPPs (). In 2017, the output of coal in Guizhou was 163 million tons, of these 66 million tons were consumed by the electricity generation sector for generating 121 billion kW·h power (Bureau of statistics of Guizhou Province Citation2018). Tl atmospheric emissions from CFPPs in Guizhou are estimated to be 3.96 ± 1.32 kg·y−1 (range 2.64–5.94 kg·y−1) and 3.63 ± 1.21 kg·yr−1 (range 2.42–4.84 kg·yr−1) in 2017 based on the coal consumption and power generation, respectively. The emission factors (0.02–0.04 μg·(kW·h)−1 and 0.002–0.004 g·TJ−1) generated from the present study are significantly lower than previously reported values (0.58 μg·(kW·h)−1 and 0.07 g·TJ−1) from an on-site study in the Netherlands (Meij and Te Winkel Citation2007). However, it should be noted that studies on Tl concentrations in stack flue gas are very limited, and further research are still needed to improve the accuracy of its emission inventory from this industrial source.
With upgrading APCDs technology and phasing out small and old boilers in the past two decades, China has made significant progress in reducing atmospheric pollutants emissions from CFPPs including nitrogen oxides, sulfur dioxide, and PM (Wu et al. Citation2020; Yang et al. Citation2018). Tl in feed coals has also been significantly controlled from the flue gas due to the implementation of modern APCDs in Guizhou. For example, data collected in the present study show very high removal efficiency of Tl by a combination of different APCDs (99.95%–99.99%, ). Consequently, the total amount of Tl entering into fly ash, bottom ash, and desulfurized gypsum are estimated to be 681.06 ± 27.37 kg·yr−1, 35.43 ± 25.19 kg·yr−1, and 11.69 ± 11.26 kg·yr−1, respectively, from all CFPPs in Guizhou in 2017. Compared to the behaviors of Tl in CFPPs, Hg in Guizhou’s 12 PC CFPPs has been captured more in the gypsum (54.4%) than in ESP/ESP-FF fly ash (40.4%), and a higher percentage of Hg (4.6%) than Tl has been discharged from the stack emissions (Internal unpublished data). Anyhow, over 90% of Tl ending up in fly ash raises the concern of Tl leaching out from these ashes since Tl (I) in coal could be oxidized to Tl (III) during the combustion process (Llorens et al. Citation2001; López-Antón et al. Citation2013; Zhang et al. Citation2019) and Tl and thallium-based compounds are more soluble compared to the other heavy metals and are thus more readily available for bioaccumulation in living organisms (Karbowska Citation2016). Although the environmental standard of Tl has been set at 2 μg·L−1 for drinking water (U.S. EPA Citation2009b) and 1 mg·kg−1 for arable soils (Xiao et al. Citation2004), little has been done for investigating the leach-ability of Tl in the coal combustion products.
Conclusion
Based on the field investigation of five PC utility boiler installations in Guizhou province, it was found that Tl in feed coals is associated with sulfur and sulfophilic elements (e.g., Hg, Zn), and the average Tl concentration of feed coals in Guizhou (0.20 mg·kg−1) is about 1/3 to 1/2 of those of national and global average. During the combustion process and the subsequent APCDs, over 99.9% of Tl in flue gas was captured by the combination of different pollution control devices. Among the Tl output pathways, the ESP/ESP-FF fly ash is the leading one that accounts for 88.7%–97.4% of the total output, and the stack gas emissions only contribute a very small portion (<0.05%) of output. The total amount of Tl atmospheric emissions from CFPPs in Guizhou province was estimated to be 3.96 ± 1.32 kg·yr−1 in 2017. Tl in fly ash has the highest concentration among the different solid byproducts of bottom ash and gypsum, and a large amount of T1 (681 kg·yr−1 at the provincial level) is retained in fly ash. Furthermore, conversion of Tl (I) in feed coal to more toxic Tl (III) in final products is also possible during the combustion process (Karbowska Citation2016; López-Antón et al. Citation2013). It is thus recommended to pay more attention on the subsequent treatment of fly ash since it might be piled or landfilled. In addition, the Tl speciation and stability in fly ash and its potential across-media contamination should be investigated in the future.
Supplemental Material
Download MS Word (2.5 MB)Disclosure statement
No potential conflict of interest was reported by the authors.
Supplementary material
Supplemental data for this paper can be accessed on the publisher’swebsite.
Additional information
Funding
Notes on contributors
Zhonggen Li
Zhonggen Li is an associate professor at Zunyi Normal College, his study is focused on the atmospheric emissions of trace metals from anthropogenic sources and the environmental impacts.
Xian Zhou
Xian Zhou is a Ph.D. student of Guizhou University, he’s studying on the geochemistry of toxic metals.
Qingfeng Wang
Qingfeng Wang is an associate professor at Zunyi Normal College, his research is concentrated on the emission and control of hazardous metals from industrial flue gas, and the human health from the food chain.
Xinyu Li
Xinyu Li is a Ph.D. student of Institute of Geochemistry, Chinese Academy of Sciences.
Leiming Zhang
Leiming Zhang is professor and senior research scientist of Environment and Climate Change Canada.
Dan Wang
Dan Wang is a lecturer at Zunyi Normal College, she’s studying on the landscape and the environmental impacts of heavy metals.
Tianrong He
Tianrong He is professor at Guizhou University, her research is on the geochemistry of heavy metals, and the control of contaminated lands.
Yu Cao
Yu Cao is a lecturer at Zunyi Normal College with the study area of the biogeochemistry of hazardous elements.
Xinbin Feng
Xinbin Feng is professor and director of Institute of Geochemistry, Chinese Academy of Sciences, his research is focused on the geochemistry of toxic metals.
References
- Affolter, R. H., S. Groves, W. J. Betterton, W. Benzel, K. L. Conrad, S. M. Swanson, and L. F. Ruppert. 2011. Geochemical database of feed coal and coal combustion products (CCPs) from five power plants in the United States. U.S. Geological Survey Data Series 635, pamphlet, 19 p. Accessed October 20, 2020. https://pubs.usgs.gov/ds/635/.
- Bai, X., H. Ding, J. Lian, D. Ma, X. Yang, N. Sun, W. Xue, and Y. Chang. 2018. Coal production in China: Past, present, and future projections. Int. Geol. Rev. 60 (5–6):535–47. doi:10.1080/00206814.2017.1301226.
- Belzile, N., and Y. W. Chen. 2017. Thallium in the environment: A critical review focused on natural waters, soils, sediments and airborne particles. Appl. Geochem. 84:218–43. doi:10.1016/j.apgeochem.2017.06.013.
- Bureau of statistics of Guizhou Province. 2018. Guizhou statistical yearbook. Beijing: China Statistics Press. ( In Chinese).
- Cao, Z. D. 2006. Sulfur content and its control factors in coal of northern Anluo exploration area, Guizhou province. Coal Geol. Explor. 34 (3):13–15. ( In Chinese). doi:10.1016/S1872-2040(06)60004-2.
- Chen, D., X. Liu, J. Han, M. Jiang, Y. Xu, and M. Xu. 2018. Measurements of particulate matter concentration by the light scattering method: Optimization of the detection angle. Fuel Process. Technol. 179:124–34. doi:10.1016/j.fuproc.2018.06.016.
- Chen, G., Y. Sun, Q. Wang, B. Yan, Z. Cheng, and W. Ma. 2019. Partitioning of trace elements in coal combustion products: A comparative study of different applications in China. Fuel 240:31–39. doi:10.1016/j.fuel.2018.11.131.
- Clarke, L. B., and L. L. Sloss. 1992. Trace elements–emissions from coal combustion and gasifification. London: IEA Coal Research. [ Chapter 2].
- Dai, S., D. Ren, C. L. Chou, R. B. Finkelman, V. V. Seredin, and Y. Zhou. 2012. Geochemistry of trace elements in Chinese coals: A review of abundances, genetic types, impacts on human health, and industrial utilization. Int. J. Coal Geol. 94:3–21. doi:10.1016/j.coal.2011.02.003.
- Dai, S., D. Ren, Y. Tang, M. Yue, and L. Hao. 2005. Concentration and distribution of elements in late permian coals from western Guizhou province, china. Int. J. Coal Geol. 61 (1–2):119–37. doi:10.1016/s0140-6701(06)80524-2.
- Dai, S., Y. Sun, and R. Zeng. 2006. Enrichment of arsenic, antimony, mercury, and thallium in a Late Permian anthracite from Xingren, Guizhou, Southwest China. Int. J. Coal Geol. 66:217–26. doi:10.1016/j.coal.2005.09.001.
- Dai, S. F., and R. B. Finkelman. 2018. Coal as a promising source of critical elements: Progress and future prospects. Int. J. Coal Geol. 186:155–64. doi:10.1016/j.coal.2017.06.005.
- Deng, S., Y. Shi, Y. Liu, C. Zhang, X. Wang, Q. Cao, S. Li, and F. Zhang. 2014. Emission characteristics of Cd, Pb and Mn from coal combustion: Field study at coal-fired power plants in China. Fuel Process. Technol. 126:469–75. doi:10.1016/j.fuproc.2014.06.009.
- Diehl, S. F., M. B. Goldhaber, and J. R. Hatch. 2004. Modes of occurrence of mercury and other trace elements in coals from the warrior field, Black Warrior Basin, Northwestern Alabama. Int. J. Coal Geol. 59 (3/4):193–208. doi:10.1016/j.coal.2004.02.003.
- Dziok, T., S. Andrzej, and W. Adam. 2018. Studies on mercury occurrence in inorganic constituents of polish coking coals. Environ. Sci. Pollut. Res. 26 (4):1–12. doi:10.1007/s11356-018-1667-1.
- Ewers, U. 1988. Environmental exposure to thallium. Sci. Total Environ. 71:285–92. doi:10.1016/0048-9697(88)90199-4.
- Fang, T., and Y. Liu. 2019. Equilibrium thallium isotope fractionation and its constraint on Earth’s late veneer. Acta Geochim. 38 (4):459–71. doi:10.1007/s11631-019-00344-y.
- Finkelman, R. B. 1995. Modes of occurrence of environmentally sensitive trace elements in coals. In Environmental aspects of trace elements in coals, ed. D. J. Swaine and F. Goodarzi, p. 24–50. Dordrecht: Kluwer.
- GB 31573-2015. 2015. Emission standards of pollutants for inorganic chemical industry. Issued by the Ministry of Environment, the Chinese General Administration of Quality Supervision, Inspection and Quarantine, Beijing. ( In Chinese).
- GB/T 212-2008. 2008. Proximate analysis of coal. Issued by the Chinese General Administration of Quality Supervision, Inspection and Quarantine and the Standardization Administration of China, Beijing. ( In Chinese).
- GB/T 213-2008. 2008. Determination of calorific value of coal. Issued by the Chinese General Administration of Quality Supervision, Inspection and Quarantine and the Standardization Administration of China, Beijing. ( In Chinese).
- GB/T 214-2007. 2007. Determination of total sulfur in coal. Issued by the Chinese General Administration of Quality Supervision, Inspection and Quarantine and the Standardization Administration of China, Beijing. ( In Chinese).
- Hoffman, R. S. 2000. Thallium poisoning during pregnancy: A case report and comprehensive literature review. J. Toxicol. Clin. Toxicol. 38:767–75. doi:10.1081/CLT-100102390.
- Karbowska, B. 2016. Presence of thallium in the environment: Sources of contaminations, distribution and monitoring methods. Environ. Monit. Assess. 188:640. doi:10.1007/s10661-016-5647-y.
- Kazantzis, G. 2000. Thallium in the environment and health effects. Environ. Geochem. Health 22:275–80. doi:10.1023/A:1006791514080.
- Ketris, M. P., and Y. E. Yudovich. 2009. Estimations of Clarkes for Carbonaceous biolithes: World averages for trace element contents in black shales and coals. Int. J. Coal Geol. 78 (2):135–48. doi:10.1016/j.coal.2009.01.002.
- Klein, D. H., A. W. Andren, J. A. Carter, J. F. Emery, C. Feldman, W. Fulkerson, W. S. Lyon, J. C. Ogle, Y. Talmi, R. I. van Hook, et al. 1975. Pathways of thirty-seven trace elements through coal-fired power plant. Environ. Sci. Technol. 9 (10):973–79. doi:10.1021/es60108a007.
- Li, J., and C. Sun. 2016. Evaluation of the migration of thallium, cadmium, vanadium, and chromium from a thermal power plant. Environ. Earth Sci. 75 (5):388. doi:10.1007/s12665-015-5159-z.
- Li, J., C. Zhao, Y. Huang, Y. Zhuo, and J. Li. 2019a. In-situ sulfur isotope and trace element of pyrite constraints on the formation and evolution of the Nibao Carlin-type gold deposit in SW China. Acta Geochim. 38 (4):555–75. doi:10.1007/s11631-019-00342-0.
- Li, W., and J. Zhai. 1994. Both ash and sulfur content and calorific value in Chinese steam coals. Coal convers. 17 (1):12–25. ( In Chinese with English Abstract).
- Li, X., C. Zhou, J. Li, S. Lu, and J. Yan. 2019b. Distribution and emission characteristics of filterable and condensable particulate matter before and after a low-low temperature electrostatic precipitator. Environ. Sci. Pollut. Res. 26:12798–806. doi:10.1007/s11356-019-04570-y.
- Liu, J., X. Luo, Y. Sun, D. C. W. Tsang, J. Qi, W. Zhang, N. Li, M. L. Yin, J. Wang, H. Lippold, et al. 2019a. Thallium pollution in China and removal technologies for waters: A review. Environ. Int. 126:771–90. doi:10.1016/j.envint.2019.01.076.
- Liu, S., Z. Zhang, Y. Wang, Y. Hu, W. Liu, C. Chen, Y. Mei, and H. Sun. 2019b. PM2.5 emission characteristics of coal-fired power plants in Beijing-Tianjin-Hebei region, China. Atmos. Pollut. Res. 10 (3):954–59. doi:10.1016/j.apr.2019.01.003.
- Llorens, J. F., J. L. Fernández-Turiel, and X. Querol. 2001. The fate of trace elements in a large coal-fired power plant. Environ. Geol. 40:409–16. doi:10.1007/s002540000191.
- López-Antón, M. A., D. Alan Spears, M. Díaz-Somoano, L. Diaz, and M. Rosa Martínez-Tarazona. 2015. Enrichment of thallium in fly ashes in a Spanish circulating fluidized-bed combustion plant. Fuel 146:51–55. doi:10.1016/j.fuel.2015.01.007.
- López-Antón, M. A., D. A. Spears, M. Díaz-Somoano, and M. R. Martínez-Tarazona. 2013. Thallium in coal: Analysis and environmental implications. Fuel 105 (7):13–18. doi:10.1016/j.fuel.2012.08.004.
- Maluszynski, M. J. 2009. Thallium in the environment. Ochrona Srodowiska I Zasobów Naturalnych 40:31–37.
- Meggs, W. J., R. S. Hoffman, R. D. Shih, R. S. Weisman, and L. R. Goldfrank. 1995. Thallium poisoning from maliciously contaminated food. J. Toxicol. Clin. Toxicol. 32:723–30. doi:10.3109/15563659409017979.
- Meij, R. 1994. Trace elements behavior in coal-fired power plants. Fuel Process. Technol. 39:199–217. doi:10.1016/0378-3820(94)90180-5.
- Meij, R., and H. Te Winkel. 2007. The emissions of heavy metals and persistent organic pollutants from modern coal-fired power stations. Atmos. Environ. 41 (40):9262–72. doi:10.1016/j.atmosenv.2007.04.042.
- Mokhtar, M. M., R. M. Taib, and M. H. Hassim. 2014. Understanding selected trace elements behavior in a coal-fired power plant in Malaysia for assessment of abatement technologies. J. Air Waste Manage. 64 (8):867–78. doi:10.1080/10962247.2014.897271.
- National Bureau of Statistic of China. 2019. China statistical yearbook. Beijing: China Statistics Press. ( In Chinese).
- Pavageau, M., A. Morin, F. Séby, C. Guimon, E. Krupp, C. Pécheyran, J. Poulleau, and O. Donard. 2004. Partitioning of metal species during an enriched fuel combustion experiment. Speciation in the gaseous and particulate phases. Environ. Sci. Technol. 38 (7):2252–63. doi:10.1021/es034408i.
- Pavlish, J. H., E. A. Sondreal, M. D. Mann, E. S. Olson, K. C. Galbreath, D. L. Laudal, and S. A. Benson. 2003. Status review of mercury control options for coal-fired power plants. Fuel Process. Technol. 82:89–165. doi:10.1016/S0378-3820(03)00059-6.
- Peter, A. L. J., and T. Viraraghavan. 2005. Thallium: A review of public health and environmental concerns. Environ. Int. 31 (4):493–501. doi:10.1016/j.envint.2004.09.003.
- Prick, J. J. G., W. G. Sillevis Smitt, and L. Muller. 1995. Thallium poisoning. Amsterdam: Elsevier Publishing Co.
- Qi, L., and D. C. Grégoire. 2000. Determination of trace elements in twenty-six Chinese geochemistry reference materials by inductively coupled plasma-mass spectrometry. Geostandard Geoanal. Res. 24:51–63. doi:10.1111/j.1751-908x.2000.tb00586.x.
- Querol, X., J. L. Fernández-Turiel, and A. López-Soler. 1995. Trace elements in coal and their behaviour during combustion in a large power station. Fuel 74:331–43. doi:10.1016/0016-2361(95)93464-O.
- Quick, W. J., and R. M. A. Irons. 2002. Trace element partitioning during the firing of washed and untreated power station coals. Fuel 81 (5):665–72. doi:10.1016/S0016-2361(01)00197-1.
- Ratafia-Brown, J. A. 1994. Overview of trace element partitioning in flames and furnaces of utility coal-fired boilers. Fuel Process. Technol. 39:139–57. doi:10.1016/0378-3820(94)90177-5.
- Saha, A. 2005. Thallium toxicity: A growing concern. Indian J. Occup. Environ. Med. 9 (2):53–56. doi:10.4103/0019-5278.16741.
- Saha, A., H. G. Sadhu, A. B. Karnik, T. S. Patel, S. N. Sinhá, and H. N. Saiyed. 2004. Erosion of nails following thallium poisoning: A case report. Occup. Environ. Med. 61:640–42. doi:10.1136/oem.2003.009464.
- Smolka-Danielowska, D., and D. Fiedor. 2018. Potentially toxic elements in fly ash dependently of applied technology of hard coal combustion. Environ. Sci. Pollut. Res. 25:25091–97. doi:10.1007/s11356-018-2548-3.
- Spears, D. A., and S. J. Tewalt. 2009. The geochemistry of environmentally important trace elements in UK coals, with special reference to the Parkgate coal in the Yorkshire-Nottinghamshire coal-field, UK. Int. J. Coal Geol. 80 (3–4):157–66. doi:10.1016/j.coal.2009.08.010.
- Thompson, D., and B. B. Argent. 2002. Prediction of the distribution of trace elements between the product streams of the Prenflo gasifier and comparison with reported data. Fuel 81 (5):555–70. doi:10.1016/s0016-2361(01)00150-8.
- U.S. Environmental Protection Agency. 2009a. EPA/635/R-08/001F (2009) Toxicological review of thallium and compounds (CAS No. 7440–28-0). In support of summary information on the Integrated Risk Information System (IRIS), September.
- U.S. Environmental Protection Agency. 2009b. National primary drinking water regulation table. Accessed October 17, 2020. https://www.epa.gov/ground-water-and-drinking-water/national-primary-drinking-water-regulation-table.
- U.S. Environmental Protection Agency (U.S. EPA). 1996. Test Method 5. Determination of particulate matter emissions from stationary sources.
- Viraraghavan, T., and A. Srinivasan. 2011. Thallium: Environmental pollution and health effects. Encyclopedia Environ. Health 325–33. doi:10.1016/b978-0-444-52272-6.00643-7.
- Wang, S., L. Zhang, G. Li, Y. Wu, J. Hao, N. Pirrone, F. Sprovieri, and M. P. Ancora. 2010. Mercury emission and speciation of coal-fired power plants in China. Atmos. Chem. Phys. 10:1183–92. doi:10.5194/acp-10-1183-2010.
- Wu, B., X. Bai, W. Liu, C. Zhu, Y. Hao, S. Lin, and H. Tian. 2020. Variation characteristics of final size-segregated PM emissions from ultralow emission coal-fired power plants in China. Environ. Pollut. 259:113886. doi:10.1016/j.envpol.2019.113886.
- Xiao, T., F. Yang, S. Li, B. Zheng, and Z. Ning. 2012. Thallium pollution in China: A geo-environmental perspective. Sci. Total Environ. 421–422:51–58. doi:10.1016/j.scitotenv.2011.04.008.
- Xiao, T., J. Guha, D. Boyle, C.-Q. Liu, B. Zheng, G. C. Wilson, A. Rouleau, and J. Chen. 2004. Naturally occurring thallium: A hidden geoenvironmental health hazard? Environ. Int. 30 (4):501–07. doi:10.1016/j.envint.2003.10.004.
- Xu, M., R. Yan, C. Zheng, Y. Qiao, J. Han, and C. Sheng. 2003. Status of trace element emission in a coal combustion process: A review. Fuel Process. Technol. 85:215–37. doi:10.1016/S0378-3820(03)00174-7.
- Yan, R., D. Gauthier, and G. Flamant. 2001a. Volatility and chemistry of trace elements in a coal combustor. Fuel 80:2217–26. doi:10.1016/s0016-2361(01)00105-3.
- Yan, R., D. Gauthier, and G. Flamant. 2001b. Partitioning of trace elements in the flue gas from coal combustion. Combust. Flame 125:942–54. doi:10.1016/s0010-2180(00)00239-x.
- Yang, H., Y. Zhang, C. Zheng, X. Wu, L. Chen, X. Gao, and J. S. Fu. 2018. Energy consumption and energy-saving potential analysis of pollutant abatement systems in a 1000-MW coal-fired power plant. J. Air Waste Manage. 68 (9):920–30. doi:10.1080/10962247.2018.1454992.
- Yao, S., S. Cheng, J. Li, H. Zhang, J. Jia, and X. Sun. 2019. Effect of wet flue gas desulfurization (WFGD) on fine particle (PM2.5) emission from coal-fired boilers. J. Environ. Sci. 77:32–42. doi:10.1016/j.jes.2018.05.005.
- Zhang, S., S. Dai, R. B. Finkelman, I. T. Graham, D. French, J. C. Hower, and X. Li. 2019. Leaching characteristics of alkaline coal combustion by-products: A case study from a coal-fired power plant, Hebei Province, China. Fuel 255:115710. doi:10.1016/j.fuel.2019.115710.
- Zhao, S., Y. Duan, C. Wang, M. Liu, J. Lu, H. Tan, X. Wang, and L. Wu. 2017. Migration behavior of trace elements at a coal-fired power plant with different boiler loads. Energ. Fuel 31:747–54. doi:10.1021/acs.energyfuels.6b02393.
- Zhao, Y., J. Zhang, C. L. Chou, Y. Li, Z. Wang, Y. Ge, and C. Zheng. 2008. Trace element emissions from spontaneous combustion of gob piles in coal mines, Shanxi, China. Int. J. Coal Geol. 73:52–62. doi:10.1016/j.coal.2007.07.007.
- Zhou, X., X. Y. Bi, X. Y. Li, S. Li, J. Chen, T. R. He, and Z. G. Li. 2020. Fate of cadmium in coal-fired power plants in Guizhou, Southwest China: With emphasis on updated atmospheric emissions. Atmos. Pollut. Res. 11 (5):920–27. doi:10.1016/j.apr.2020.02.004.