Article title: PM2.5 in Carlsbad Caverns National Park: Composition, sources, and visibility impacts
Authors: Lillian E. Naimie, Amy P. Sullivan, K.B. Benedict, Anthony J. Prenni, B.C. Sive, Bret A. Schichtel, Emily V. Fischer, Ilana Pollack, and Jeffrey Collett
Journal: Journal of the Air & Waste Management Association
Bibliometrics: Volume 72, Number 11, pages 1201 - 1218
DOI: http://dx.doi.org/10.1080/10962247.2022.2081634
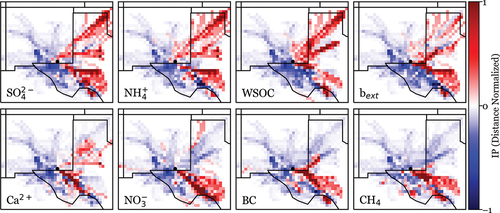
contained a scaling error in the incremental probability calculation. This error did not influence the HYSPLIT back trajectories chosen for analysis. The corrected figure, presented here, does not necessitate any changes to the discussion or conclusions in the paper. The corrected figure is presented below.
Figure 9. Incremental probability distributions are plotted for 7 species measured directly during the field campaign: SO42-, NH4+, WSOC, Ca2+, NO3−, BC, and CH4 and 1 calculated value: particle light extinction (bext). The IPs are based on 24-hr back trajectories and are distance normalized. This is done by multiplying each grid cell value by the distance from the origin site, shown as a black dot. The grid cell resolution is 0.25 degrees square.