
ABSTRACT
The number of referenda taking place in established democracies has been increasing, but oftentimes the use of referenda is controversial. This paper utilises two New Zealand national probability mail surveys collected before (2015; n = 901) and after (2016; n = 1350) the controversial flag change referendums initiated by Prime Minister John Key. We found that support for referenda increased from 54.5% in 2015 to 70.7% in 2016. We examined how demographics, party vote, political attitudes, and support for changing the flag related to change in support for referenda Younger age groups and those with moderate levels of education had larger increases in support for referenda. We did not find any evidence of ‘loser effects’ as National voters and flag change supporters were just as likely to increase in support for referenda as other voters and those opposing change, respectively. In summary, the results of this paper show that despite controversy, referenda have become more popular, especially among certain groups.
Introduction
In recent years, the use of referenda has increased in most Western democracies (Scarrow Citation2001; LeDuc Citation2003; Donovan and Karp Citation2006; de Vreese Citation2007; de Vreese and Schuck Citation2014). Notable examples include the Scottish independence referendum and the controversial ‘Brexit’ referendum, where British voters marginally supported the United Kingdom leaving the European Union (Mullen Citation2014; Goodwin and Heath Citation2016). In New Zealand (NZ), two referendums across 2015 and 2016 gave voters the option of changing the national flag, yet after considerable public consultation and debate, voters chose to keep the current design (Milne Citation2015; Satherley et al. Citation2018). Indeed, the controversy and debate caused by referenda has often not been solely over the issue at hand, but has also extended to the idea of referenda in general (Anderson and Goodyear-Grant Citation2010). As such, here we utilise data from two waves of the NZ version of the nationally representative International Social Survey Programme (ISSP); data were collected during public and media debates on the flag referendums (2015), and after the referendums (2016). We test whether public support for referenda has changed over a one-year period (Dalton et al. Citation2001; Leininger Citation2015b). Additionally, we examine whether the characteristics of those who support referenda had changed over the year of the controversial flag referendums (2015–2016), including demographics, party vote, political attitudes, and whether participants supported changing the flag.
Support for referenda
Although there is some variation across nations, the majority of people internationally tend to support referenda (Hibbing and Theiss-Morse Citation2002; Karp and Aimer Citation2002; Anderson and Goodyear-Grant Citation2005; Donovan and Karp Citation2006; Font and Fernández Citation2015; Schuck and de Vreese Citation2015; Leininger Citation2015a). Leininger (Citation2015a) analysed survey data from 25 European nations, and found levels of support for referenda ranged from 77% to 92%. Analyses using 2004 ISSP survey data found that 71% of New Zealanders supported referenda (Bowler et al. Citation2007). However, there is a possibility that support has increased over the past few of years due to the number and type of referenda taking place. Particularly, populism (the idea that society is divided into two groups: the pure people and corrupt elite; populism sides with the ‘common’ or ‘average’ people as anti-elite, anti-establishment; Mudde Citation2004) and dissatisfaction with representative democracy have been increasing over recent years, opening the possibility for ‘political disaffection’ (Inglehart and Norris Citation2016; Oliver and Rahn Citation2016; Bernauer Citation2017; Martinelli Citation2017). Increased disaffection and populism have been previously associated with support for referenda because direct democracy attempts to bypass the authority of political elites (Akkerman et al. Citation2016; Dalton et al. Citation2001; Leininger Citation2015a, Citation2015b; Martinelli Citation2017; Pauwels and Marien Citation2010).
Following the political disaffection hypothesis, support for referenda may have recently increased as voting in referenda may be a way for those disconnected with traditional, representative politics to express their opinions on issues (Dalton et al. Citation2001; Bengtsson and Mattila Citation2009). Studies show that voters are becoming increasingly disconnected with traditional electoral politics and representative democracy (both overall and across certain demographic and attitudinal characteristics; see Dalton Citation2008; Leininger Citation2015a). Although more longitudinal evidence is needed, there may have also been a recent decrease in the public trust of political authority, experts, and scientists (Forss and Magro Citation2016; Oliver and Rahn Citation2016; Bauer Citation2017). Referenda may be a way for the disaffected to engage with the political system where they may feel that representative democracy and traditional party politics are not meeting their needs (Dalton et al. Citation2001; Bengtsson and Mattila Citation2009; Leininger Citation2015b). Despite the recent well-publicised, controversial referenda, the results of these votes were generally upheld by governments, perhaps adding to the popularity of the method. Combined with a general increase in the number of referenda in many countries, past experience may have shown people that referenda provide an opportunity to be heard.
Alternatively, support for referenda may have decreased over recent years. There has been negative press around the use of referenda, particularly controversy over the results (Jackson et al. Citation2016; Lynn et al. Citation2017) and, in NZ, the financial costs (Radio New Zealand Citation2014; Little Citation2016). Past research from Denmark around the referendum on the introduction of the Euro has shown that exposure to negative coverage on referenda can affect one’s political views and increase cynicism, especially among the less politically interested or involved (de Vreese and Semetko Citation2002; Semetko and de Vreese Citation2004). In an experiment, Schuck and De Vreese (Citation2011) exposed Dutch participants to positive and negative tabloid media portrayals of referenda. They showed that negative tabloid press led people to have lower support for referenda. In summary, the negative press on recent referenda may have negatively influenced public opinion on their use.
Other research has found that support for referenda is changeable, but that this may depend on certain personal characteristics. Collingwood (Citation2012) conducted a survey experiment with American participants where the control group were exposed to a question asking for their support for direct democracy, in this case statewide ballot initiatives, then they were asked for their thoughts on specific ballot initiatives. The experimental group answered these ballot initiative questions first. That is, they were primed with these difficult issues then answered the question on direct democracy. The results were split by education and showed that having to consider the complex issues (the experimental group) first led the lower education participants to have lower levels of support for referenda. There was no difference across the control and experimental conditions for those with higher levels of education. Thus, we might expect that those with lower levels of education increase in their support for referendums after an ‘easy’ question, such as those in the flag referendums.
The flag change referendums
Since 1993 there have been two types of referenda in New Zealand: citizens-initiated or government-initiated (see Roberts Citation2016 for a summary). The first, citizens-initiated referenda, are those launched out of a successful petition of 10% of enrolled voters. Five citizens-initiated referendums have been conducted on topics relating to: the number of firefighters; the number of MPs in parliament; more punitive sentences in criminal justice; the rights of parents to physically punish their children; and whether the government should sell a minority share of some of its assets. Many of these have been controversial due to their topics, the ambiguous wording of questions, and the government not following the wishes of the people (as citizens-initiated referenda are not binding on the government). The second type of referenda are government-initiated referenda. These referenda can either be consultative (similar to a poll) or constitutional (they alter the entrenched provisions of the Electoral Act), and may be binding (meaning they enact a law when passed). Prior to the two flag referendums, there had been only two government-initiated consultative referenda. The first, as part of a government coalition deal, furthered a ballot regarding compulsory superannuation – only to be overwhelmingly rejected by the public (92%). The second ran alongside the 2011 election, and asked whether voters wanted to retain MMP (they did) and if not, which of four systems they wanted to move to. Thus, New Zealanders have experienced referenda from time-to-time, but their use has been by no means commonplace and is often controversial.
Much like the two preceding government-initiated referendums, the two sequential flag referendums had straight-forward questions. The first referendum asked New Zealanders to do just that; there was a choice of preferred alternative flag designs. A contest had run for flag designs and an interdisciplinary Flag Consideration Panel had narrowed down the options. The consideration and referendum process was widely criticised for its cost, being politicised or a ‘vanity’ project of Prime Minister John Key, and the order and process (Radio New Zealand Citation2014; Little Citation2016). The designs were widely joked about, even by international comedians, such as John Oliver, whose jokes became national headlines (Hoskinson Citation2014; Perota Citation2015). At the conclusion of the consultation process, there were four competing designs, and then five, when the popular 'red peak' design was added after an online petition obtained 50,000 signatures (Nzhistory.govt Citation2016). In November 2015 New Zealanders had the opportunity via postal ballot to select their preferred design. The Kyle Lockwood blue silver fern variation won, and then faced off against the current NZ flag in a run-off referendum in March 2016. The current NZ flag won the ballot with 56.7% of the vote.
Despite the controversy from politicians and in the media, there are reasons to believe that the experience of the flag referendums may have increased general support for referendums in New Zealand. The flag referendums were on what could be classified as an ‘easy’ issue (Carmines and Stimson Citation1980; Wojcieszak Citation2014). In contrast to ‘hard’ issues like economic policy or the constitution, it is rather easy to choose a preferred flag and this choice requires little background or technical knowledge. Although we might expect support for referenda to increase in general, we expected some groups to decrease in support for referenda. It has been suggested that referendum support may not necessarily be based on a belief in direct democracy as an idea, but rather on one’s views on the results of recent referenda (Font and Fernández Citation2015). In this paper, we test increases in support across party vote and whether one supported the flag change. Satherley et al. (Citation2018) have illustrated a ‘follow the leader’ effect in a nationally representative NZ sample after the flag referendums, wherein National Party supporters became more supportive of change after Prime Minister John Key signalled his strong support for change. Thus, we would expect ‘loser effects’ wherein support for referenda should have decreased for those who want to change the flag, and for National Party Supporters, who may seek to bolster their popular leader by decreasing in support for referenda.
Aims and hypotheses
This paper has two aims. First, we test if public support for referenda had changed over the one-year period from 2015 to 2016. We hypothesise that public support for referenda will have increased between 2015 and 2016, given that the flag referendum was an ‘easy’ issue and the government broadly listened to the will of the people. Second, we test whether any increase in support was uniform across demographic variables, vote choice, political attitudes, and support for changing the flag. Following the political disaffection hypothesis we expect support to have increased among those higher in populism and those who feel the most politically disaffected (Dalton et al. Citation2001; Bengtsson and Mattila Citation2009; Leininger Citation2015b; Greaves and Vowles Citationin press). Therefore, we expect men, ethnic minorities, those with lower levels of education and income, New Zealand First voters, and those with lower political efficacy to have had higher increases in support for referendum (relative to women, NZ Europeans, those with higher incomes and educations, other voters. and those higher in political efficacy, respectively). In addition, we expect ‘loser effects’; that is, support for referenda should be lower in those who want to change the flag, as the referendums were unsuccessful in obtaining change (Font and Fernández Citation2015). Further, we hypothesise that National voters may have lower levels of support for referenda, given that the wishes of their popular leader were not fulfilled (Satherley et al. Citation2018).
Method
Sample and procedure
The data analysed were drawn from the 2015 and 2016 NZ waves of the International Social Survey Programme (ISSP). The ISSP is an organisation of 48 nations that run cross-national surveys on different social science topics annually. Potential participants for both waves of data collection were sampled from the NZ electoral roll, which is available to scientific researchers on request. To ensure representativeness, both waves were weighted for non-response based on characteristics available on the electoral roll, including: gender, age, Māori (indigenous) descent, region, rurality, New Zealand Deprivation Index quintiles, and occupation, before analyses (see Milne Citation2016; Wu and Milne Citation2017). Thus, the results of the analyses can be considered nationally representative. A full description of the survey methods including sampling and survey questions is found in the Appendix.
Measures
Support for referenda was assessed in 2015 by asking participants to rate their agreement with: ‘Referendums are good ways to decide important political questions’ (1 strongly agree to 5 strongly disagree). In 2016, the same question read: ‘Do you think that referendums are a good way to decide important political questions?’ We tested whether support for referenda had increased more over a range of characteristics, the descriptive statistics for these variables are found in , for full descriptions of the measures please see the detailed methods in the Appendix.
Table 1. Descriptive statistics for the demographic variables by year.
As shown in , we also tested for significant differences between the 2015 and 2016 samples for these variables and found some small, but statistically significant differences. The 2016 sample was significantly more interested in politics than the 2015 sample (t(1775) = 4.04, p < .001) and had significantly higher political efficacy (t(2175) = 3.33, p = .001). Participants were significantly more supportive of changing the flag in 2015 (40.0%) than in 2016 (35.5%; χ² (1) = 4.51, p = .034).
Results
Referendum support over time
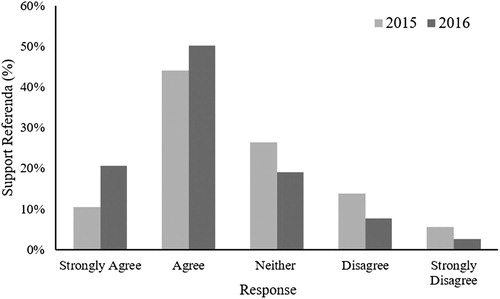
We first explored whether support for referenda had increased or decreased over time with a chi-square test. As shown in , a higher proportion of participants agreed or strongly agreed with the statement that referenda are a good way to decide political questions in 2016 (70.7%) than in 2015 (54.5%). A Chi Square test showed that the difference was significant (χ2(4) = 77.52, p < .001).
Figure 1. Support for referenda by year.
Were changes in who supports referenda driven by particular groups?
It was clear that support for referenda was higher in 2016 than 2015, but were the higher levels of support universal? The effect for year was significant (b = .700, SE = .093, Wald = 2.013, p < .001), indicating a significant difference in support across years. We used binary logistic regression models in SPSS to test the effect of year on the relationship between various demographic and attitudinal characteristics, party vote, and support for referenda as a method for answering political questions (we grouped together those who selected ‘agree’ or ‘strongly agree’ vs. neutral and disagree responses into a binary variable). Firstly, there were no significant interactions between year and any of the following variables: gender, ethnicity, voting, political left-right placement, political interest, or efficacy (see Appendix Table A1). This suggests that increases in support from 2015 to 2016 did not vary by any of these factors. To give a specific example, men and women both increased their support for referenda by similar amounts from 2015 (men = 55%, women = 54.2%) to 2016 (men = 70.4%, women= 71%). Of particular interest, the interactions for neither National voting nor supporting changing the flag were significant. This indicates that neither group became more or less supportive of referenda over one year than (a) other voter types or (b) those who did not want to change the flag.
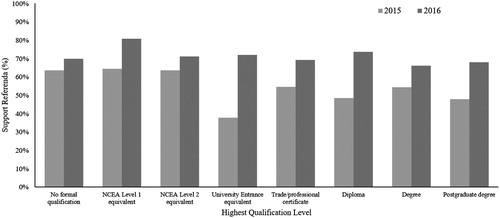
However, there were significant interactions between both age and year, and education level and year. As shown in , the age x year interaction indicated that the oldest age group (76+) had a smaller increase in support for referenda from 2015 to 2016 (from 61.2% to 66.0%) than did the youngest age group (18-30; from 48.4% to 66.9%; b = −.770, SE = .387, Wald = 3.969, p = .046). As presented in , the education x year interaction indicated that those who obtained final year secondary school qualifications as their highest level had a greater increase in support for referenda from 2015 to 2016 (from 37.9% to 72.0%) than those with no qualifications (from 63.5% to 69.9%; b = 1.167, SE = .431, Wald = 7.344, p = .007); and that those whose highest qualification was diploma below degree level had a greater increase in support for referenda from 2015 to 2016 (from 48.4% to 73.6%) than those with no qualifications (b = .823, SE = .365, Wald = 5.082, p = .022). These results suggest that the largest increases in support over this one-year period occurred in those with moderate levels of education, and those who completed secondary school but did not obtain a university degree.
Figure 2. The proportion of participants who supported referenda by year and age group.
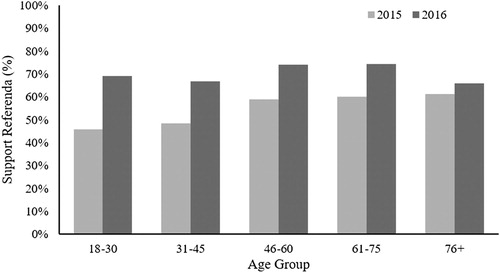
Figure 3. The proportion of participants who supported referenda by year and education level.
Discussion
In light of the controversial flag change referendums and others worldwide, we investigated if support for referenda as a way to answer political questions had changed between 2015 and 2016. We found that support for referenda was higher in 2016, as per our hypothesis. This may seem surprising to some, as there were several high-profile referenda across this period that were widely panned in the media, including the controversial and costly flag referendums in NZ (Milne Citation2015). Nonetheless, the will of the people was heard: which may have contributed to the higher level of support found in this paper. We reasoned that part of this increase may be due to a rise in political disaffection, which has previously been linked to higher support for referenda (Dalton et al. Citation2001; Pauwels and Marien Citation2010; Leininger Citation2015a, Citation2015b; Akkerman et al. Citation2016; Martinelli Citation2017).
We then sought to discover if increases in support were found across everyone, or whether certain groups drove the effects. We expected that this may be the case for those whom past work has found to be more disaffected or populist: namely, men, ethnic minorities, those with lower levels of education and income, New Zealand First voters, and those with lower political efficacy. Unexpectedly, we found that those in the oldest (76+) age group had the smallest difference in support between 2015 and 2016. This suggests that this older age groups’ views of referenda did not change as much as the other groups. Perhaps this result is attributable to the idea that older people have more crystallised, less changeable political views (Osborne et al. Citation2011; Dinas Citation2013). There were also effects across education level by year. Relative to those with less education, trade certificates, or university level education, those with moderate levels of education (who had finished secondary schooling or a low-level diploma, but not obtained a university degree) had far higher support in 2016, when compared to 2015. The recent apparent increase in populism has been associated with education. For example, the results of the Brexit referendum and the rise of Donald Trump have been attributed to the support of those with lower levels of education (Ford and Goodwin Citation2010; Goodwin and Heath Citation2016; Inglehart and Norris Citation2016; Oliver and Rahn Citation2016). Our results show that these groups may have increasing levels of support for referenda too. It may be that in recent years referenda have become more popular amongst those with lower level of education. Furthermore, this result may relate to the fact that the results of recent referenda have favoured the opinions of this group, such as the Brexit decision (Goodwin and Heath Citation2016) and retaining the NZ flag (Milne Citation2015).
We also tested for ‘loser’ effects by exploring differences across party vote. We reasoned that voters for the right-wing National party could have been less supportive due to the referendums being spear-headed by then-National Prime Minister John Key, and we expected that those who supported the flag change would be less supportive of referendums after the flag change lost. We found no significant differences in increases in support across party vote, nor was there any differences in increases for whether one supported changing the flag. Meaning there was no evidence of a ‘losers’, or ‘winners’ effect for that matter. Thus, we have shown that at least for an ‘easy’ issue, there is no evidence of a ‘losers’ effect on referendum support in the current case and context.
Finally, an important caveat here is that rather than seeing a rise in support for referenda due to disaffection and populism, participants may instead be simply returning to an earlier baseline. Bowler et al. (Citation2007) found with their analyses of 2004 ISSP data that 71% of New Zealanders agreed with the use of referenda. This result is remarkably similar to the 70.7% level of support we found in 2016. The decrease in support for referenda over this time period may be again tied to the contents of the actual referenda that took place. In the period between 2004 and 2015, two high-profile referendums took place, one on the issue of ‘smacking’ as a form of parental discipline (2009) and another on the partial sale of state owned utilities (2013) – in both cases the public took a view that was overwhelming at odds with the government of the day (continued support of smacking; against the partial sale of state owned assets; Roberts Citation2016). It may have been that the flag referendums have remedied these negative past experiences of referenda for New Zealanders.
Limitations, future research directions, and implications
The main limitation of this work is that we were not measuring change in the same sample over time. Longitudinal research with the same group of participants could help to disentangle the effect of specific campaigns or referenda and increased political disaffection. Although the samples were very similar in their composition, and we used sample weighting, there may be a confounding variable that accounts for this difference in support for referenda. Here, we used political efficacy and interest, but it has been suggested that specifically increasing dissatisfaction with the establishment/representative democracy might be driving the increase in support for referenda (Schuck and De Vreese Citation2011). Future investigations could examine dissatisfaction with democracy and rising support for referenda.
The current study was conducted in the wake of the controversial flag referendums. However, if the study was conducted in the wake of a number of ‘hard issues’ – the kind that take more effort and education to decide on, such as constitutional or economic policy issues – overall referendum support may have been lower or had support from different kinds of participants (Anderson and Goodyear-Grant Citation2010; Wojcieszak Citation2014; Fatke Citation2014). In addition, recent publicised referenda were all upheld by the governments, in the past there have been referenda that have been ignored (for example, the 1995 NZ citizen-initiated referendum to decrease the number of firefighters; Karp and Aimer Citation2002). Furthermore, the paper was limited by the question wording – the questions were set by the international secretariat – thus, we were unable to distinguish between support for New Zealand’s binding and consultative referendum types. Future research distinguishing referendum types, including views on citizens-initiated referendums, is needed.
Our analyses would have benefited from more time points of data collection. Much of the process, including public consultation and an online competition to find the competing designs, took place over the end of 2014 and start of 2015, prior to our first survey in 2015. Thus, an earlier or further, later data point on support for referenda in NZ would help to disentangle the effects of the timing of these surveys in comparison to an overall increase in referendum support. However, these results provide non-experimental support for past research (de Vreese and Semetko Citation2002; Semetko and de Vreese Citation2004; Schuck and De Vreese Citation2011) showing that public support for referenda can be altered by arguments in the media. Of course, the results we found here may be a combination of both rising disaffection and part of an increase in support post-flag referendums.
Practically, the results of the body of literature on direct democracy suggest that referenda and greater engagement with direct democracy may be a way to remedy rising disaffection with representative democracy. Studies have shown that in contexts with more opportunities for direct democracy, voters are more satisfied (Bernauer and Vatter Citation2012), trusting (Bauer and Fatke Citation2014), and that use of a combination of representative and direct democracy may be the best for public acceptance of political decisions (Towfigh et al. Citation2016). There is also the possibility that the use of referenda increases knowledge around the political issues under examination (Smith and Tolbert Citation2007). Of concern is that voter turnout has been decreasing across time in many countries, alongside other forms of civic engagement (Putnam Citation2001; Vowles Citation2017). Yet, it has been shown that referenda conducted alongside elections increases election turnout (Smith and Tolbert Citation2007; Donovan et al. Citation2009). Based on extant research, an increase in the use of direct democracy seems like a promising avenue to increase citizen engagement with politics.
Conclusion
In conclusion, this paper contributed to the literature by showing referendum support increased in NZ, despite experiencing the controversial flag referendums. In particular, those with moderate levels of education (finishing secondary school or a diploma below degree level) and younger people had the largest relative increases in support for referendums. Additionally, we showed that in the case of NZ and the flag referendums, there were no ‘loser’ effects: that is, National voters and those who support changing the flag increased their levels of support, on average. These results suggest an increase in support for direct democracy across the board, despite the controversies raised by the media, comedians, politicians and other political elites; and despite the results not being those that some groups wanted (National voters, flag change supporters). Thus, it appears referenda are on the rise in terms of both frequency of use and support in the populace. In short, our results suggest that what is important is not what was asked, but how the public were asked: the New Zealand public is (increasingly) supportive of referendums.
Disclosure statement
No potential conflict of interest was reported by the author(s).
Additional information
Funding
References
- Akkerman A, Jacobs K, Zaslove A. 2016 September. The voice of populist people? Referendum preferences, practices and populist attitudes. Paper presented at: The ECPR General Conference in Prague; Czech Republic. https://ecpr.eu/Filestore/PaperProposal/da7a7e12-cc55-4aa8-92f0-c534dcdc6d43.pdf.
- Anderson C, Goodyear-Grant E. 2010. Why are highly informed citizens sceptical of referenda? Electoral Studies. 29(2):227–238. doi: 10.1016/j.electstud.2009.12.004
- Anderson CD, Goodyear-Grant E. 2005. Conceptions of political representation in Canada: An explanation of public opinion. Canadian Journal of Political Science/Revue Canadienne de Science Politique. 38(4):1029–1058. doi: 10.1017/S0008423905040254
- Bauer MW. 2017. No time for experts? Trust in science after the BREXIT vote of 23 June 2016. In: B. Schiele, J. LeMarec, editor. Cultures de Science. Montreal, Canada: Acfas; p. 91–99. http://eprints.lse.ac.uk/78047/.
- Bauer PC, Fatke M. 2014. Direct democracy and political trust: enhancing trust, initiating distrust – or both? Swiss Political Science Review. 20(1):49–69. doi: 10.1111/spsr.12071
- Bengtsson Å, Mattila M. 2009. Direct democracy and its critics: support for direct democracy and ‘stealth’ democracy in Finland. West European Politics. 32(5):1031–1048. doi: 10.1080/01402380903065256
- Bernauer J. 2017 September. A fourth wave of populism? Trajectories of populist radical right parties in Europe, 2000–2017. Paper presented at: The 11th ECPR General Conference; Oslo, Norway. https://ecpr.eu/Filestore/PaperProposal/afb62469-c7aa-4d52-9328-2a037ac7844b.pdf.
- Bernauer J, Vatter A. 2012. Can’t get no satisfaction with the Westminster model? Winners, losers and the effects of consensual and direct democratic institutions on satisfaction with democracy. European Journal of Political Research. 51(4):435–468. doi: 10.1111/j.1475-6765.2011.02007.x
- Bowler S, Donovan T, Karp JA. 2007. Enraged or engaged? Preferences for direct citizen participation in affluent democracies. Political Research Quarterly. 60(3):351–362. doi: 10.1177/1065912907304108
- Carmines EG, Stimson JA. 1980. The two faces of issue voting. American Political Science Review. 74(1):78–91. doi: 10.2307/1955648
- Collingwood L. 2012. Levels of education and support for direct democracy. American Politics Research. 40(4):571–602. doi: 10.1177/1532673X11428805
- Dalton RJ. 2008. Direct democracy and good governance: does it matter? In: S. Bowler, A. Glazer, editors. Direct democracy’s impact on American political institutions. New York City, NY: Palgrave Macmillan; p. 149–167.
- Dalton JR, Bürklin W, Drummond A. 2001. Public opinion and direct democracy. Journal of Democracy. 12(4):141–153. doi: 10.1353/jod.2001.0066
- de Vreese CH. (Ed.). 2007. The dynamics of referendum campaigns: an international perspective. London, UK: Springer.
- de Vreese CH, Schuck AR. 2014. Political communication in referendums. In: C. Reinemann, editor. Political communication. Berlin, Germany: De Gruyter; p. 129–150.
- de Vreese CH, Semetko HA. 2002. Cynical and engaged: strategic campaign coverage, public opinion, and mobilization in a referendum. Communication Research. 29(6):615–641. doi: 10.1177/009365002237829
- Dinas E. 2013. Opening “openness to change” political events and the increased sensitivity of young adults. Political Research Quarterly. 66(4):868–882. doi: 10.1177/1065912913475874
- Donovan T, Karp JA. 2006. Popular support for direct democracy. Party Politics. 12(5):671–688. doi: 10.1177/1354068806066793
- Donovan T, Tolbert CJ, Smith DA. 2009. Political engagement, mobilization, and direct democracy. Public Opinion Quarterly. 73(1):98–118. doi: 10.1093/poq/nfp017
- Fatke M. 2014. Allure or alternative? Direct democracy and party identification. Party Politics. 20(2):248–260. doi: 10.1177/1354068813520271
- Font J, Fernández JL. 2015. Direct democracy and responsiveness: two paths towards enlarging citizens’ voices in democratic politics? Paper presented at: The Conference “Democracy: a citizen perspective”; May; Abo, Finland. http://www.abo.fi/fakultet/media/33801/fontfernandez_directdemocracyandresponsiveness.pdf.
- Ford R, Goodwin MJ. 2010. Angry white men: individual and contextual predictors of support for the British National Party. Political Studies. 58(1):1–25. doi: 10.1111/j.1467-9248.2009.00829.x
- Forss K, Magro L. 2016. Facts or feelings, facts and Feelings? The post-democracy narrative in the Brexit debate. European Policy Analysis. 2(2):12–17.
- Goodwin MJ, Heath O. 2016. The 2016 referendum, Brexit and the left behind: an aggregate-level analysis of the result. The Political Quarterly. 87(3):323–332. doi: 10.1111/1467-923X.12285
- Greaves LM, Vowles J. in press. Measuring populism in New Zealand. In: J. Vowles, J. Curtin, editor. The populist Exception? The 2017 New Zealand general election. Canberra: ANU Press.
- Hibbing JR, Theiss-Morse E. 2002. Stealth democracy: Americans’ beliefs about how government should work. Cambridge, UK: Cambridge University Press.
- Hoskinson J. (Director). 2014 August 16. Predatory churches and televangelism [Television series episode]. In J. Oliver (Executive Producer), Last week tonight. New York City, NY: HBO.
- Inglehart R, Norris P. 2016 September. Trump, Brexit, and the rise of populism: economic have-nots and cultural backlash. Paper presented at: The Annual Meeting of the American Political Science; Philadelphia, PA. https://faculty.uml.edu/sgallagher/Trump_Populism_Norris.pdf.
- Jackson D, Thorsen E, Wring D, editor. 2016. EU referendum analysis 2016: media, voters and the campaign. http://eprints.bournemouth.ac.uk/24337/1/EU%20Referendum%20Analysis%202016%20-%20Jackson%20Thorsen%20and%20Wring%20v1.pdf.
- Karp J, Aimer P. 2002. Direct democracy on trial: the citizens-initiated referendums. In: J. Vowles, P. Aimer, J. Karp, S. Banducci, R. Miller, A. Sullivan, editor. Proportional representation on trial: The 1999 New Zealand general election and the fate of MMP. Auckland, NZ: Auckland University Press; p. 146–159.
- LeDuc L. 2003. The politics of direct democracy: referendums in global perspective. ON, Canada: Broadview Press.
- Leininger A. 2015a March. Popular support for direct democracy in Europe. Paper presented at: The ECPR Joint Sessions; Warsaw, Poland. https://ecpr.eu/Filestore/PaperProposal/81025c54-6d96-42eb-99bd-d1c6769be3ac.pdf.
- Leininger A. 2015b. Direct democracy in Europe: potentials and pitfalls. Global Policy. 6(S1):17–27. doi: 10.1111/1758-5899.12224
- Little A. 2016 March 24. Andrew Little: John Key’s flag has cost New Zealand $26 m. The New Zealand Herald. http://www.nzherald.co.nz/nz/news/article.cfm?c_id=1&objectid=11611452.
- Lynn T, Rosati P, Nair B. 2017 August. Calculated vs. ad hoc publics in the #Brexit discourse on Twitter. Paper presented at: The 2017 Irish Academy of Management Annual Conference, Queen’s University, Belfast, Ireland. https://www.researchgate.net/publication/319528530_Calculated_vs_Ad_Hoc_Publics_in_the_Brexit_Discourse_on_Twitter.
- Martinelli A. 2017. Beyond Trump: populism on the rise. Chicago, IL: Edizioni Epoké.
- Milne BJ. 2015. Who wants to change the flag? Results of a national representative survey. New Zealand Sociology. 30(4):126–153.
- Milne BJ. 2016. Methods and procedures for the 2015 International Social Survey Programme (ISSP). https://cdn.auckland.ac.nz/assets/arts/research-centres/compass/documents/ISSP2015_methods_final.pdf.
- Mudde C. 2004. The populist zeitgeist. Government and Opposition. 39(4):541–563. doi: 10.1111/j.1477-7053.2004.00135.x
- Mullen T. 2014. The Scottish independence referendum 2014. Journal of Law and Society. 41(4):627–640. doi: 10.1111/j.1467-6478.2014.00688.x
- Nzhistory.govt. 2016. Red peak flag. https://nzhistory.govt.nz/media/photo/red-peak.
- Oliver JE, Rahn WM. 2016. Rise of the Trumpenvolk: populism in the 2016 election. The ANNALS of the American Academy of Political and Social Science. 667(1):189–206. doi: 10.1177/0002716216662639
- Osborne D, Sears DO, Valentino NA. 2011. The end of the solidly democratic South: the impressionable-years hypothesis. Political Psychology. 32(1):81–108. doi: 10.1111/j.1467-9221.2010.00796.x
- Pauwels T, Marien S. 2010. Populist voters and direct democracy. The silent majority in search of a voice? Paper presented at: The Politicologenetmaal, Leuven, Belgium. https://soc.kuleuven.be/web/files/11/72/W07-08.pdf.
- Perota J. (Director). 2015 November 2. American legislative exchange council [Television series episode]. In J. Oliver (Executive Producer), Last week tonight. New York City, NY: HBO.
- Putnam RD. 2001. Bowling alone: the collapse and revival of American community. New York, NY: Palgrave Macmillan.
- Radio New Zealand. 2014 October 30. Flag to cost $26 million; Prominent New Zealanders to help. http://www.radionz.co.nz/national/programmes/morningreport/audio/20155265/flag-to-cost-26-million,-prominent-new-zealanders-to-help.
- Roberts N. 2016. Referendums. Te Ara – the Encyclopedia of New Zealand. http://www.TeAra.govt.nz/en/referendums.
- Satherley N, Yogeeswaran K, Osborne D, Sibley CG. 2018. If they say “yes,” we say “no”: Partisan cues increase polarization overnational symbols. Psychological Science. 29(12):1996–2009. doi: 10.1177/0956797618805420
- Scarrow SE. 2001. Direct democracy and institutional change: a comparative investigation. Comparative Political Studies. 34(6):651–665. doi: 10.1177/0010414001034006003
- Schuck AR, De Vreese CH. 2011. Public support for referendums: the role of the media. West European Politics. 34(2):181–207. doi: 10.1080/01402382.2011.546566
- Schuck AR, de Vreese CH. 2015. Public support for referendums in Europe: a cross-national comparison in 21 countries. Electoral Studies. 38:149–158. doi: 10.1016/j.electstud.2015.02.012
- Semetko HA, de Vreese CH. 2004. Political campaigning in referendums: framing the referendum issue. London, UK: Routledge.
- Smith DA, Tolbert C. 2007. The instrumental and educative effects of ballot measures: research on direct democracy in the American states. State Politics & Policy Quarterly. 7(4):416–445. doi: 10.1177/153244000700700404
- Towfigh EV, Goerg SJ, Glöckner A, Leifeld P, Llorente-Saguer A, Bade S, Kurschilgen C. 2016. Do direct-democratic procedures lead to higher acceptance than political representation? Public Choice. 167(1-2):47–65. doi: 10.1007/s11127-016-0330-y
- Vowles J. 2017. Turnout at the macro-level. In: J. Fisher, E. Fieldhouse, M. N. Franklin, R. Gibson, M. Cantijoch, C. Wiezien, editor. The Routledge handbook of elections, voting behaviour, and public opinion. London, UK: Routledge.
- Wojcieszak M. 2014. Preferences for political decision-making processes and issue publics. Public Opinion Quarterly. 78(4):917–939. doi: 10.1093/poq/nfu039
- Wu I, Milne BJ. 2017. Methods and procedures for the 2016 International Social Survey Programme (ISSP) for New Zealand. https://cdn.auckland.ac.nz/assets/arts/research-centres/compass/documents/ISSP2016_methods_final.pdf.
Appendix
Survey methodology
Sampling and procedure
The data analysed were drawn from the 2015 and 2016 NZ waves of the International Social Survey Programme (ISSP). The ISSP is an organisation of 48 nations that run cross-national surveys on different social science topics annually. Potential participants for both waves of data collection were sampled from the NZ electoral roll, which is available to scientific researchers on request. To ensure representativeness, both waves were weighted for non-response based on characteristics available on the electoral roll, including: gender, age, Māori (indigenous) descent, region, rurality, New Zealand Deprivation Index quintiles, and occupation, before analyses (see Milne Citation2016; Wu and Milne Citation2017). Thus, the results of the analyses can be considered nationally representative.
The 2015 ISSP procedure involved a simple random sample of 2500 people and garnered a response rate of 36% (n = 901). The 2016 ISSP sampling procedure was stratified based on those demographic groups which had a lower response rate to the 2015 edition, to oversample to correct for biases in non-response. Therefore, surveys were mailed to 4075 potential participants based off a combination of four factors: age, Māori descent, gender, and Auckland residence; as younger people, Māori, men, and those living in Auckland (the largest city in NZ) showed lower response rates in 2015. The overall raw response rate for the 2016 ISSP was 33.1% (n = 1350) and the standardised response rate (the response rate if each stratum had been mailed surveys to their proportional share of the population) was 38.7%. Sample weighting was calculated individually for the 2015 and 2016 surveys and applied to all analyses to correct for systematic participant non-response and the slightly different sampling strategies employed. In both years, weighting was calculated to make sample estimates more representative of the demographics of the general population (across gender, age, Māori descent, region, rurality/urbanicity, deprivation, and occupation) and thus is consistent across samples.
Participants were sent a personalised cover letter, a survey, a return envelope, and a pen. Participants were given the opportunity to complete the survey online via Survey Monkey if they preferred (16.7% in 2015, and 18.9% in 2016). Approximately 3 weeks after the initial mailing participants were sent a reminder postcard, and around 3 weeks after the postcard they were sent a repeat mailing of the initial materials. As an incentive, participants were entered into a draw to win one of four NZ$100 gift vouchers.
Measures
The following describes the way variables were measured in 2016. Age was measured by year of birth and grouped into cohorts: 18–30, 31–45, 46–60, 61–75, and 76+. Gender was assessed with an open-ended item and coded into woman, man, or gender diverse. Participants could select multiple ethnic groups from a range of common responses or write in something else. Participants selected their total, before tax, household income from a range of options from loss or zero income to $150,000 or more. Participants were asked for their highest educational qualification. Participants were asked for which party they voted for in the last (2014) general election. We asked participants to place themselves on a left-wing (0) to right-wing (10) scale. Political interest was assessed by asking: ‘How interested are you personally in politics?’ with four options from ‘very interested’, ‘fairly’, ‘not very’, and ‘not at all interested’. Political efficacy was assessed with the item: ‘People like me don’t have any say about what the government does’ rated on a 5-point ‘strongly agree’ (1) to ‘strongly disagree’ (5) scale.
Support for changing the flag was assessed differently across years due to the timing of the flag referendums. In 2015, participants were asked: ‘There is a referendum planned for later this year on changing the New Zealand flag. Do you think New Zealand should change its flag?'. Those who selected ‘possibly, depending on the design of the new flag’ and ‘yes, I support changing the flag’ were coded as a 1 (supporting change) and those who chose ‘no, I do not support changing the flag’ were coded as a 0 (opposing change). In 2016 participants were asked if they voted ‘in the 2016 referendum on the New Zealand flag’, we grouped together the responses: ‘no, I did not vote’ with ‘yes, I voted to keep the current New Zealand flag’ as unsupportive of change (coded as 0), and coded ‘yes, I voted to change to the blue and black Silver Fern flag’ with a 1 as supporting flag change.