
 ?Mathematical formulae have been encoded as MathML and are displayed in this HTML version using MathJax in order to improve their display. Uncheck the box to turn MathJax off. This feature requires Javascript. Click on a formula to zoom.
ABSTRACT
The fermentation medium of Micromonospora Y15 was optimized to enhance the production of antimicrobial metabolites with the antimicrobial activity tested against Listeria monocytogenes. First, the optimal medium components (carbon source, nitrogen source and inorganic salt) were determined by the single factor experiment. Second, the Plackett–Burman experiment was used to screen significant factors. Third, the steepest ascent experiment was undertaken to figure out the optimal region of the significant factors. Finally, the central composite experiment was conducted to optimize the final medium components. The single factor experiment results suggested that the optimal medium components were soluble starch, beef extract, peptone, NaCl, K2HPO4, MgSO4, and FeSO4, while the Plackett–Burman experiment demonstrated that beef extract, K2HPO4 and soluble starch were significant factors affecting antimicrobial activity. The steepest ascent experiment results further showed the central point of three significant factors were 1.00 g/L of K2HPO4, 25.00 g/L of soluble starch and 18.00 g/L of beef extract, respectively. Response surface analysis revealed that the optimum values of the tested significant variables for the production of antimicrobial metabolites were 1.03 g/L of K2HPO4, 27.67 g/L of soluble starch and 18.30 g/L of beef extract, accordingly. Under this optimal condition, the antimicrobial activity of the fermented medium was 1236.79 ± 14.56 AU/mL, which increased 3.86 times compared with the initial medium. We thus concluded that the medium composition optimized in the study would be helpful for the production of antimicrobial metabolites by Micromonospora Y15.
Introduction
With the extensive use of antibiotics, pathogen resistance gradually increases. Existing antibiotics cannot deal with this situation. In order to overcome these problems, the exploration of new and potent antibiotic agents is urgently needed [Citation1]. Actinomycetes are the most critical of all micro-organisms for the production of bioactive metabolites with potential applications in human health care [Citation2,Citation3]. At present, it has been found that about 67% of antibiotics are derived from actinomycetes, with 50% from the Streptomyces, and about 75% of the commercially available antibiotic are prepared from Streptomyces metabolites [Citation3,Citation4]. The reports of novel natural products from terrestrial micro-organisms had remained almost unchanged, while those from marine micro-organisms had increased linearly over the past few years [Citation5]. It is shown that about 27% of marine micro-organisms, among which especially marine actinomycetes, can produce bioactive metabolites [Citation6]. These bioactive metabolites include aminoglycosides, anthracyclines, glycopeptides, nucleosides, polyenes, polyesters, polyketones, polypeptides and terpenoids, etc., and showed various bioactivities including anti-tumour, anti-malarial, anti-inflammatory, insecticidal, anti-oxidative, free radical scavenging property, etc. [Citation2,Citation7–10].
Micromonospora of rare actinomycetes are well known for producing many well-known antibiotics, including aminoglycoside antibiotics, gentamicin and netamicin, and they also produce anti-tumour metabolites such as anthraquinones, lomaiviticins A and B [Citation11–14]. Micromonospora is second only to Streptomyces as a source for producing new antimicrobial substances. Recently, some Micromonospora (Micromonospora sediminicola, Micromonospora kangleipakensis, Micromonospora maritima, Micromonospora avicenniae, Micromonospora equine, etc.) were discovered to produce novel antibacterial active substances (tetrocarcin, bafilolide metabolite, echinosporamicin, saquayamycin, etc.) [Citation14–17].
Our previous works showed that Micromonospora Y15 isolated from sea mud of the East China Sea had wide antimicrobial spectrum, and it could be used against 18 bacterial strains, such as L. monocytogenes, staphylococcus aureus and Aeromonas veronii [Citation18]. It also showed closest relationship with Micromonospora endolithica by 16S rRNA gene sequence analysis, which was a new species identified by Hirsch in 2004 [Citation19]. However, up till now, there has been no report about M. endolithica's ability to produce antimicrobial metabolites. Orthogonal design, artificial neural networks and response surface methodology (RSM) are common fermentation medium optimization methods, among which RSM has been widely applied in food, pharmaceutical, bioengineering, agriculture, natural product extraction and other fields [Citation20–26]. In the present study, we combined single factor experiment, Plackett–Burman experiment, steepest ascent experiment and RSM to optimize the medium components for the production of high content antimicrobial metabolites from Micromonospora Y15. The RSM, which included factorial design and regression analysis, was employed to build models to evaluate the effective factors, study their interaction and select optimum components.
Materials and methods
Micro-organism
A strain Micromonospora Y15 (Genbank accession number KU517850) with antimicrobial activity was isolated from sea mud in the East China Sea, Shanghai, China. Listeria monocytogenes ATCC 19112 was used as indictor bacteria in this paper. Both of them were stored at −20 °C in the corresponding growth medium containing a final concentration of 20% (v/v) glycerol at College of Food Science and Technology, Shanghai Ocean University, Shanghai, P. R. China.
Growth medium and culture conditions
The Micromonospora Y15 seed and initial fermentation medium (GAUZEËŠs Medium NO.1) was composed of (g/L): soluble starch 20.00, KNO3 1.00, NaCl 0.50, K2HPO4 0.50, MgSO4 0.50, FeSO4 0.01 and adjusted to pH 7.2. The indictor bacteria medium (TSB-YE), to culture L. monocytogenes ATCC 19112, was composed of (g/L): tryptone 17.00, soy peptone 3.00, yeast extract 6.00, NaCl 5.00, K2HPO4 2.50, glucose 2.50, agar 10.00 and adjusted to pH 7.3.
The Micromonospora Y15 inoculated into 250 mL erlenmeyer flasks containing 50 mL of seed medium were incubated at 28 °C in a rotatory shaker at 180 rpm for 72 h to prepare the inocula. A 4% (v/v) of inocula was added aseptically to 250 mL erlenmeyer flasks containing 100 mL of fermentation medium. The fermentation medium was incubated at 28 °C in rotary flasks at 180 rpm for 168 h (the optimal incubate conditions suggested by our previous work). The indictor bacteria were incubated at 37 °C for 12 h.
Determination of antimicrobial activity of Micromonospora Y15 metabolites
The culture of Micromonospora Y15 was harvested after incubation for 168 h, and 10 mL of fermentation broth was centrifuged at 12,000 rpm for 10 min. The supernatant was filtrated using a 0.22 µm Millipore filter to obtain a cell-free fermentation broth. A 60 μL of L. monocytogenes (108 CFU/mL) was added to a sterile plate, and then sterile TSB-YE medium was mixed with L. monocytogenes. After medium solidification, a 7 mm diameter hole was laid using sterile punch, and got indictor bacteria plate. The antimicrobial activity was detected by combing agar diffusion method with serial twofold dilution method [Citation27,Citation28]. The cell-free fermentation broth was serial twofold diluted to 2−n times (n = 0, 1, 2, 3, 4, 5, 6, 7), and then each (50 μL per well) was added to indicator bacteria plate. The potency was expressed in arbitrary units (AU/mL). One AU was defined as the reciprocal of the highest serial twofold dilution, which did not show inhibition of the indicator strain per millilitre. The potency may be described by Equation(1)(1)
(1) the following equation [Citation28]:
(1)
(1) where P is potency, which equals to the antimicrobial activity; V represents the added amount per well cell-free fermentation broth in the indictor bacteria plate, in this paper the added amount per well cell-free fermentation broth was 50 μL; n is dilution factor.
With antimicrobial activity as Y-axis and the inhibition zone diameter as X-axis, antimicrobial activity and inhibition zone diameter exponential curve can be obtained.
Single factor experiment design
The effects of carbon sources, nitrogen sources and inorganic salts on the antimicrobial activity were examined by using single factor experiments.
For carbon sources, soluble starch, glucose, mannose, lactose, sucrose, malt extract, millet powder, sodium citrate and sodium acetate were selected to evaluate the effect of carbon source on antimicrobial activity. Each of the carbon sources was added to the medium at a concentration of 1.00, 1.50, 2.00, 2.50 and 3.00 (%, w/v), respectively, and the medium was incubated under the optimal conditions.
For nitrogen sources, corn flour, soybean meal, beef extract, soy peptone, peptone, yeast extract, tryptone, KNO3, NaNO3, and (NH4)2SO4 were selected to study the effect of different nitrogen sources on antimicrobial activity. Each organic nitrogen source was added to the medium at a concentration of 1.00, 1.50, 2.00, 2.50 and 3.00 (%, w/v), respectively, each inorganic nitrogen source was added to the medium at a concentration of 0.05, 0.10, 0.15, 0.20 and 0.30 (%, w/v), respectively, and the medium were incubated under the optimal conditions.
For inorganic salts: NaCl, K2HPO4, MgSO4 and FeSO4 were selected to study the effect of amount of inorganic salt on antimicrobial activity. NaCl, K2HPO4 and MgSO4 were added to the medium at a concentration of 0, 0.05, 0.10, 0.15 and 0.20 (%, w/v), respectively, and FeSO4 was added to the medium at a concentration of 0, 0.0005 (%, w/v), 0.0010, 0.0020 and 0.0030 (%, w/v), and the medium was incubated under the optimal conditions.
The statistical analysis was performed using SPSS 20.0. Kruskal–Wallis test followed by all pairwise multiple comparisons.
Plackett–Burman experiment design
According to the above results of single factor experiments, a Plackett–Burman experimental was further used to screen the significant variables among those seven factors (soluble starch, beef extract, tryptone, NaCl, K2HPO4, MgSO4 and FeSO4) [Citation29,Citation30]. There were 11 variables, including seven fermentation medium components and four dummy variables, screened in 12 experiments. The antimicrobial activity was used as a response value. All the variables were investigated at two widely spaced intervals specified as negative values (low level, −1) and positive values (high level, 1). Levels of factor chosen and factor coded for Plackett–Burman design are given in . Four dummy variables, whose levels did not change in the design, were introduced to estimate the standard error of the population. The Design-Expert 8.0.6 software was used for Plackett–Burman experimental design and results analysis.
Table 1. Plackett–Burman experiment design and response value.
Steepest ascent experiment design
Experiments for each response were conducted along the path of the steepest ascent experiment with defined intervals by stepwise increasing or decreasing the concentrations of significant factors(K2HPO4, soluble starch and beef extract), which were determined by the coefficients of Plackett–Burman experiment results. The paths of K2HPO4, soluble starch and beef extract for the antimicrobial activity began at 1.40, 15.00 and 24.00 (g/L), with a step value of −0.20, 5.00 and −3.00 (g/L), respectively. The other non-significant factors were selected as intermediate values (7.50 g/L of tryptone, 0.02 g/L of FeSO4, 0.38 g/L of NaCl, and 0.75 g/L of MgSO4). While a maximum antimicrobial activity was found, the corresponding point would be close to the optimal parameters and could be applied as a centre point in the central composite design (CCD).
Response surface methodology design
The CCD was conducted in the optimum vicinity to locate the true optimum concentration of KH2PO4 (X4), soluble starch (X5), beef extract (X7) for antimicrobial activity. The CCD used was generated by Design-Expert 8.0.6 software. According to this design, 20 experiments were conducted containing six replications at the centre point for estimating the purely experimental uncertainty variance in triplicates. In this study, three key variables with five concentration levels were adopted (given in ). The results of CCD were used to fit a second-order polynomial [Citation20,Citation21]. The general form of the second-order polynomial EquationEquation (2)(2)
(2) was
(2)
(2) where Y is predicted response, X4, X5 and X7 are input variables; B0 is a constant; B1, B2 and B3 are linear coefficients; B12, B13 and B23 are cross product coefficients; B11, B22 and B33 are quadratic coefficients.
Statistical significance of the model equation was determined by Fisher's test (F value), and the proportion of variance explained by the model was obtained by calculating the multiple coefficients of determination R-squared value.
Validation of the experiment design
The concentrations of significant factors were selected by the forecast optimal value of the above RSM experiment results, and the concentrations of other factors were intermediate value. The medium was incubated at optimal conditions as determined above. The antimicrobial activity of Micromonospora Y15 against L. monocytogenes was measured.
Statistical analysis
All experiments were carried out in triplicates and values were expressed as means with standard deviations (±SD). The data of single factor experiment were analysed by using SPSS 20.0 statistical software. The data of Plackett–Burman experiment and RSM were analysed by using Design-Expert 8.0.6. and were drawn using Origin 8.6. was drawn using Design-Expert 8.0.6.
Figure 1. The relationship between antimicrobial activity and the diameters of inhibition zone.
Figure 2. Effects of different of carbon sources (a), nitrogen sources (b and c) and inorganic salt added amount (d and e) on the production of antimicrobial active substances.
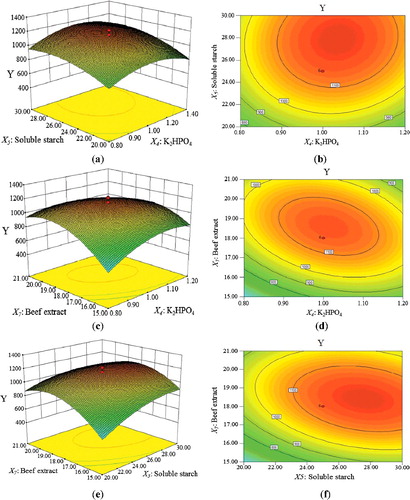
Figure 3. Response surface plots of the effects of three factors on antimicrobial activity. (a and b) Interaction of X4 (K2HPO4) and X5 (soluble starch); (c and d) interaction of X4 (K2HPO4) and X7 (beef extract); (e and f) interaction of X5 (soluble starch) and X7 (beef extract).
Results and discussion
The relationship between antimicrobial activity and diameters of inhibition zone
The relationship between the potency (antimicrobial activity) and the diameter of inhibition zone was described in . Then, the potency was counted through standard EquationEquation (3)(3)
(3) as follows:
(3)
(3) where X is diameter of inhibition zone; Y is the antimicrobial activity.
The R-squared value (R2 = 0.9995) indicated that the model could be used to describe the relationship between potency of the antimicrobial activity and inhibition zone diameter.
Optimization by single factor experiment
shows the effects of different carbon sources, nitrogen sources and inorganic salts on the antimicrobial activity. As seen from (a), of the nine carbon sources investigated, soluble starch was relatively favourable for the increased antimicrobial activity. Lactose could also promote the antimicrobial activity, but the antimicrobial activity is much weaker than using soluble starch. Glucose, mannose, sucrose, malt extract, millet powder, sodium citrate and sodium acetate showed very poor enhancing effects. Beef extract had a great role on promoting antimicrobial activity, the antimicrobial activity reached 1013.00 AU/mL with beef extract content of 20.00 g/L. The positive effects of beef extract may be caused by the requirement of a large quantity of substrate to synthesize spores, or beef extract could provide nutrients more rich and comprehensive helping to convert to antimicrobial metabolites ((b)) [Citation31]. The antimicrobial activity decreased when the beef extract concentration exceeded the limit, this may be because when the concentrations of beef extract increased, the ratio of carbon to nitrogen in the medium became too low, the bacteria did not have sufficient energy to synthesize proteins and carry out life activities, so the decrease of antimicrobial substance synthesis led to the decrease of antimicrobial activity [Citation23]. In addition, tryptone at a concentration of 10.00–20.00 g/L can help to improve antimicrobial activity, but other organic nitrogen sources could not improve the antimicrobial activity ((b)). Among the inorganic nitrogen sources, KNO3 could help to improve antimicrobial activity, but compared with the beef extract and tryptone, the percentage of enhancement was relatively poor; and (NH4)2SO4 and NaNO3 had poor results ((c)). In addition, four kinds of inorganic salts (NaCl, K2HPO4, MgSO4 and FeSO4) within a certain range of concentrations could promote antimicrobial activity, and the concentrations with highest antimicrobial activity were 0.50, 1.00, 1.00 and 0.02 g/L, respectively ((d,e)).
The results of the variance analysis on different growth factors showed that soluble starch, lactose, beef extract, peptone, KNO3, NaCl, K2HPO4, MgSO4 and FeSO4 significantly affected the antimicrobial activity (P < 0.05). However, KNO3 and lactose only show weak effects, so they were not considered as the next factors. From the above results, soluble starch, beef extract, peptone, NaCl, K2HPO4, MgSO4, and FeSO4 were chosen as the next testing factors of Plackett–Burman experiment.
Optimization by Plackett–Burman experiment
The Plackett–Burman design was used to screen the significant factors in fermentation medium. shows the Plackett–Burman experimental design and response value. shows regression analysis results of the Plackett–Burman experiments. According to the results of the regression model, P value was 0.0122 (less than 0.05) and F value was 13.46, so the model was significant and could be regressed (). The beef extract (X7) P value was 0.0014 and less than 0.01, and its effect on the antimicrobial activity was extremely significant. K2HPO4 (X4) and soluble starch (X5) P values were 0.0202 and 0.0421, respectively, both P values less than 0.05, indicating their effects on the antimicrobial activity were significant (). The remaining variables, including FeSO4 (X1), NaCl (X2), MgSO4 (X3) and tryptone (X6), had P value more than 0.05 and were considered not significant. The factors above 95% confidence level were considered as significant, therefore, beef extract, K2HPO4 and soluble starch were regarded as significant factors on the antimicrobial activity, and used for the next steepest ascent experiment design and RSM optimization. Based on our ANOVA results, a first-order polynomial EquationEquation (4)(4)
(4) was derived, which represented the antimicrobial activity as an equation of seven independent variables:
(4)
(4) where Y is the response value (antimicrobial activity).
Table 2. Regression analysis of the Plackett–Burman experiment design.
The coefficient R2 (0.9593) and R2Adj (0.8880) of the model for the antimicrobial activity indicated that the data variability could be fully explained by the model. The coefficient estimate of beef extract, K2HPO4 and soluble starch of the this model were −133.69, −63.11 and 49.78, respectively (), because positive coefficient estimate indicated the antimicrobial activities would be increased with increasing concentration of corresponding variable, while negative coefficient estimate indicated antimicrobial activities would be decreased with decreasing concentration of corresponding variable, it is clear that beef extract and K2HPO4 had negative effect on antimicrobial activity, while soluble starch had positive effect.
Optimization by steepest ascent experiment
The method of steepest ascent is a procedure for moving sequentially along the path of steepest ascent, that is, in the direction of the maximum increase (decrease) in the response [Citation32]. From , it was predicted that increasing the concentration of soluble starch (X5) while decreasing concentration of K2HPO4 (X4) and beef extract (X7) should enhance the antimicrobial activity. illustrates the experimental design and responses of the steepest ascent experiment. Regarding the result from the steepest ascent experiment it was clearly seen that the yield profile showed a maximum 1114.50 AU/mL at run 3, when K2HPO4 (X4), soluble starch (X5) and beef extract (X7) were 1.00, 25.00 and 18.00 g/L, respectively, and this optimal point was further used for centre point of CCD.
Table 3. Experimental design and results of the steepest ascent.
Optimization by response surface methodology
The CCD was employed not only to study the interactions among the three significant variables (K2HPO4, soluble starch and beef extract) but also to determine their optimal levels. The experimental data listed in are analysed through multiple regressions. The highest antimicrobial activity observed was 1224.00 AU/mL at run 14 (). In order to determine the maximal antimicrobial activity corresponding to the optimum levels of K2HPO4, soluble starch and beef extract, a second-order polynomial model was proposed to calculate the optimum levels of these variables. The second-order polynomial model for antimicrobial activity was shown in Equation(5)(5)
(5) in the following equation:
(5)
(5) where Y is the predicted antimicrobial activity, X4 is K2HPO4, X5 is soluble starch and X7 is beef extract.
Table 4. Design and result of CCD.
The results of ANOVA are shown in . The model had a very low P value (P < 0.0001), which implied that the model fitted the experimental data very significantly [Citation20,Citation21]. The fitness of the model was examined by the determination coefficient (R2 = 0.9578), which implied that the sample variation of more than 95% was attributed to the variables and only less than 5% of the total variance could not be explained by the model () [Citation30,Citation33]. The adjusted determination coefficient (R2Adj = 0.9198) confirmed the significance of the model, exhibiting a low experimental error and a well-fit regression equation [Citation20,Citation34]. The F value (1.26) and P value (0.4028) of lack-of-fit indicated that the lack-of-fit was not significantly relative to the pure error [Citation35]. All the statistical results of the models showed high accuracy and general applicability of the second-order polynomial equations, and they were adequate to describe the responses observed in the experiments. The values of P value (Prob > F) were employed to check the significance of each model term which, in turn, was of vital importance for understanding the pattern of mutual interactions between the experiment variables [Citation23]. shows that the linear terms of the independent variables including soluble starch and beef extract exerted a significant effect on the antimicrobial activity. Notably, X42, X52, X72 and X5 P < 0.001 were higher than the other effects, which demonstrated that those were the most significant variables influencing antimicrobial activity.
Table 5. Variance analysis and parameter estimation for regression equation.
The 2D contour plot and 3D response surface curve were generally the graphical representation of the regression equation (). An elliptical or saddle nature of the contour plots indicated the significance of the interactions between the corresponding variables. In the case of saddle contour plots, the optimum values were obtained at the point of intersection of lines which were formed by joining the locus [Citation36]. shows the response surface plots and corresponding contour plots for the antimicrobial activity generated by the predicted model. From the response surface plots, it was easy and convenient to understand the interactions between two nutrients and also to locate their optimum levels. It could be seen from (a,b), the maximal antimicrobial activity of 1152.67 AU/mL could be observed at 1.02 g/L of K2HPO4 and 25.59 g/L of soluble starch, while beef extract concentration was held at the zero level (18.00 g/L). The highest antimicrobial activity of 1125.99 AU/mL could be observed at 0.98 g/L of K2HPO4, 17.79 g/L of beef extract and 25.00 g/L of soluble starch ((c,d)). With 25.90 g/L of soluble starch and 18.48 g/L of beef extract, antimicrobial activity reached its highest value of 1162.21 AU/mL with K2HPO4 held at 1.00 g/L ((e,f)).
Validation of the experiment
According to EquationEquation (4)(4)
(4) , we predicted that a maximum antimicrobial activity of 1174.63 AU/mL could be achieved at 1.03 g/L of K2HPO4, 27.67 g/L of soluble starch and 18.30 g/L of beef extract. Verification experiments were accomplished by using the optimized conditions and gave a production of 1236.79 ± 14.56 AU/mL of antimicrobial activity, which were closer to the predicted response. Compared with the initial antimicrobial activity (320 AU/mL) of fermentation medium, the optimized medium improved 3.86 times. Therefore, this result corroborated the predict values and the effectiveness of the model, also indicated that the optimized medium favours the production of antimicrobial active substance.
Conclusions
In this study, statistically based experimental designs were proven to be valuable tools for optimizing medium to produce antimicrobial metabolites in suspension cultures of Micromonospora Y15. A highly efficient optimization method that coupled with single factor experiment, Plackett–Burman experiment, steepest ascent experiment and RSM was developed. The optimized concentrations of medium components were as follows (g/L): 1.03 of K2HPO4, 27.67 of soluble starch, 18.30 of beef extract, 7.50 of tryptone, 0.02 of FeSO4, 0.38 of NaCl and 0.75 of MgSO4. The antimicrobial activity could reach 1236.79 AU/mL, which was 3.86 times higher than that without optimization. The predicted values were in excellent agreement with the experimental values in validation experiments, which confirmed the accuracy of the model.
Most new actinomycetes can produce new bioactive substances such as salinosporamide A, which is a novel anticancer substance found in Salinispora, a new species of actinomycetes [Citation5,Citation37,Citation38]. Micromonospora endolithica is a new genus of Micromonospora [Citation19], which has not been reported to produce antimicrobial substances. Micromonospora Y15 has a close relationship with M. endolithica, and it has a broad inhibitory spectrum, especially against Gram-positive bacteria, indicating that its potential for further studies has a research value. We propose that the optimal medium can be adopted for the production and separation of antimicrobial substances.
Disclosure statement
No potential conflict of interest was reported by the authors.
Additional information
Funding
References
- Govindarajan G, Santhi SV, Jebakumar SR. Antimicrobial potential of phylogenetically unique actinomycete, Streptomyces sp. JRG-04 from marine origin. Biologicals. 2014;42:305–311.
- Prabavathy VR, Mathivanan N, Murugesan K. Control of blast and sheath blight diseases of rice using antifungal metabolites produced by Streptomyces, sp. PM5. Biol Control. 2006;39:313–319.
- Ramesh S, Mathivanan N. Screening of marine actinomycetes isolated from the Bay of Bengal, India for antimicrobial activity and industrial enzymes. World J Microbiol Biotechnol. 2010;25:2103–2111.
- Lee LH, Cheah YK, Sidik SM, et al. Molecular characterization of Antarctic actinobacteria and screening for antimicrobial metabolite production. World J Microbiol Biotechnol. 2012;28:2125–2137.
- Bull AT, Stach JEM. Marine actinobacteria: new opportunities for natural product search and discovery. Trends Microbiol. 2007;15:491–499.
- Hu P, Wang XQ. The research process in antibiotics from marine microbe. Food Sci. 2004;25:397–401. Chinese.
- Manivasagan P, Venkatesan J, Sivakumar K, et al. Pharmaceutically active secondary meta-bolites of marine actinobacteria. Microbiol Res. 2014;169:262–278.
- Subramani R, Aalbersberg W. Marine actinomycetes: an ongoing source of novel bioactive metabolites. Microbiol Res. 2012;167:571–580.
- Kock I, Maskey RP, Biabani MAF, et al. 1-Hydroxy-1-norresistomycin and resistoflavin methy ether: new antibiotics from marine-derived Streptomycetes. J Antibiot. 2005;58:530–534.
- Fiedler HP, Bruntner C, Riedlinger J, et al. Proximicin A, B and C, novel aminofuran anti-bioticand anticancer compounds isolated from marine strains of the actinomycete Verrucosis-pora. J Antibiot. 2008;61:158–163.
- Berdy J. Bioactive microbial metabolites: a personal view. J Antibiot. 2005;58:1–26.
- Hirsch AM, Valdés M. Micromonospora: an important microbe for biomedicine and potentially for biocontrol and biofuels. Soil Biol Biochem. 2010;42:536–542.
- Yasuhiro I, Trujillo ME, Eustoquio M, et al. Antitumor anthraquinones from an endophytic actinomycete Micromonospora lupini sp. nov. Bioorg Med Chem Lett. 2007;17:3702–3705.
- Boumehira AZ, El-Enshasy HA, Hacène H, et al. Recent progress on the development of antibiotics from the genus Micromonospora. Biotechnol Biopro E. 2016;21:199–223.
- Gao RX, Liu CX, Zhao JW, et al. Micromonospora jinlongensis sp nov. isolated from muddy soilin China and emended description of the genus Micromonospora. Antonie Van Leeuwenhoek. 2014;105:307–315.
- Ströch K, Zeeck A, Antal N, et al. Retymicin, galtamycin B, saquayamycin Z and ribofur-anosyllumichrome, novel secondary metabolites from Micromonospora sp. Tue 6368. J Antibiot. 2005;58:103–110.
- Banskota AH, Aouidate M, Dan S, et al. TLN-05220, TLN-05223, new echinosporamicin–type antibiotics, and proposed revision of the structure of bravomicins. J Antibiot. 2009;62:565–570.
- Zhang M, Wang YT, Wang LP, et al. Screening of antimicrobial actinomycetes Y15 from marine and physicochemical properties of its metabolites. Microbiol China. 2017;44:513–524. Chinese.
- Hirsch P, Mevs U, Kroppenstedt RM, et al. Cryptoendolithic actinomycetes from Antarctic sandstone rock samples: Micromonospora endolithica sp. nov. and two isolates related to Micromonospora coerulea Jensen 1932. Syst Appl Microbiol. 2004;27:166–174.
- Wang ZW, Liu XL. Medium optimization for antifungal active substances production from a newly isolated Paenibacillus. sp. using response surface methodology. Bioresour Technol. 2008;99:8245–8251.
- Miao JY, Xu MB, Guo HX, et al. Optimization of culture conditions for the production of antimicrobial substances by probiotic Lactobacillus paracasei, subsp. Tolerans FX-6. J Funct Foods.2015;18:244–253.
- Kumar M, Jain AK, Ghosh M, et al. Statistical optimization of physical parameters for enhanced bacteriocin production by L. casei. Biotechnol Bioprocess Eng. 2012;17:606–616.
- Mo JX, Wang ZG, Xu WH, et al. Enhanced production of dimethyl phthalate-degrading strain Bacillus, sp. QD 14, by optimizing fermentation medium. Electron J Biotechnol. 2015;20:244–251.
- Lee H, Song M, Hwang S. Optimizing bioconversion of deproteinated cheese whey to mycelia of Ganodermalucidum. Process Biochem.2003;38:1685–1693.
- Pinho C, Melo A, Mansilha C, et al. Optimization of conditions for anthocyanin hydrolysis from red wine using response surface methodology (RSM). J Agric Food Chem. 2011;59:50–55.
- Khajeh M, Ghanbari M. Optimization of microwave-assisted extraction procedure to determine metal in fish muscles using Box-Behnken Design. Food Anal Method. 2011;4:431–436.
- Messaoudi S, Kergourlay G, Dalgalarrondo M, et al. Purification and characterization of a new bacteriocin active against Campylobacter produced by Lactobacillus salivarius SMXD51. Food Microbiol. 2012;32:129–134.
- Parente E, Brienza C, Moles M, et al. A comparison of methods for the measurement of bacteriocin activity. J Microbiol Method. 1995;22:95–108.
- Ghanem NB, Yusef HH, Mahrouse HK. Production of Aspergillus terreus, xylanase in solid-statecultures: application of the Plackett-Burman experimental design to evaluate nutritional requirements. Bioresour Technol. 2000;73:113–121.
- Zhao JL, Wang XH, Sun WB, et al. Medium optimization for palmarumycin C13 production in liquid culture of endophytic fungus Berkleasmium sp. Dzf12 using response surface methodology. Electron J Biotechn. 2013;16:16.
- Wang NN, Li W, Yu SF, et al. Optimization of fermentation medium for bacteriocin production of L. lactis KLDS4.0325 by response surface methodology. Sci Technol Food Ind. 2016;37:137–142. Chinese.
- Shih IL, Kuo CY, Hsieh FC, et al. Use of surface response methodology to optimize culture conditions for iturin A production by Bacillus subtilis, in solid-state fermentation. J Chin Inst Chem Eng. 2008;39:635–643.
- Chen X, Li Y, Du G, et al. Application of response surface methodology in medium optimization for spore production of Coniothyrium minitans, in solid-state fermentation. World J Microb Biotechnol. 2005;21:593–599.
- Liu H, Du X, Yuan Q, et al. Optimisation of enzyme assisted extraction of silybin from the seeds of Silybum marianum by Box-Behnken experimental design. Phytochem Anal. 1990;20:475–483.
- Sharma P, Singh L, Dilbaghi N. Optimization of process variables for decolorization of Disperse Yellow 211 by Bacillus subtilis, using Box-Behnken design. J Hazard Mater. 2009;164:1024–1029.
- Murthy MSRC, Swaminathan T, Rakshit SK, et al. Statistical optimization of lipase catalyzed hydrolysis of methyloleate by response surface methodology. Bioprocess Eng. 2000;22:35–39.
- Maldonado LA, Fenical W, Jensen PR, et al. Salinispora arenicola gen. nov. sp. nov. and Salinispora tropica sp. nov. obligate marine actinomycetes belonging to the family Micromonosporaceae. Int J Syst Evol Microbiol. 2005;55:1759–1766.
- Lei XL, Hong K, Ruan JS. Micromonosporaceae and their important role in marine drug development. Biotech Bull. 2006;S1:87–90. Chinese.