
 ?Mathematical formulae have been encoded as MathML and are displayed in this HTML version using MathJax in order to improve their display. Uncheck the box to turn MathJax off. This feature requires Javascript. Click on a formula to zoom.
Abstract
Metabolic engineering of a yeast fermentation process with an intention of increasing ethanol production is a challenging engineering task since the fermentation system involves multi-enzymes and multi-substrates systems. When a certain reaction is disturbed, the other reactions are also influenced since it is a connecting system coupled with co-enzymes/co-factors which also controls the metabolic process. In this study we numerically investigate the complex system by formulating a multi-enzymes and a multi-substrate kinetic model as a tool to study system regulatory opportunities. Based on the sensitivity analysis for the maximal reaction changes, the glucose transpose is predicted to yield the largest improvement in ethanol productivity while the reaction catalysed by acetaldehyde dehydrogenase is with the highest negative effect in reducing the amount of ethanol. The existence of NAD+ and NADH affect the performance of ethanol production that shows ups and downs behaviour when the maximal activity of some enzymes is disturbed. This is due to the inverse role of NADH and NAD+ in the certain reactions whether NAD+/NADH acts as a substrate or as a product.
Introduction
In biotechnology, most genetic engineering uses metabolic techniques as a powerful tool for optimising beneficial products from microbiological metabolism. The ultimate goal is to develop optimal cellular metabolism to produce biofuels through regulation of the conversion of renewable plant biomass sources into liquid fuels [Citation1–6]. Metabolic engineering with intent to enhance cellular activities of a microbiology organism is one of the challenging problems due to the complexity of the organism’s metabolic system. Most of researchers partially studied a complex metabolic system by considering the problem with theoretical and practical aspects of metabolic engineering [Citation7–20]. For the theoretical aspects, kinetic modelling is mainly used as a tool to approach the complex problem since mathematical modelling allows us to study a complex system involving multi-enzymes and multi-metabolites that can be considered as an engineering tool to increase yield and productivity of a microorganism. As a metabolic engineering tool, enzymes can be regulated through other molecules that either increase or decrease their activity. The abundant biochemical information with free access [Citation21] supports the theoretical study of a complex system with regulatory purposes [Citation15–18,Citation22].
As a cellular metabolism with beneficial products, fermentation has been intensively studied by many researchers to find its optimal performances [Citation23–29]. Some studies were performed in term of theoretical studies using modelling approach [Citation23,Citation24,Citation26–39] with Saccharomyces cerevisiae as the most studied fermentation microorganism. Some aspects were focused to study such as investigation of glucose transport, understanding the glycolysis process, probability the appearance of oscillatory behaviour in the yeast glycolytic, study the effect of dilution rate to the dynamic of metabolites, etc. All of these theoretical studies lead to the understanding the behaviour of the complex system that probably cannot be captured through experiment. In this study, we focus on analysing the central metabolic process of a yeast cell to find the optimal regulation to enhance its metabolic product such as ethanol as much as possible. Since fermentation consists of a multiple branch metabolic pathway that interact biochemically, enzymes together with its co-enzyme became a key point in regulating the metabolic network. Here, we investigate the involvement of co-enzyme/co-factor in pyruvate and acetaldehyde branch points to predict how fluxes through microbial metabolic pathways will respond the perturbation of cellular system. As shown in several literature sources [Citation29,Citation33,Citation34], some enzymatic reactions require certain substrates and produce some products. For this type of reactions, all substrates are bound to the enzyme active site before the reaction catalysis takes place to release the products. The binding process consists of sequential reactions that can be ordered or random. Therefore, multi-substrate reactions followed by complex rate equations will be used to describe how the substrates bind and in what sequence. By investigating the existence of the second substrates as variables in the system, we numerically analyse how to increase ethanol flux by altering the maximal activity of enzymes and the total concentration of co-enzyme/co-factor in the system. Our numerical study is divided into two parts, i.e. investigate the sensitivity of ethanol production to the alteration of enzyme activity and investigate the sensitivity of ethanol production to the alteration of total the second substrates (co-enzymes/co-factors) as the new variables.
Materials and methods
Multi-substrate kinetic modelling
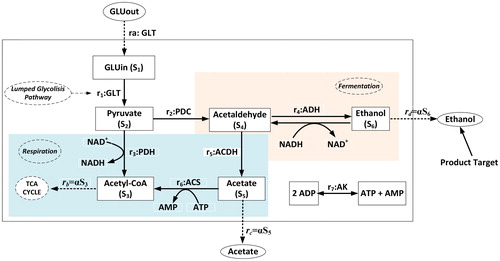
The glycolytic model of Lei et al. [Citation23] and Kasbawati et al. [Citation30–31] became the starting point of this study. It is well known that chemical reactions are basically a multi-substrate reaction in which enzymes or enzyme complexes require several cofactors or coenzymes to enhance their activity as a catalyst. A coenzyme is a substance that can help enzyme and enhance the action of enzyme. Similar to a coenzyme, a cofactor is also a substance or a non-protein chemical compound that is required by the enzyme to increase the rate of a chemical reaction. It can be considered as a helper molecule that assist the enzyme in biochemical transformation. In the central pathway of yeast cell metabolism (), some coenzymes and/or cofactors involve in each chemical reaction a phosphate group (ATP, ADP, AMP) and nicotinamide adenine dinucleotide (NAD+ and NADH). Then, it is interesting to approach the chemical reaction of each enzyme by using multi-substrate kinetic model to involve the enzyme companions.
Figure 1. Central metabolism of S. cerevisiae.
Note: Reaction r1 is a lumped process of glucose conversion to become pyruvate and reaction ri, i = 2,…,7 is a chemical conversion catalysed by: (2) pyruvate decarboxylase, (3) pyruvate dehydrogenase complex, (4) alcohol dehydrogenase, (5) acetaldehyde dehydrogenase, (6) acetyl-CoA synthetase, (7) adenylate kinase. Glucose transport (GLT) becomes the input and some products flow out of the system with dilution rate
In this study, we present ATP (), ADP (
), and AMP (
) as variables in the system to monitor their dynamics instead of using a variable for the energy-rich phosphate bond as used in [Citation34]. By using the mass action rate law, we derive the mathematical modelling of the metabolites in the central metabolism of the yeast cell as follows,
(1)
(1)
with initial conditions,
where
is the initial concentration of metabolites which is greater than or equal to zero. All branch outputs are considered as a linear output,
which are proportional to the concentration of Si in the output branch i with dilution rate
The kinetic of each reaction is derived as follow.
As seen in , the carbon metabolism of the yeast cell is started with the transport of glucose across the cell membrane through facilitated diffusion [Citation34–38]. The transport process is modelled as [Citation34]:
(2)
(2)
where GLUo and
respectively, refer to the concentration of the extracellular and intracellular glucose. A lumped reaction (
) describes the glucose uptake in the glycolysis pathway. Following the kinetic model of Kasbawati et al. [Citation30–31], the kinetic of the lumped glycolysis pathway is given as
(3)
(3)
where the maximum reaction of the lumped glucose transport is
with Michaelis constant K1. As the last product of glycolysis pathway, pyruvate (
becomes the branching point between the respiratory pathway through acetyl-CoA (
and the fermentation pathway through acetaldehyde
). Conversion of pyruvate to acetaldehyde by pyruvate decarboxylase (
) did not involve any coenzyme or cofactor such that single substrate Michaelis-Menten kinetic model is used as follows,
(4)
(4)
with maximum reaction rate
and Michaelis constants
Different from reaction
reaction
catalysed by pyruvate dehydrogenase complex needs NAD+ (
) as a cofactor. Using multi-substrate Michaelis-Mente kinetic equation, reaction
is modelled as:
(5)
(5)
with maximum reaction rate
Michaelis constants
for pyruvate, and Michaelis constants
for NAD+ (
). At the second branching point, acetaldehyde (S4) is converted to become acetate (S5) and ethanol (S6). Conversion of acetaldehyde by alcohol dehydrogenase also requires cofactor nicotinamide adenine dinucleotide in form NADH (
). According to Ganzhorn et al. [Citation40], alcohol dehydrogenase follows ordered bi-bi kinetics, with the cofactor binding first,
with For acetaldehyde dehydrogenase (
) and acetyl-CoA synthetase (
), we use the ordered bi-bi irreversible kinetic equation to include NAD+(
) and NADH(
) as the second substrate for both enzymes, respectively. The kinetic equations are
(7)
(7)
(8)
(8)
The adenylate kinase reaction (r7), which is assumed to be in equilibrium is simulated using the rapid mass action kinetics. The kinetic of adenylate kinase reaction follows the kinetic of du Preez et al. [Citation33],
(9)
(9)
A conservation relationship for the nicotinamide nucleotides and the adenine nucleotides fulfils,
+
and
+
+
(10)
where P1 and P2 are total of adenine nucleotide and nicotinamide nucleotide in the system, respectively. We assume that all model parameters are positive. Therefore, we have the mathematical model of metabolites in the central metabolism of yeast cell which takes into account effect of cofactor. The model is given in EquationEquation (1)(1)
(1) with kinetic EquationEquations (2)–(9) that fulfil (10). Before proceeding to the optimization of ethanol flux, first of all, we studied the sensitivity of ethanol flux with respect to all enzymatic reactions.
Sensitivity of steady-state ethanol production
Sensitivity of ethanol flux for reaction rates at steady state is examined to determine the extent to which a reaction in the pathway controls the steady-state of ethanol flux within the pathway. Sensitivity of ethanol flux (rd) with respect to reaction rate i is measured by
(11)
(11)
where
refers to the relatively change of rd with respect to the change of reaction rate i. We use Vi as an adjusting parameter for changing the activities of individual enzymes such that we have
(12)
(12)
with
and
Here, the non-dimensional parameter
can be considered as the percentage of interference of the maximal activity of enzyme i and
is the maximal reaction rate of the adjusted enzyme. Plus or minus sign in (12) refers to the increasing or decreasing p% of Vmax, respectively. So the adjustment of Vmax of enzyme i leads to the alteration of the ith reaction rate.
Results and discussion
Sensitivity of ethanol flux to the enzyme maximal activity
In our study, we supposed that 10% of Vmax of all enzymes are increased. Using parameter values in , we have the sensitivity results as depicted in . We can observe that glucose transport (GLT) is a reaction with the highest positive sensitivity in increasing the flux of ethanol with followed by the second and the third reactions which are catalysed by alcohol dehydrogenase (ADH) and pyruvate decarboxylase (PDC), with
and
respectively. On the other hand, acetaldehyde dehydrogenase (ACDH) is a reaction with the highest negative sensitivity which decreases ethanol flux with
followed by pyruvate dehydrogenase complex (PDH) and adenylate kinase (AK) with
and
respectively. However, although the
of PDH and AK are negative, the values are quite small to give negative effect to the ethanol production meaning that the effects are not significant in decreasing the flux of ethanol. Therefore, for 10% of enzyme regulation, ACDH is the only enzyme which gives significant effect in decreasing the flux of ethanol. This observation was also found in previous research [Citation30].
Figure 2. Sensitivity of ethanol flux to the regulation of the maximal activity of enzymes.
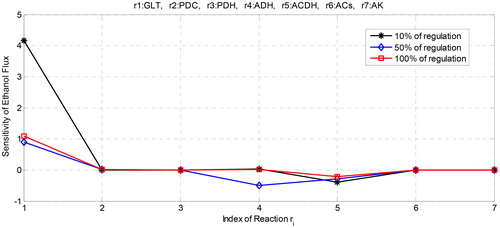
Table 1. Kinetic parameters of the model.
Then, we supposed that the maximal reaction of all enzymes is increased to 50%. We can observe that the highest positive effect still resides on the GLT with (). However, increasing the maximal reaction of GLT makes the sensitivity value decreases compared with the first regulation. If we extremely increase the maximal activity of GLT until 100% then we get the sensitivity that also increases but still below the value of the first regulation. It is interesting to find that increasing GLT does not directly increase the flux of ethanol although the glucose is the main carbo for life-supporting of the yeast cell. gives the profile of the effect of regulation of GLT to the ethanol flux. Therefore, the percentage of increasing glucose transport should be properly chosen for increasing the production of ethanol.
Figure 3. Profile of sensitivity of ethanol flux with respect to the regulation of the maximal activity of enzymes.
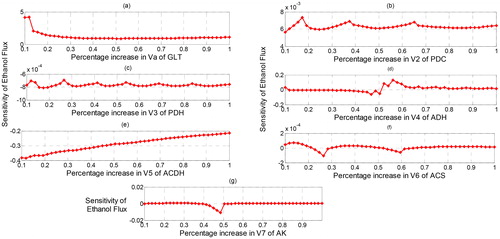
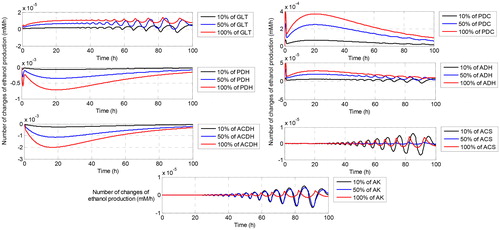
On the other hand, reaction with the highest negative effect changes from ACDH to ADH when the regulation increases to 50%. When the percentage of regulation is extremely increased to 100%, ACDH returns to be the reaction with the highest negative effect. This is probably due to ACDH is the enzyme that catalyzes the formation of acetate and ADH is the enzyme that catalyses the formation of ethanol where both reactions involve cofactor NAD + and NADH as the second metabolite. Both cofactors have different roles in which NAD + is produced by ADH, while ACDH needs NAD + as the second substrate for activated its reaction. So does for NADH where it becomes second substrate for ADH and at the same time, NADH is produced by ACDH as the second product besides ethanol. This inverse role certainly generates the fluctuation effects of both reactions to the sensitivity of the ethanol flux. As a result, controlling both reactions is an interesting challenge due to the inverse role of NAD + and NADH in both reactions. For the other reactions, the profile of their effects on the ethanol flux is shown in where PDC, PDH and ACS () have sensitivity that is quite small to the increasing or decreasing of ethanol flux. All three reactions also show fluctuation at the negative and positive small intervals of the sensitivity of ethanol flux. This is probably due to the involvement of NADH and NAD in the PDH reaction and involvement of ATP and AMP at the ACS reactions. The existence of cofactors has controlled the change of the sensitivity of ethanol flux. shows the number of changes of ethanol flux after regulation by increasing the maximal reaction of each enzyme. We can observe that some oscillations occur at the end of time observation. The oscillation refers to the ups and down the flux of ethanol due to the existence of cofactor that also influences the dynamic of ethanol flux.
Figure 4. Number of change of ethanol production after increasing the maximal activity of all enzymes.
Sensitivity of ethanol flux to the total of cofactor
In this section, we numerically investigate the effect of the existence of cofactor in controlling the flux of ethanol. As we have shown in the previous section, NAD + and NADH have an inverse role in several reactions affecting the fluctuation of the number of changes in ethanol flux and the sensitivity value. Since the cofactors have controlled the dynamic of the system, it is interesting to find the effect of the total cofactor to the production of ethanol flux. Therefore, some simulations are presented by changing the initial concentration of NAD+, NADH and ATP. The initial concentrations of these three cofactors are varied due to the involvement of NAD + as the second substrate in the reaction catalysed by PDH and ACDH, the involvement of NADH also as the second substrate in the reaction catalysed by ADH, and the involvement of ATP in ACS reaction as a second substrate.
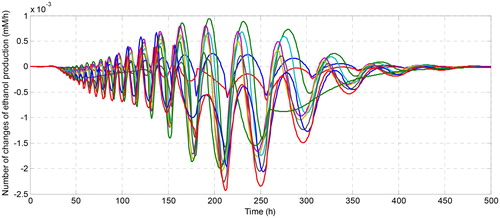
shows how the flux of ethanol is changed due to the changes in the number of the cofactor in the system. Although the number of changes in ethanol flux is quite small, their dynamic behaviour with respect to the change of time is interesting to be investigated. For instance, when we increase the concentration of NADH at the initial observation (), ethanol flux grows at the beginning of fermentation. With time, the number of change of ethanol flux coincides with the zero changes meaning that all solutions converge to the same steady-state solution even though it is started at different conditions. Conversely, when we regulate the initial concentration of NAD+, it affects the decreasing of ethanol flux even in a small magnitude. The greater the number of initial NAD+, the smaller the number of changes in ethanol flux. This is caused by the role of NADH as a substrate in the reaction that produces ethanol, while NAD + becomes the substrate in the acetate production that affects the decreasing of ethanol concentration. For the effect of the increase of the initial concentration of ATP, it can be seen in that the dynamic of the change of ethanol flux is very fluctuating in a small magnitude of flux ethanol changes. Although ATP has an effect on reducing or increasing the concentration of ethanol, the effect is not too significant due to the small effect on the change of ethanol flux. Therefore, among the involved cofactors, nicotinamide nucleotides are the cofactors that have a significant effect on the change of ethanol flux and recommended to be the target of regulation for increasing the production of ethanol as the candidate of renewable biofuel.
Figure 5. Number of change of ethanol production after increasing the initial concentration of NADH.
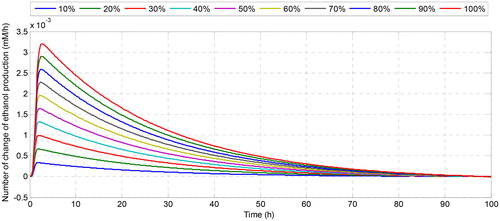
Figure 6. Number of change of ethanol production after increasing the initial concentration of NAD+.
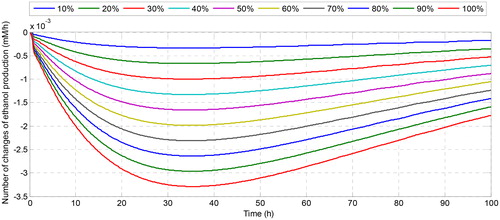
Figure 7. Number of change of ethanol production after increasing the initial concentration of ATP.
Conclusions
A numerical study was conducted by investigating the numerical solutions of a biochemically structured model of the central metabolism of the yeast cell. The structured model was formulated based on the multi-substrate kinetic model for some enzymatic reactions with sequential processes such as an ordered bi-bi for irreversible and reversible mechanisms. A regulation rule was applied to observe the sensitivity of enzymes to ethanol production and ethanol flux. It was observed that when a certain maximal activity of an enzyme was disturbed, the other reactions were affected due to the coupling of the system through the involvement of co-enzymes/co-factors from adenine nucleotide and nicotinamide nucleotide. For nicotinamide nucleotide, NAD + and NADH have a different role at the different metabolic parts. At the ADH reaction, NADH acted as a substrate that also was produced in the ACDH reaction. Conversely, NAD + acted as a substrate in ACDH reaction and at the same time, it also was produced by ADH reaction. This inverse role generated a fluctuation effect on the ethanol flux when the maximal activity of all enzymes was disturbed. As a result, controlling ADH and ACDH became an interesting challenge due to the inverse role of NAD + and NADH in both reactions. The inverse role of NADH and NAD + also generated some oscillations at the end of time observation of ethanol production. The oscillations referred to the ups and downs of the production of ethanol due to the existence of cofactor that also influenced the dynamic of ethanol flux. These observations could then be used to explore the boundaries of metabolic engineering involving orders of magnitude changes in enzyme activities and level concentration of cofactor in the system. It also guided future work to an improvement of our ability to understand the in vivo behaviour of glycolysis and fermentation on the basis of the properties of the glycolytic enzymes and the important role of the existence of the cofactors/coenzymes as the second substrate in a reaction.
Disclosure statement
No potential conflict of interest was reported by the author(s).
Additional information
Funding
References
- Chemier JA, Fowler ZL, Koffas MA, et al. Trends in microbial synthesis of natural products and biofuels. Adv Enzymol Relat Areas Mol Biol. 2009;76:151–217.
- Hanly TJ, Henson MA. Dynamic metabolic modeling of a microaerobic yeast co-culture: predicting and optimizing ethanol production from glucose/xylose mixtures. Biotechnol Biofuels. 2013;6(1):44–2019.
- Yuan S, Alper HS. Metabolic engineering of microbial cell factories for production of nutraceuticals. Microb Cell Fact. 2019; 18(1):46.
- Marella ER, Holkenbrink C, Siewers V, et al. Engineering microbial fatty acid metabolism for biofuels and biochemicals. Curr Opin Biotechnol. 2018;50:39–46.
- Li M, Schneider K, Kristensen M, et al. Engineering yeast for high-level production of stilbenoid antioxidants. Sci Rep. 2016;6(1):36827.
- Ma T, Shi B, Ye Z, et al. Lipid engineering combined with systematic metabolic engineering of Saccharomyces cerevisiae for high-yield production of lycopene. Metab Eng. 2019;52:134–142.
- Lian J, Mishra S, Zhao H. Recent advances in metabolic engineering of Saccharomyces cerevisiae: new tools and their applications. Metab Eng. 2018;50:85–108.
- Li M, Kildegaard KR, Chen Y, et al. De novo production of resveratrol from glucose or ethanol by engineered Saccharomyces cerevisiae. Metab Eng. 2015;32:1–11.
- Selim KA, El-Ghwas DE, Easa SM, et al. Bioethanol a Microbial Biofuel Metabolite. New Insights of Yeasts Metabolic Engineering. Fermentation. 2018; 4(1):16.
- Naghshbandi MP, Tabatabaei M, Aghbashlo M, et al. Progress toward improving ethanol production through decreased glycerol generation in Saccharomyces cerevisiae by metabolic and genetic engineering approaches. Renew. Sust. Energ. 2019;115:109353.
- Ji R-Y, Ding Y, Shi T-Q, et al. Metabolic engineering of yeast for the production of 3-hydroxypropionic acid. Front Microbiol. 2018;9:2185
- Song X, Li Y, Wu Y, et al. Metabolic engineering strategies for improvement of ethanol production in cellulolytic Saccharomyces cerevisiae. FEMS Yeast Res. 2018; 18(8):foy090.
- Na D, Kim TY, Lee SY. Construction and optimization of synthetic pathways in metabolic engineering. Curr Opin Microbiol. 2010;13(3):363–370.
- Kondo A, Ishii J, Hara KY, et al. Development of microbial cell factories for biorefinery through synthetic bioengineering. J Biotechnol. 2013;163(2):204–216.
- Hollinshead W, He L, Tang YJ. Biofuel production: an odyssey from metabolic engineering to fermentation scale-up. Front Microbiol. 2014;5(344). doi:10.3389/fmicb.2014.00344. [cited 18 Dec. 2019].
- Cameron DC, Chaplen FW. Developments in metabolic engineering. Curr Opin Biotechnol. 1997;8(2):175–180.
- Nielsen J. Cellular and metabolic engineering. Biotechnol Bioeng. 1998;58(2-3):125–132.
- Stephanopoulos G. Metabolic fluxes and metabolic engineering. Metab Eng. 1999;1(1):1–11.
- Stephanopoulos G, Sinskey AJ. Metabolic engineering methodologies and future prospects. Trends Biotechnol. 1993;11(9):392–396.
- Kern A, Tilley E, Hunter IS, et al. Engineering primary metabolic pathways of industrial micro-organisms. J Biotechnol. 2007;129(1):6–29.
- Schomburg I, Schomburg CA, Brenda D. enzyme data and metabolic information. Nucleic Acids Res. 2002;30(1):47–49.
- Cameron DC, Tong IT. Metabolic engineering: techniques for analysis of targets for genetic manipulations. An overview. Appl Biochem Biotechnol. 1993;38(1-2):105–140.
- Lei F, Rotboll M, Jorgensen SB. A biochemically structured model for Saccaromyces cerevisiae. Biotechnol. 2001;88(3):205–221.
- Kasbawati, Samsir R, Sulfahri, et al. Determining an appropriate unstructured kinetic model for batch ethanol fermentation data using a direct search method. Biotechnol Biotechnol Equip. 2018;32(5):1167–1173.
- Souza ACM, Mousaviraad M, Mapoka KOM, et al. Kinetic modeling of corn fermentation with S. cerevisiae using a variable temperature strategy. Bioengineering (Basel. 2018;5(2):16–34.
- Kasbawati, Kalondeng A, Aris N, et al. A kinetic modelling of enzyme inhibitions in the central metabolism of yeast cells. J. Phys. Conf. 2018;979:012066. [cited 16 Dec. 2019]
- Postma E, Verduyn C, Scheffers WA, et al. Enzymic analysis of the crabtree effect in glucose-limited chemostat cultures of Saccharomyces cerevisiae. Appl. Environ. Microbiol. 1989;55(2):468–477.
- Pronk JT, Steensma HY, Van Dijken JP. Pyruvat metabolism in Saccharomyces cerevisiae. Yeast. 1996;12(16):1607–1633.
- Rizzi M, Theobald U, Querfurth E, et al. In vivo investigations of glucose transport in Saccharomyces cerevisiae. Biotechnol Bioeng. 2000;49(3):316–327.
- Kasbawati, Gunawan AY, Hertadi R, et al. Metabolic regulation and maximal reaction optimization in the central metabolism of a yeast cell. AIP Conf Proc. 2015;1651:75–85.
- Kasbawati, Gunawan AY, Sidarto KA, et al. A new strategy of glucose supply in a microbial fermentation model. AIP Conf. Proc. 2015;1677(1):030015.
- Kasbawati, Gunawan AY, Sidarto KA. Washout and non-washout solutions of a system describing microbial fermentation process under the influence of growth inhibitions and maximal concentration of yeast cells. Math Biosci. 2017;289:40–50.
- Du Preez FB, van Niekerk DD, Kooi B, et al. From steady-state to synchronized yeast glycolytic oscillations i: model construction. FEBS Journal. 2012;279(16):2810–2822.
- Teusink B, Passarge J, Reijenga CA, et al. Can yeast glycolysis be understood in terms of in vitro kinetics of the constituent enzymes? testing biochemistry. Eur J Biochem. 2000;267(17):5313–5329.
- Smits HP, Smits GJ, Postma PW, et al. High-affinity glucose uptake in Saccharomyces cerevisiae isnot dependent on the presence of glucose-phosphorylating enzymes. Yeast. 1996;12(5):439–447.
- Kotyk A. Mobility of the free and of the loadedmonosaccharide carrier in Saccharomyces cerevisiae. BBA-Gen Subjects. 1967;135(1):112–119.
- Lang JM, Cirillo P. Glucose transport in a kinaselessSaccharamyces cerevisiae mutant. J. Bacteriol. 1987;169(7):2932–2937.
- Kasbawati A, Kalondeng A, et al. Mathematical study of feedback inhibition effects on the dynamics of metabolites on the central metabolism of a yeast cell: a combination of kinetic model and metabolic control analysis. Biotechnol Biotechnol Equip. 2019;33(1):1126–1137.
- Fuhrmann GF, Völker B, Sander S, et al. Kineticanalysis and simulation of glucose transport in plasma membranevesicles of glucose-repressed and derepressed Saccharomycescerevisiae cells. Experientia. 1989;45(11-12):1018–1023.
- Ganzhorn AJ, Green DW, Hershey AD, et al. Kinetic characterization of yeast alcohol dehydrogenases. J. Biol. Chem. 1987;262(8):3754–3761.