
Abstract
Large-scale production of thiocyanate (SCN-) for industrial purposes has led to widespread environmental pollution by this compound. Thiocyanate (SCN-) is toxic for humans and recalcitrant to biological oxygenation and hydrolysis. Phytoremediation is an effective technique for disposal of SCN- because thiocyanate (SCN-) can be assimilated by many plants from contaminated water and soil. In this study, we demonstrate that Thermosynechococcus elongatus BP-1 glutathione S-transferase (TeGST) is a good candidate gene for enhancing phytoremediation of thiocyanate (SCN-) in the plant. Our study demonstrated that Arabidopsis thaliana introduced with the glutathione S-transferase (GST) gene were able to germinate and grow in a medium containing 5 mmol L−1 thiocyanate (SCN-), which was lethal for wild-type plants. Moreover, the GST can confer the capacity of plants to remove more thiocyanate in vivo. Our results suggest that grafting the T. elongatus BP-1 glutathione S-transferase (TeGST) gene into plants is a potentially effective strategy to enhance phytoremediation of environmental thiocyanates. To our knowledge, this is the first study on the degradation of guanidine isothiocyanate by transgenic plants.
Introduction
Thiocyanate (SCN-) containing compounds are widespread pollutants in the environment. They are produced in various industrial processes, such as gold extraction, photofinishing, pesticide production, dyeing, and electroplating [Citation1, Citation2]. In gold extraction wastewaters, the thiocyanate concentrations of up to 17 mmol·L −1 were detected [Citation3, Citation4]. The concentration of thiocyanate in others industrial wastewaters was 0.09-2 mmol·L −1 [Citation5]. Several previous studies have shown that thiocyanates can be produced naturally in plants, and that organisms capable of degrading thiocyanates are widely distributed [Citation6, Citation7]. SCN- is characterized by a high degree of toxicity as it has a strong binding tendency to protein and causes inhibition of halide transport [Citation8–10]. It also acts as a non-competitive inhibitor to block a variety of enzymatic reactions [Citation11–13]. SCN- in water in a concentration of 90 mg L−1 is associated with toxicity to fish and sudden death syndrome in freshwater trout, and in concentrations at or below 85 mg L−1, with fish embryo deformities [Citation14, Citation15]. In humans, SCN- exposure affects the central nervous system causing irritability, nervousness, hallucinations, psychosis, mania, delirium and convulsions [Citation9]. Due to the strong toxicity of to human and environmental health, the removal of thiocyanate from contaminated ecosystems is of great importance. There are various methods to treat thiocyanate-contaminated water, such as adsorption, ion exchange, solvent extraction, oxidation and biodegradation [Citation16]. Chemical methods will, however, produce hazardous waste and create secondary pollution [Citation17]. For example, the biomass of microorganisms was increased by adding PO43-, thereby promoting the degradation of thiocyanates [Citation4]. Although this method will accelerate the degradation of thiocyanate to a certain extent, PO43- introduced in the degradation process will infiltrate into the water and cause phosphorus enrichment in the water, resulting in secondary pollution. However, numerous studies on the biological removal of thiocyanates have been conducted in the past, and several thiocyanate-degrading species, such as representatives of Arthrobacter, Bacillus, Escherichia, Klebsiella, Methylobacterium, Pseudomonas and Thiobacillus, have been identified [Citation18, Citation19]. Thiocyanate hydrolytic enzyme, the main enzyme to initiate the degradation of thiocyanate, was found in the bacterium Thiohalophilus thiocyanoxidans. Under anaerobic conditions, thiocyanate hydrolase hydrolyzes thiocyanate to produce sulphide and ammonia with carbonyl sulphide as intermediate [Citation20].
Phytoremediation, using vegetation to remove, detoxify, or stabilize persistent pollutants, is a tool that is increasingly being accepted for decontamination of polluted soil and water [Citation21]. It is a low cost and environmentally friendly method of removing environmental contaminants [Citation22, Citation23]. However, the utility of phytoremediation is limited if the plants are not able to degrade high concentrations of pollutants. Therefore, introducing genes that degrade pollutants into plants is an effective method to enhance the phytoremediation of pollutants [Citation24, Citation25]. For example, Doty et al. [Citation26] found that the transfection of mammalian cytochrome P450 2E1 gene into plants could promote the metabolism of halogenated hydrocarbons. In addition, Rugh et al. [Citation27] inserted bacterial merA gene into yellow poplar (Liriodendron tullpifers) to enhance the accumulation of mercury.
When the organism is subjected to stress caused by xenobiotics, the cell will produce a variety of defense mechanisms to cope with environmental changes. This is the key for organisms to survive and reproduce in the presence of pollutants. GSTs are a group of small proteins (200-250 amino acids) that are normally activated when cells are subjected to oxidative damage and/or exposure to toxic environments [Citation28]. It is a multifunctional enzyme located in the cytoplasm of the cyanobacteria cell [Citation29]. GST catalyzes the conjugation of reduced glutathione (GSH) to hydrophobic toxins. Binding compounds can increase the dissolution of toxins and facilitate their excretion [Citation30]. Studies have shown that GSH mainly protects cells from oxidative stress in cyanobacteria. In cyanobacteria, GSH levels rise rapidly when cells are subjected to oxidative stress [Citation31]. Studies have shown that the catalase activity in plant tissues decreased by 65% in the presence of 0.1 mol L−1 of NH4SCN, leading to the oxidative stress of plants [Citation32]. Therefore, the glutathione transferase gene of cyanobacteria was introduced into A. thaliana to reduce the oxidative stress and improve the tolerance of A. thaliana.
In the past, many transgenic plants overexpressing GST have been used to degrade pollutants in the environment. For example, transgenic tobacco plants overexpressed glutathione S-transferase I (GSTI) can be used for phytoremediation of chloroacetanilide herbicides phytoremediation [Citation33]. Overexpression of GST in Brassica juncea can enhance the tolerance to organic pollutants [Citation33–35]. Although there are many reports on phytoremediation of persistent organic pollutants (POPs) using transgenic plants overexpressing of GSTs, to our knowledge there are not any previous studies on enhancing phytoremediation of SCN- by overexpression of GST.
However, previous studies have shown that Thermosynechococcus elongatus BP-1 has higher tolerance and ability to remove POPs [Citation29, Citation36]. This study aimed to test the potential for transgenic A. thaliana expressing the glutathione transferase gene from T. elongatus BP-1 (TeGST; GenBank BA000039.2) in order to increase its tolerance, removal and absorption of SCN- from aqueous media. Guanidine thiocyanate has been widely used as an additive in solar cells [Citation37]. It was chosen as the model thiocyanate in this research due to environmental pollution caused by the waste of solar cells.
Materials and methods
Chemical synthesis and sequence analysis of the TeGST gene
To facilitate the expression of TeGST (GenBank BA000039.2), we synthesized and modified the TeGST gene according to the codon preference of the plant using a PCR-based two-step DNA synthesis (PTDS) method [Citation38]. The primers were forward (5′-GCAGCAGCACAAGTCTATCAG-3′) and reverse (5′-ACGTGGGTAGTTTGGGAAGAC -3′). MEGA7.0 neighbor-joining (NJ) was utilized for phylogenetic analysis of the TeGST nucleotide sequence.
Plasmid construction and characterization of transgenic A. thaliana
To express the TeGST gene in A. thaliana, the synthesized TeGST gene was inserted into a plant binary expression vector of pCAMBIA -1301 (Takara, Japan) at BamHI and SacI sites. The plasmid containing the TeGST gene was introduced into Agrobacterium tumefaciens GV3101 by electroporation and then transferred into A. thaliana by the floral dip method [Citation39]. The plant material was cultured according to Liao et al. [Citation40]. Plants were self-crossed and T3 homozygous lines were selected via segregation analysis on Murashige and Skoog (MS) medium (Beijing Zhongchuang Hongda Technology Co., Ltd., China) containing 50 mg L−1 hygromycin, 2.0% w/v sucrose and 0.8% w/v agar.
To study the expression of the TeGST gene in transgenic plants, reverse transcription (RT-PCR) was used to analyse the TeGST gene transcription, and three-week old A. thaliana plants were harvested to analyze the positive transformants. A total of 150 mg pooled tissue from A. thaliana was flash frozen immediately by immersion in liquid nitrogen and transferred in 400 µL of buffer R-1 (Axygen Scientific, USA). Total RNA from pooled tissue was extracted using a Multisource Total RNA Miniprep kit (Axygen Scientific, USA) according to the manufacturer’s instructions and then the samples were digested with DNase I (Promega, Madison, WI, USA) immediately to remove genomic DNA.
The first strand of cDNA was synthesized using 5 μg of total RNA as a template for the Reverse Transcription System (Promega, Madison, WI, USA). Reverse transcription was performed for 1 h at 42 °C in a final reaction volume of 20 µL containing 5 µg of the purified total RNA, 4 µL of 5× reaction buffer (Promega, Madison, WI, USA), 5 µL of dNTPs (each 2 mmol L−1), 2 µL of 10 µmol L−1 oligo(dT)15 primer, 0.5 µL of RNasin® RNase Inhibitor (40 U µL−1; Promega), and 1 µL of Moloney murine leukaemia virus reverse transcriptase (200 U µL−1; Promega). First-strand cDNAs were diluted by the addition of 80 µL of ultra-purified water.
The positive transformant was detected by semi-quantitative RT-PCR. The TeGST gene fragment (300 bp) was amplified by PCR using the specific oligonucleotide primers TeGSTZ (5′-GCAGCAGCACAAGTCTATCAG-3′) and TeGSTF (5′-TGCACCCATCAAACCCTTCTG-3′). The semiquantitative RT-PCR was operated under the following conditions: 94 °C for 10 min, 34 cycles of 94 °C for 35 s, 54 °C for 30 s, and 72 °C for 30 s, plus a final extension at 72 °C for 10 min (Bio-Rad, Mini Option TM, CA, USA). The A. thaliana actin gene (AtActin2, GenBank number: U41998) was amplified as an internal standard using the oligonucleotide primers (AtAc2Z1: 5′-GCA CCCTGTTCTTCTTACCGAG-3′and AtAc2F1: 5′-AGTAAGGTCACGTCCAGCAAGG-3′), PCR reaction was carried out in 30 cycles of 94 °C for 15 s, 56 °C for 15 s, 72 °C for 15 s, plus a final extension at 72 °C for 5 min. PCR amplification products were separated by agarose gel electrophoresis (1%).
The intensity ratio of the bands corresponding to the TeGST gene and the A. thaliana actin gene was analyzed by Shine Tech Gel Analyzer (Shanghai Shine Science of Technology Co., Ltd., China). The same results were obtained for three independent experiments. Therefore, only the result from one experiment is presented.
In quantitative real-time PCR analysis, the cDNA was amplified using SYBR Premix Ex-Taq (TaKaRa, Dalian, China) using a Mini Opticon real-time PCR System (Bio-Radd Laboratories, CA, USA). Total RNA isolation and reverse transcription were performed as described above for Semi-quantitative RT-PCR. The reaction mixture contained 4 μL of cDNA, 10 μL of 2× SYBR buffer (TaKaRa, Dalian, China), 0.2 μL of each oligonucleotide primer (TeGSTZ:5′-GCAGCAGCACAAGTCTATCAG-3′ and TeGSTF: 5′-TGCACCCATCAAACCCTTCTG-3′; AtAc2Z1: 5′-GCACCCTGTTCTTCTTACCGAG-3′and AtAc2F1: 5′-AGTAAGGTCACGTCCAGCAAGG-3′) and 5.6 μL of PCR-grade water. The qPCR amplification was performed with 1 cycle of preheating at 95 °C for 10 s, 40 cycles of three steps (melting at 94 °C for the 30 s, annealing at 54 °C for 30 s and extension at 72 °C for 30 s). The amplification was followed by melting curve analysis with 71 cycles of dissociation; from 95 °C to 60 °C with a temperature ramp of 0.5 °C every 30 s. The products were held at 4 °C after the melting curve analysis.
The amplification of the target genes was monitored every cycle by SYBR-green fluorescence. Ct (threshold period) was defined as the PCR cycle during which a statistically significant increase in reported fluorescence was detected for the first time, and was used to measure the starting copy numbers of the target gene. The relative quantity of the target gene expression level was performed using a 2-DDC(t) method. The experiments were repeated three times under the same condition and one of them was presented. PCR amplification products were separated by agarose gel electrophoresis (1%) and bands of segments stained with ethyl bromide, visualized under ultraviolet light. The intensity ratio of TeGST gene and A. thaliana actin gene was analyzed by Shine Tech Gel Analyzer (Shanghai Shine Science of Technology Co., Ltd., China).
Plant resistance assay
To investigate the tolerance to guanidine thiocyanate, seeds from wild-type (WT) and transgenic A. thaliana lines (TG1 and TG2) were stratified for 2 days at 4 °C to break seed dormancy and then grown on an MS medium agar plate containing with 2.0% w/v sucrose, 0.8% w/v agar and guanidine thiocyanate (0, 1, 3 and 5 mmol L−1) at a light intensity of 110-120 µmol photons m−2 s−1 at 22 °C (16/8 h day/night). After a 14-day treatment period, pictures were taken, relative root lengths were calculated, the seedlings were collected and their fresh weight was measured. Three replicates were performed for each experiment. Then, A. thaliana germination tolerance was tested. As described above, WT and TG1 and TG2 seeds were grown on medium containing different concentrations of guanidine thiocyanate (0, 5 and 10 mmol L−1), and germination was measured on day 2, 3 and 4. Two replicates were performed for each experiment.
Detection of thiocyanate using HPLC
To evaluate the effect of TeGST on plant absorption of thiocyanate, the 10 days-old A. thaliana seedlings (TG1, TG2 and WT) were transferred to 50-mL conical flasks containing 4 mmol L−1 guanidine thiocyanate. Under the same conditions, no plants were added in the blank control. Blank control was taken and medium samples were collected at different time points (1, 2 and 3 days) for HPLC study. Three replicates were performed for each experiment. The relative content of guanidine thiocyanate in the medium was determined by HPLC. Samples were analyzed by Agilent 1100 HPLC using an Agilent Eclipse XDS-C18 column (Agilent, USA). Acetonitrile and H2O in 5:95 (v/v) proportions were used as the eluant at a flow rate of 0.5 mL min−1. A total of 20 µL aliquot for each sample was injected into the column. The constituents eluting from the column were detected at 238 nm using a diode array detector. Guanidine thiocyanate was identified based on the retention time. The raw peak areas were converted into concentrations through a standard curve.
Assay of glutathione S-transferase activity
The activity of TeGST enzyme was determined in vitro by extracting crude protein from leaves. Leaves from 4-week-old transgenic 1 plants (TG1), transgenic 2 plants (TG2) and wild-type plant (WT) lines (0.5 g fresh weight) were ground to a fine powder, placed in a 1.5 mL Eppendorf centrifuge tube with liquid nitrogen, and 50 mmol L−1 sodium phosphate buffer solution (pH 7.0) incubated on ice for 30 min. The plant tissue cells were treated by multi-sample tissue fragmentation apparatus. Cell debris was then removed by centrifugation (Beckman Coulter, Microfuge® 20 R, CA, USA) at 12,000rpm for 20 min at 4 °C. The supernatant was used as the crude enzyme extract.
Total protein concentration was determined by the Bradford method [Citation41]. The assay mixtures (1 mL) contained 500 μL crude enzyme extract and 10 μL guanidine thiocyanate (0.1 mol L−1). The blank control had only water and guanidine thiocyanate. After incubation at 30 °C for 10 min, sodium guanidine thiocyanate residues were analyzed by High-Performance Liquid Chromatography (HPLC).
GST can catalyze the binding of reduced glutathione GSH to 1-chloro-2,4 dinitrobenzene (CDNB) at 25 °C. The peak absorption wavelength of the binding product was 340 nm, and the activity of GST was determined by measuring the rise rate of absorbance at 340 nm [Citation42]. Reaction mixture contained 0.45 mL of 0.1 mol L−1 phosphate buffer (PBS), 0.05 mL of 0.01 mol L−1 GSH, 0.4 mL of 1.25 mmol L−1 CDNB and plant samples solution (plant samples with fresh weight of 0.2 g were ground with liquid nitrogen and then were added 0.7 mL of PBS).The supernatant was obtained by low-temperature centrifugation (final volume 1 mL). The blank reaction mixture (without enzyme) contained 0.55 mL of 0.1 mol L−1 phosphate buffer (PBS), everything else was the same. The enzyme reaction was initiated by CDNB; an increase in absorbance was read at 340 nm, 1 min. The activity was calculated using the extinction coefficient of 9.6 × 10³ L mol−1 cm−1. One unit of the activity is defined as the quantity of GST that produces 1 mol of ammonia per minute.
Statistical analysis
Significant differences between treatment effects were analyzed using one-way analysis of variance (ANOVA) and two-way ANOVA by SPSS software (ver. 17.0, SPSS Inc., Chicago, IL, USA). Values marked with different letters represented significant differences between the experimental groups (one-way ANOVA and two-way ANOVA, p<0.05). Each experiment was repeated three times. Data are presented as mean values with standard deviation (± SD).
Results and discussion
Homology analysis of TeGST to GST from other species
TeGST cDNA with a full length of 573 bp was amplified from cyanobacteria cDNA, using a pair of adapter primers containing the BamHI and SacI sites. Cloned fragments were confirmed by sequencing. The open reading frame of TeGST was 561 bp, and encoded 186 amino acids. Sequence alignment was done and phylogenetic tree analysis of TeGST and its homologous genes is shown in . The phylogenetic tree analysis showed that Thermosynechococcus elongatus (BA000039.2) has a closer relationship (homology) to Thermosynechococcus vulcanus (AP018202.2) and Synechocystis sp. PCC 6714 (CP007542.1) than to other homology genes.
Figure 1. Phylogenetic analysis of the TeGST gene with the GST gene from other bacteria. The names of the corresponding genes are as follows: TeGST gene sequence of Thermosynechococcus elongatus (BA000039.2)/Thermosynechococcus vulcanos NIES-2134 (AP018202.2)/Thermosynechococcus sp. NK55(CP006735.1) /Thermosynechococcus elongatus PKUAC-SCTE542(CP032152.1)/Synechococcus lividus PCC 6715(CP018092.1) /Nostoc sp. NIES-4103(AP018288.1)/Anabaena sp. WA102 (CP011456.1)/Calothrix sp. NIES-2098(AP018172.1)/Cylindrospermum stagnale PCC 7417(CP003642.1)/Synechocystis sp. PCC 6714 (CP007542.1)). Evolutionary analyses were conducted in MEGA7 [2]. Numbers in branches are Bayesian posterior probabilities.
![Figure 1. Phylogenetic analysis of the TeGST gene with the GST gene from other bacteria. The names of the corresponding genes are as follows: TeGST gene sequence of Thermosynechococcus elongatus (BA000039.2)/Thermosynechococcus vulcanos NIES-2134 (AP018202.2)/Thermosynechococcus sp. NK55(CP006735.1) /Thermosynechococcus elongatus PKUAC-SCTE542(CP032152.1)/Synechococcus lividus PCC 6715(CP018092.1) /Nostoc sp. NIES-4103(AP018288.1)/Anabaena sp. WA102 (CP011456.1)/Calothrix sp. NIES-2098(AP018172.1)/Cylindrospermum stagnale PCC 7417(CP003642.1)/Synechocystis sp. PCC 6714 (CP007542.1)). Evolutionary analyses were conducted in MEGA7 [2]. Numbers in branches are Bayesian posterior probabilities.](/cms/asset/3265abf7-d1e7-413c-bcd7-ac37904ab95e/tbeq_a_1779127_f0001_b.jpg)
Glutathione S-transferases (GSTs; EC 2.5.1.18) belong to a family of diverse multifunctional enzymes that are ubiquitously distributed in both prokaryotic and eukaryotic cells [Citation43]. The phylogenetic analysis showed that TeGST has a closer phylogenetic relationship to the gene encoding GST from Synechocystis sp. PCC 6714 (CP007542.1), which belongs to cyanobacteria [Citation31]. Previous studies have shown that cyanobacteria can degrade hydrocarbons and oestrogen, such as phenanthrene and dibenzothiophene and oestradiol [Citation36, Citation44]. Phylogenetic analysis indicated that TeGST can possibly repair pollutants.
Sequence and expression analysis of TeGST
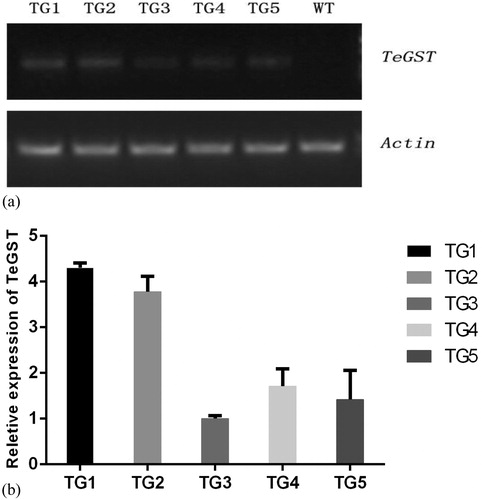
To improve the efficiency of gene transcription, the G + C and A + T contents of the synthesized TeGST gene (561 bp) by chemical synthesis were balanced and plant scarce codons were avoided (Supplemental Table S1). By PCR analysis, 5 lines (TG1, TG2, TG3, TG4 and TG5 respectively) were confirmed to harbour the TeGST gene (). The expression level of the TeGST gene in 5 lines was detected by RT-PCR. Among these lines, TG1 and TG2 had higher expression than other lines (). For this reason, TG1 and TG2 were selected for further analysis.
Figure 2. Expression profiles of WT and TeGST transgenic A. thaliana plants. (A) Semiquantitative PCR-amplified TeGST fragments from WT plants and transgenic lines (TG1, TG2, TG3, TG4 and TG5). Total RNA extracted from pooled tissue collected from T3 A. thaliana plants grown under normal conditions. The A. thaliana actin gene was used as the internal standard. The RT-PCR analysis revealed that the TeGST gene was expressed normally in the transgenic lines, but no expression was detected in the WT plants. (B) Relative transcript level analysis of different TeGST transgenic lines (TG1, TG2, TG3, TG4 and TG5). Values are means of three replications ± SD. Data are means from the analysis of three independent seed batches.
It was proved that TeGST gene could be expressed in A. thaliana by RT-PCR, but different expression levels were found in each line, similar to the results reported by Nahar et al. [Citation45]. This difference may be related to the position effect of the transgene or the special insertion method [Citation46]. Because of its high sensitivity and accuracy, RT-PCR is an important method to study the expression of exogenous genes in transgenic plants [Citation47].
Enhanced thiocyanate tolerance in transgenic A. thaliana
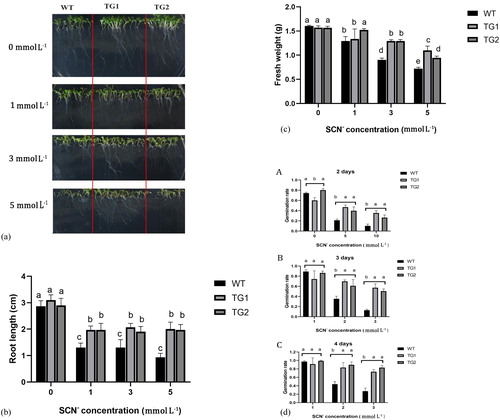
To compare the tolerance of the WT and TeGST overexpression lines to SCN-, the plants were grown for on MS agar plates containing a range of SCN- concentrations. Phenotypically, on the MS medium without guanidine thiocyanate, the WT and transgenic plants had healthy growth. On the medium with 1 mmol L−1 guanidine thiocyanate, the transgenic plants showed longer root length compared to WT plants. On medium with 3 mmol L−1 and 5 mmol L−1 guanidine thiocyanate, however, WT plants grew more slowly than transgenic plants (). After vertical culture for 14 days, there was no significant difference in the main root length of WT, TG1 and TG2 lines in normal medium without guanidine thiocyanate. When the concentration of guanidine thiocyanate was 1.0 mmol L−1, the growth of both WT and transgenic plants was inhibited to some extent, but not significantly compared with the control (). However, the growth of roots and stems of WT plants was significantly inhibited in WT plants as compared to transgenic plants when the concentration of guanidine thiocyanate was 3.0 mmol L−1 or 5.0 mmol L−1 (). Moreover, in the presence of thiocyanates, the biomass of transgenic plants was higher than that of WT plants (). Moreover, the germination of A. thaliana in guanidine thiocyanate medium of different concentrations showed that the transgenic lines had a higher germination rate than WT (). These results indicated that TeGST can improve the tolerance of A. thaliana to guanidine thiocyanate.
Figure 3. Effects of guanidine thiocyanate on seed growth of A. thaliana. (A) Growth of WT and transgenic plants sown on 0, 1, 3 and 5 mmol L−1 guanidine thiocyanate plate for 7 days. (B) Root length of WT and transgenic plants after growth 7 days on 0, 1, 3 and 5 mmol L−1 guanidine thiocyanate medium is as indicated. (C) Fresh weight of WT and transgenic plants after growth for 7 days on 0, 1, 3 and 5 mmol L−1 guanidine thiocyanate medium. Values are means of three replications ± SD. Different letters at the top of the bar indicate significant differences according to univariate ANOVA (p < 0.05). (D) Statistics on germination rates of WT and transgenic plants seeded on 0, 5 and 10 mmol L−1 guanidine thiocyanate plates 2, 3 and 4 days later. Values are means of two replications ± SD. Different letters at the top of the bar indicate significant differences according to univariate ANOVA (p < 0.05).
Srivastava et al. [Citation48] found that overexpression of OsGSTU30 in A. thaliana increased the tolerance to the heavy metal chromium. Dixit et al. [Citation49] also found that overexpression of fungal glutathione transferase in tobacco increased the tolerance to anthracene, and transgenic plants had higher biomass than wild-type plants under the stress of pollutants. GSH mainly plays four roles in detoxification of xenobiotic: via glutathione conjugation, dehydrochlorination, glutathione peroxidase (GPx) activity or passive/sacrificial binding [Citation50–54]. Studies have found that high concentrations of boric acid can induce antioxidant stress response in plants [Citation55]. The expression levels of ATGSTU19 and ATGSTZ1 genes in A. thaliana were significantly increased under the stress of high concentration of boric acid [Citation56]. There have been several reports demonstrating that the phytotoxicity of thiocyanates is caused by redox imbalance [Citation57]. When thiocyanate enters the cell, it induces oxidative stress in the cell. GSTs could repair the damage caused by reactive oxygen species (ROS) secondary products, and GSH is directly coupled with lipid peroxidation, to promote antioxidant defense [Citation54].
It can be speculated that the enhanced thiocyanate tolerance associated with TeGST overexpression may be attributable to the role of TeGST in the antioxidant defense in the root cytosol. Excessive GSH protects plant cells from ROS and allows them to grow normally. The tolerance of TG1 and TG2 to thiocyanate was different in magnitude; it may be caused by the different expression levels of TeGST in the transgenic plants.
Enhanced absorption of guanidine thiocyanate in transgenic A. thaliana
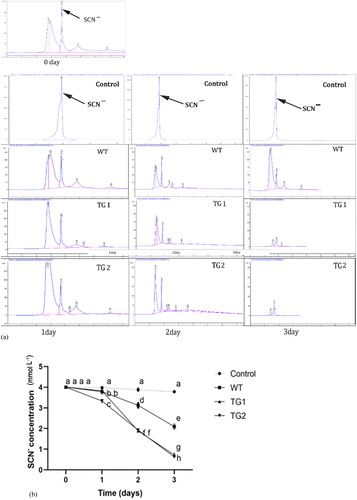
To verify whether TeGST enhances guanidine thiocyanate removal, the removal efficiency of transgenic TG1, TG2 and WT lines was evaluated in the hydroponic assay (). Under guanidine thiocyanate treatment for 1d, the content of guanidine thiocyanate remaining in the solution in WT lines was only significantly higher than that in TG2 lines, and there was no difference with TG1 lines. After 2 days, the guanidine thiocyanate concentration was 3.19 mmol L−1, 1.89 mmol L−1 and 1.93 mmol L−1 in WT, TG1 and TG2 transgenic lines respectively. Moreover, after 3 days of treatment, the guanidine thiocyanate residue in WT, TG1 and TG2 was 2.13 mmol L−1, 0.73 mmol L−1 and 0.6 mmol L−1, respectively. The transgenic lines exhibited a more significant efficiency in guanidine thiocyanate removal than the WT plants (). However, the WT plants also had some absorptive capacity compared with the blank control. These results indicate that the introduction of the glutathione transferase gene into transgenic plants was associated with enhanced absorption of guanidine thiocyanate.
Figure 4. Residue analysis of guanidine thiocyanate by HPLC. WT and transgenic plants were cultured in liquid medium containing 4 mmol L−1 of guanidine thiocyanate. (A) Guanidine thiocyanate residue analysis of WT and transgenic lines (TG1, TG2) by HPLC. (B) Guanidine thiocyanate residue of blank control, WT and transgenic lines (TG1, TG2) are as indicated. Values are means of three replications ± SD. Different letters at the top of the bar indicate significant differences according to univariate ANOVA (p < 0.05).
Studies have shown that glucosinolates in Brassicaceae can be hydrolyzed to thiocyanates under the action of myrosinase (thioglucoside glucohydrolase, EC 3.2.3.1) [Citation58, Citation59]. Allyl isothiocyanate (AITC) reacts with oxidized glutathione (GSSG) to produce dithiocarbamate and sulphenic acid [Citation60]. Under high concentration of thiocyanate, plants trigger their oxidative stress response, so the GSSG produced combines with thiocyanate and promotes the degradation of thiocyanate. SCN- accumulation leads to the accumulation of peroxide in cells and the resulting oxidative stress. The high expression of TeGST in the cells of transgenic plants can protect the cells from oxidative damage, which could enhance the absorption ability of the transgenic plant. Further studies are needed to elucidate the mechanism of TeGST in the enhancement of plants’ absorption of thiocyanate.
GST activity towards guanidine thiocyanate in vitro
To verify whether guanidine thiocyanate was degraded directly by GST, crude protein of GST activity was assayed. Protein extracts from leaves of A. thaliana were incubated with guanidine thiocyanate, and the enzyme-dependent decrease in the guanidine thiocyanate concentration was evaluated by HPLC analysis.
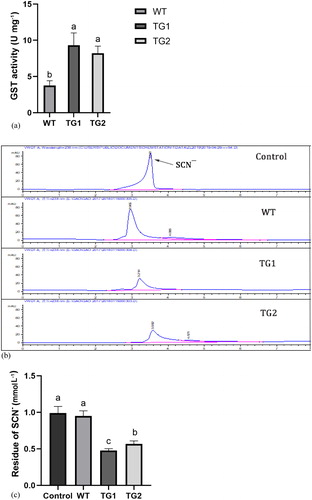
TeGST has a certain effect on the degradation of guanidine thiocyanate as shown in . In the crude enzyme assay of GTS, the enzyme activity in transgenic plants was higher than that in WT plants (). Data analysis showed that the degradation capacity of guanidine thiocyanate in WT A. thaliana was significantly lower than that in transgenic TeGST plants (). We hypothesized that GST was released after cell fragmentation to catalyze glutathione binding to guanidine thiocyanate, thus reducing the content of free SCN- in solution ().
Figure 5. TeGST activity in crude protein extract in vitro. (A) GST activity in WT and transgenic plants (TG1, TG2). (B) HPLC analysis of guanidine thiocyanate residue after degradation by the crude protein of WT, TG1 and TG2. (C) Concentration of guanidine thiocyanate residue in a liquid medium in which blank control, WT and transgenic lines (TG1, TG2) were grown. Values are means of three replications ± SD. Different letters at the top of the bar indicate significant differences according to univariate ANOVA (p < 0.05).
Phytoremediation efficiency is mainly dependent on the ability of plants to resist the damage from pollutants and reactive oxygen species that may cause stress in the plant tissue. GST has glutathione peroxidase activity, i.e. catalyzes the conjugation of glutathione (GSH) with various xenobiotics, and helps detoxify reactive oxygen species [Citation61, Citation62]. Fu et al. [Citation63] found that the glutathione transferase gene AtGSTF8 in A. thaliana could be combined with di-(2-ethylhexyl) phthalate (DEHP).
Tzafestas et al. [Citation64] found that GSTU24 and GSTU25 genes in A. thaliana can catalyze glutathione coupling with 2,4,6-trinitrotoluene (TNT). These results indicate that glutathione s-transferase can directly or indirectly bind to pollutants, thereby reducing the damage that pollutants induce in plants. Urbancsok et al. [Citation65] found that in A. thaliana mutants with impaired glutathione biosynthesis, the sensitivity to allyl isothiocyanate (AITC) was increased because of glutathione depletion due to AITC treatment, leading to a higher susceptibility of glutathione mutants, which was in agreement with our results.
Conclusions
In this study, enhanced phytoremediation of guanidine thiocyanate was first realized by obtaining TeGST overexpressing A. thaliana plants. The results of this study will throw light on GST expression in transgenic plants as a potential approach for the treatment of thiocyanate pollutants. These studies were conducted in the model plant A. thaliana, which is not suitable for phytoremediation due to its small biomass. In the future, GST or its homologous substances will be overexpressed in other plants for bioremediation of environment polluted by thiocyanates. Since this study did not focus specifically on the degradation process of guanidine thiocyanate, the metabolic pathway of guanidine thiocyanate in transgenic plants needs further study.
Supplemental Material
Download PDF (196 KB)Disclosure statement
No potential conflict of interest was reported by the author(s).
Additional information
Funding
References
- Beekhuis HA. Technology and industrial application. In: Newman AA, editors. Chemistry and biochemistry of thiocyanic acid and its derivatives. London: Academic Press; 1975. p. 222–255.
- Hussain A, Ogawa T, Saito M, et al. Cloning and expression of a gene encoding a novel thermostable thiocyanate-degrading enzyme from a mesophilic Alphaproteobacteria strain THI201. Microbiology (Reading Engl). 2013;159(Pt 11):2294–2302.
- Boucabeille C, Bories A, Ollivier P, et al. Microbial degradation of metal complexed cyanides and thiocyanate from mining wastewaters. Environ Pollut. 1994;84(1):59–67.
- Watts MP, Gan HM, Peng LY, et al. In situ stimulation of thiocyanate biodegradation through phosphate amendment in gold mine tailings water. Environ Sci Technol. 2017;51(22):13353–13362.
- Patil Yogesh B. Utilization of thiocyanate (SCN−) by a metabolically active bacterial consortium as the sole source of nitrogen. Int J Chem Environ Pharm Res. 2011;2:44–48.
- Trapp S, Karlson U. Aspects of phytoremediation of organic pollutants. J Soils Sediments. 2001;1(1):37–43.
- Katayama Y, Hashimoto K, Nakayama H, et al. Thiocyanate hydrolase is a cobalt-containing metalloenzyme with a cysteine-sulfinic acid ligand . J Am Chem Soc. 2006;128(3):728–729.
- Johnson CA, Grimes DJ, Leinz RW, et al. Cyanide speciation at four gold leach operations undergoing remediation. Environ Sci Technol. 2008;42(4):1038–1044.
- Boening DW, Chew CM. A critical review: general toxicity and environmental fate of three aqueous cyanide ions and associated ligands. Water Air Soil Pollut. 1999;109(1/4):67–79.
- Andersson AC, Strömvall AM. Leaching of concrete admixtures containing thiocyanate and resin acids. Environ Sci Technol. 2001;35(4):788–793.
- Wood AP, Kelly DP, McDonald IR, et al. A novel pink-pigmented facultative methylotroph, Methylobacterium thiocyanatum sp. nov., capable of growth on thiocyanate or cyanate as sole nitrogen sources. Arch Microbiol. 1998;169(2):148–158.
- Bhunia F, Saha NC, Kaviraj A. Toxicity of thiocyanate to fish, plankton, worm, and aquatic ecosystem. Bull Environ Contam Toxicol. 2000;64(2):197–204.
- Lee C, Kim J, Do H, et al. Monitoring thiocyanate-degrading microbial community in relation to changes in process performance in mixed culture systems near washout. Water Res. 2008;42(4-5):1254–1262.
- Lee C, Scott JS. State of the art processes for the treatment of gold mill effluents; industrial programs branch. Ottawa (Canada): Environment Canada; 1987.
- Kevan SD, Dixon DG. The acute toxicity of pulse-dosed thiocyanate (as KSCN and NaSCN) to rainbow trout (Oncorhyn-chus mykiss) eggs before and after water hardening. Aquat Toxicol. 1991;19(2):113–122.
- Akcil A. Destruction of cyanide in gold mill effluents: biological versus chemical treatments. Biotechnol Adv. 2003;21(6):501–511.
- Gould WD, King M, Mohapatra BR, et al. A critical review on destruction of thiocyanate in mining effluents. Miner Eng. 2012;34:38–47.
- Ahn JH, Kim J, Lim J, et al. Biokinetic evaluation and modeling of continuous thiocyanate biodegradation by Klebsiella sp. Biotechnol Prog. 2004;20(4):1069–1075.
- Ebbs S. Biological degradation of cyanide compounds. Curr Opin Biotechnol. 2004;15(3):231–236.
- Bezsudnova EY, Sorokin DY, Tikhonova TV, et al. Thiocyanate hydrolase, the primary enzyme initiating thiocyanate degradation in the novel obligately chemolithoautotrophic halophilic sulfur-oxidizing bacterium Thiohalophilus thiocyanoxidans. Biochim Biophys Acta. 2007;1774(12):1563–1570.
- McCutcheon SC, Schnoor JL. Phytoremediation: transformation and control of contaminants. Environ Sci Pollut Res. 2004;11(1):40–40.
- Doty SL. Enhancing phytoremediation through the use of transgenics and endophytes. New Phytol. 2008;179(2):318–333.
- Ruiz ON, Alvarez D, Torres C, et al. Metallothionein expression in chloroplasts enhances mercury accumulation and phytoremediation capability. Plant Biotechnol J. 2011;9(5):609–617.
- Weisman D, Alkio M, Colón-Carmona A. Transcriptional responses to polycyclic aromatic hydrocarbon-induced stress in Arabidopsis thaliana reveal the involvement of hormone and defense signaling pathways. BMC Plant Biol. 2010;10:59–13.
- Burritt DJ. The polycyclic aromatic hydrocarbon phenanthrene causes oxidative stress and alters polyamine metabolism in the aquatic liverwort Riccia fluitans L. Plant Cell Environ. 2008;31(10):1416–1431.
- Doty SL, Shang TQ, Wilson AM, et al. Enhanced metabolism of halogenated hydrocarbons in transgenic plants containing mammalian cytochrome P450 2E1. Proc Natl Acad Sci Usa. 2000;97(12):6287–6291.
- Rugh CL, Senecoff JF, Meagher RB, et al. Development of transgenic yellow poplar for mercury phytoremediation. Nat Biotechnol. 1998;16(10):925–928.
- Sheehan D, Meade G, Foley VM, et al. Structure, function and evolution of glutathione transferases: implications for classification of non-mammalian members of an ancient enzyme superfamily. Biochem J. 2001;360(Pt 1):1–16.,
- Palanisami S, Prabaharan D, Uma L. Fate of few pesticide-metabolizing enzymes in the marine cyanobacterium Phormidium valderianum BDU 20041 in perspective with chlorpyrifos exposure. Pestic Biochem Physiol. 2009;94(2-3):68–72.
- Ranson H, Hemingway J. Mosquito glutathione transferases. Meth Enzymol. 2005;401:226–241.
- Zechmann B, Tomašić A, Horvat L, et al. Subcellular distribution of glutathione and cysteine in cyanobacteria. Protoplasma. 2010;246(1-4):65–72.
- Landen RH. The effect of certain chemicals on the catalase activity in plants. Am J Bot. 1984;21:583–591.
- Karavangeli M, Labrou NE, Clonis YD, et al. Development of transgenic tobacco plants overexpressing maize glutathione S-transferase I for chloroacetanilide herbicides phytoremediation. Biomol Eng. 2005;22(4):121–128.
- Flocco CG, Lindblom SD, Elizabeth AH, et al. Overexpression of enzymes involved in glutathione synthesis enhances tolerance to organic pollutants in Brassica juncea. Int J Phytoremediation. 2004;6(4):289–304.,
- Zhang YY, Liu JH. Transgenic alfalfa plants co-expressing glutathione S-transferase (GST) and human CYP2E1 show enhanced resistance to mixed contaminates of heavy metals and organic pollutants. J Hazard Mater. 2011;189(1-2):357–362.
- Sami N, Fatma T. Studies on estrone biodegradation potential of cyanobacterial species. Biocatal Agric Biotechnol. 2019;17:576–582.
- Zou JJ, Liu W, Deng WQ, et al. An efficient guanidinium isothiocyanate additive for improving the photovoltaic performances and thermal stability of perovskite solar cells. Electrochim Acta. 2018;291(20):297–303.
- Xiong AS, Yao QH, Peng RH, et al. A simple, rapid, high-fidelity and cost-effective PCR-based two-step DNA synthesis method for long gene sequences. Nucleic Acids Res. 2004;32(12):e98–10.
- Zhang X, Henriques R, Lin SS, et al. Agrobacterium-mediated transformation of Arabidopsis thaliana using the floral dip method. Nat Protoc. 2006;1(2):641–646.
- Liao Y, Zhou X, Yu J, et al. The key role of chlorocatechol 1,2-dioxygenase in phytoremoval and degradation of catechol by transgenic Arabidopsis . Plant Physiol. 2006;142(2):620–628.
- Bradford MA. Rapid and sensitive method for the detection of microgram quantities of proteins. Anal Biochem. 1976;72(1-2):248–254.
- Hossain MZ, Hossain MD, Fujita M. Induction of pumpkin glutathione S-transferase by different stresses and its possible mechanisms. Biol Plant. 2006;50(2):210–218.
- Li X, Zhang X, Zhang J, et al. Identification and characterization of eleven glutathione S-transferase genes from the aquatic midge Chironomus tentans (Diptera: Chironomidae)). Insect Biochem Mol Biol. 2009;39(10):745–754.
- Ibraheem I. Biodegradability of hydrocarbons by cyanobacteria. Journal of Phycology. 2010;46(4):818–824.
- Nahar N, Rahman A, Nawani NN, et al. Phytoremediation of arsenic from the contaminated soil using transgenic tobacco plants expressing ACR2 gene of Arabidopsis thaliana. J Plant Physiol. 2017;218:121–126.
- Halweg C, Thompson WF, Spiker S. The rb7 matrix attachment region increases the likelihood and magnitude of transgene expression in tobacco cells: a flow cytometric study. Plant Cell. 2005;17(2):418–429.
- Ingham DJ, Beer S, Money S, et al. Quantitative real-time PCR assay for determining transgene copy number in transformed plants. BioTechniques. 2001;31(1):132–140.
- Srivastava D, Verma G, Chauhan AS, et al. Rice (Oryza sativa L.) tau class glutathione S-transferase (OsGSTU30) overexpression in Arabidopsis thaliana modulates a regulatory network leading to heavy metal and drought stress tolerance. Metallomics. 2019;11(2):375–389.
- Dixit P, Mukherjee PK, Sherkhane PD, et al. Enhanced tolerance and remediation of anthracene by transgenic tobacco plants expressing a fungal glutathione transferase gene. J Hazard Mater. 2011;192(1):270–276.
- Hayes JD, Wolf CR. Role of glutathione transferase in drug resistance. In: Sies H, Ketterer B, editors. Glutathione Conjugation: Mechanisms and Biological Significance. Cambridge (MA): Academic Press; 1988. p. 315–355.
- Mannervik B, Danielson UH. Glutathione transferases-structure and catalytic activity. CRC Crit Rev Biochem. 1988;23(3):283–337.
- Pickett CB, Lu AY. Glutathione S-transferases: gene structure, regulation, and biological function. Annu Rev Biochem. 1989;58:743–764.
- Yang Y, Cheng JZ, Singhal SS, et al. Role of glutathione S-transferases in protection against lipid peroxidation. Overexpression of hGSTA2-2 in K562 cells protects against hydrogen peroxide-induced apoptosis and inhibits JNK and caspase 3 activationJ Biol Chem. 2001;276(22):19220–19230.
- C-MA, Penilla RP, Rodríguez DA. Insecticide resistance and glutathione S-transferases in mosquitoes: A review. Afr J Biotechnol. 2009;8(8):1386–1397.
- Kayihan DS, Kayihan C, Ciftci YO. Excess boron responsive regulations of antioxidative mechanism at physio-biochemical and molecular levels in Arabidopsis thaliana. Plant Physiol Biochem. 2016;109:337–345.
- Kayihan DS, Kayihan C, Ciftci YO. Regulation of boron toxicity responses via glutathione-dependent detoxification pathways at biochemical and molecular levels in Arabidopsis thaliana. Turk J Bot. 2019;43(6):749–757.
- Yu XZ, Zhang FZ. Effects of exogenous thiocyanate on mineral nutrients, antioxidative responses and free amino acids in rice seedlings. Ecotoxicology. 2013;22(4):752–760.
- Fenwick GR, Heaney RK, Mullin WJ. Glucosinolates and their breakdown products in food and food plants. Crit Rev Food Sci Nutr. 1983;18(2):123–201.
- Brown PD, Morra MJ. Hydrolysis products of glucosinolates in Brassica napus tissues as inhibitors of seed germination. Plant Soil. 1996;181(2):307–316.
- Kawakishi S, Kaneko T. Interaction of oxidized glutathione with allyl isothiocyanate. Phytochemistry. 1985;24(4):715–718.
- Bittsánszky A, Kömives T, Gullner G, et al. Ability of transgenic poplars with elevated glutathione content to tolerate zinc(2+) stress. Environ Int. 2005;31(2):251–254.
- Hellou J, Ross NW, Moon TW. Glutathione, glutathione S-transferase, and glutathione conjugates, complementary markers of oxidative stress in aquatic biota. Environ Sci Pollut Res Int. 2012;19(6):2007–2023.
- Fu ZJ, Tang SF, Hou XM. Probing the molecular toxic mechanism of di-(2-ethylhexyl) phthalate with glutathione transferase Phi8 from Arabidopsis thaliana. Int J Biol Macromol. 2020;145:165–172.
- Tzafestas K, Ahmad L, Dani MP, et al. Structure-Guided mechanisms behind the metabolism of 2,4,6-trinitrotoluene by glutathione transferases U25 and U24 that lead to alternate product distribution. Front Plant Sci. 2018;9:1846.
- Urbancsok J, Bones AM, Kissen R. Arabidopsis mutants impaired in glutathione biosynthesis exhibit higher sensitivity towards the glucosinolate hydrolysis product allyl-isothiocyanate. Sci Rep. 2018;8(1):9809.