
Abstract
Here, we utilize the available next-generation sequencing (NGS) data to develop robust markers differentiating between salt-tolerant and sensitive wheat cultivars. First, we analyzed multi-transcriptomic datasets for salt-tolerant cultivars to identify the shared differentially expressed genes (DEGs). The identified shared DEGs (31 sDEGs) were extracted and compared to available wheat reference genomes to obtain all single-nucleotide polymorphisms (SNPs). Interestingly, six shared SNPs (sSNPs) were identified across four genes including the MIOX-1 gene. For in silico validation of MIOX-1 expression, we compared transcriptomes of salt-tolerant and sensitive wheat cultivars. Interestingly, the expression of the MIOX-1 gene was significantly down-regulated in the tolerant compared to the sensitive. Therefore, the SNP located in the promotor area of the MIOX-1 gene was further analyzed to predict the transcription factor binding sites. The results revealed that the occurrence of this sSNP is irreplaceable and positioned in the WRKY-1 binding site. The expression of the WRKY-1 gene was consistent between salt-tolerant and salt-sensitive wheat cultivars, indicating that the WRKY-1 had no influence on the MIOX-1 gene expression and these SNP might positively affect the salinity tolerance. For SNP in vitro validation, we used two Egyptian cultivars with opposite salinity responses (tolerant: Sakha-93 and sensitive: Gemmeiza-9). The allele-specific polymerase chain reaction results revealed that Gemmeiza-9 was heterozygous (C/G), whereas the Sakha-93 was homozygous (C/C), indicating that these SNPs might affect positively the response of wheat cultivars to tolerate the salinity. Ultimately, these SNPs could serve as a powerful marker for accelerating wheat breeding programs.
Introduction
Bread wheat (Triticum aestivum L.), one of the most strategic crops worldwide, plays an increasingly vital role in human nutrition. Wheat was among the first domesticated food crops about 10,000 years ago and according to Food and Agriculture Organization (FAO) statistics, in 2018 it was cultivated on over 200 million hectares [Citation1]. Despite the vastness of the cultivated area, the population growth and food demand necessitate increasing production during the next two decades by more than 40% through expanding the cultivated area and the wheat productivity [Citation2]. On the other hand, climate change is chasing these improvement plans by making abiotic stresses more severe [Citation3].
Agricultural lands salinization has been listed as one of the leading global crises during the last decades. Salinity is causing a considerable diminishing in crops productivity dramatically. Plants have developed various mechanisms to cope with harmful salinity effects, such as osmotic homeostasis, ionic homeostasis, growth regulation, redox equilibrium, in addition to many other mechanisms [Citation4]. These mechanisms are mainly achieved by modulating plants’ physiological and biochemical pathways by orchestrating the expression of a massive number of salt-responsive genes [Citation5]. Thus, understanding these mechanisms and their interactions is expected to facilitate the development and breeding of many salt-tolerant crops, reflected in a better and more valuable securing of the world’s food supply [Citation6].
High-throughput sequencing (HTS) technology transformed the molecular biology field by facilitating whole genome/transcriptome sequencing at cost-effectiveness levels. Although HTS dramatically increased the rate of decoded genomes and transcriptomes, limited biodata mining approaches have emerged to cope with this massive amount of sequencing datasets and extract valuable knowledge behind these experiments [Citation7].
Single-nucleotide polymorphisms (SNPs) have recently become one of the most important and widely used molecular markers. When compared to other molecular markers, SNPs have superior properties in terms of prevalence, abundance, controlled distribution and low allelic diversity across the genome [Citation8]. Several projects and databases, including CerealsDB, KASP genotyping assays and EMS-Induced Mutations, have contributed to increasing the number of identified SNPs [Citation9–11]. In addition to the usefulness of quantitative trait locus (QTL) mapping and genome-wide association studies (GWAS) in annotating SNPs and their phenotypic associations, this ultimately increases the potency of marker-assisted selection utilization in breeding programs [Citation7, Citation12]. However, despite this expansion, there are still a large number of reference SNPs with unknown functions.
Recent studies reported that pooling of transcriptomes datasets revealed better variants detection, with calling accuracy ranging from 98 to 100 percent [Citation13, Citation14]. As a result of the utilization of publicly available transcriptome datasets, it is believed that this will contribute to leveraging our understanding of plant responses to environmental changes, particularly abiotic stresses [Citation15–22]. At the agricultural level, transcriptome-assisted variants discovery is expected to help as a powerful tool in decision-making strategies for future crop selective breeding programs.
Therefore, this study aimed to dissect and mine the publicly available transcriptomes and genomes toward identifying and annotating SNP(s) marker set(s) controlling salinity tolerance in wheat, additionally validating the efficiency of identified SNP(s) to characterize and differentiate between salt-tolerant and salt-sensitive wheat genotypes.
Materials and methods
Transcriptome data mining to identify SNPs controlling salt responsive genes
Transcriptome data retrieval
The first transcriptome dataset (TD1) was retrieved from the European Nucleotide Archive (ENA) with the project accession number PRJNA487923 [Citation23]. This dataset represents the transcriptome of the salt-tolerant wheat variety ‘Arg’ roots under short-term salinity stress (at three weeks and for twelve hours of treatment). Additionally, the second transcriptome dataset (TD2), with the project accession numbers PRJNA340343 and PRJNA340344, was retrieved [Citation24]. This dataset represents the root transcriptome of wheat variety ‘Kharchia Local’ exposed to long-term salinity (started at six days of germination and sampling at the anthesis stage). All retrieved datasets were transferred as FASTQ files to the galaxy online platform (https://usegalaxy.org/) for further downstream analysis [Citation25].
Quality assessment, mapping and assembly of reads
The FastQC online tool v0.11.8 was used to assess the quality of the retrieved datasets and scan the presence of sequencing adapters [Citation26]. The MultiQC tool v1.9 was used to aggregate whole FastQC results into a single report [Citation27]. The reference wheat genome (ftp://ftp.ensemblgenomes.org/pub/plants/release-48/fasta/triticum_aestivum/dna/) was transferred in a FASTA format file, and annotations (ftp://ftp.ensemblgenomes.org/pub/plants/release-48/gtf/triticum_aestivum) were also connected as a GFF3 file to Galaxy to be used during the mapping of reads. Reference genome-based mapping was performed by TopHat v2.1.1 at default parameters [Citation28]. The reads based on reference annotations were assembled using Cufflinks v2.1.1 [29].
Identification of shared differentially expressed genes (sDEGs)
The assembled reads generated from Cufflinks were then compared to the wheat reference annotation using the Cuffcompare tool v2.2.1 [29]. After that, the Cuffdiff tool v2.2.1 was used to calculate the gene expression differential patterns between different conditions [Citation29]. Finally, we compared the Cuffdiff results using an in-house Python script, and genes with a log fold change greater/smaller than or equal to ±1 were only considered (at p ≤ 0.05).
SNPs discovery
The genome files of five bread wheat cultivars (https://plants.ensembl.org/Triticum_aestivum/Info/Strains?db=core) were selected from the Ensembl Plants web portal, then sent to the Galaxy platform for further downstream analysis. Initially, we used the Biomart tool [Citation30] to extract the sDEGs sequences from the abovementioned wheat reference genome along with 1000 base pairs up and down each gene. After that, the BLASTn v2.7.1 online tool hosted by Galaxy was used to align each reference gene against each of the five genomes [Citation31]. Then, an in-house Python script was used to extract all homologous genes from the BLASTn results. Multiple alignments were performed using the Biopython v1.79 command-line wrapper for Clustalw v2.1 for the extracted homologous genes [Citation32, Citation33]. Using an in-house Python/Biopython script, the SNPs were extracted with their location on each reference gene in addition to 1000 base pairs up and down. For SNP selection, we initially calculated the allele frequency for each SNP, and based on the obtained results, the SNPs were filtered to exclude the SNPs with allele frequency higher than 33% due to the limited number of available genomes. To refine the positions of filtered SNPs on the reference genome, these SNPs were aligned against the reference genome using the BLASTn v2.7.1 tool, and finally, we used Biomart to compare the positions of obtained SNPs against the reference SNPs.
Identification of transcription factor binding sites
We used the NCBI taxonomy database to track the closest genera to the wheat [Citation34]. Using Biomart, we extracted 1000 nucleotide bases upstream of orthologous genes. We used MEME v5.2.0 to elicit loci of transcription factors binding sites in upstream regions of these orthologous genes [Citation35]. Tomtom v5.2.0 tool was used to compare the predicted transcription factor binding site against the JASPAR database of plants [Citation36, Citation37].
In silico validation of the SNP-based gene expression
Transcriptome data description and retrieval
A transcriptome dataset (TD3) represents two bread wheat cultivars (tolerant: Qing Mai 6 ‘QM6’ and sensitive: Chinese Spring ‘CS’) was retrieved from the ENA browser (Accession number: SRP062745). Under this dataset, two treatments were conducted (control and salt treatment) with three biological replicates [Citation38]. The one-week-old roots post-germination were sampled at four-time points (6, 12, 24 and 48 h).
Quality assessment, mapping, assembly and differential analysis of reads
For the in silico validation of the SNPs affecting gene expression, we sent the TD3 dataset to the Galaxy platform for subsequent downstream mining and analysis. Initially, the FastQC v0.11.8 and MultiQC v1.9 were utilized to assess the dataset quality. Then, we extracted both the MIOX-1 reference gene and the WRKY-1 reference gene sequence from the bread wheat reference genome using the Biomart tool. Next, the TD3 dataset was mapped against the WRKY-1 and MIOX-1 reference genes using Bowtie2 software [Citation39]. Then, the matched reads with these genes were assembled using the Cufflinks tool. After that, Cuffcompare was used to confirm the existence of the two genes at all time points, and then, the Cuffdiff tool was implemented to measure the gene expression variations among the different treatments. Finally, a heatmap was drawn using ClustVis (https://biit.cs.ut.ee/clustvis/) [Citation40].
In vitro allele-specific polymerase chain reaction (PCR) validation
DNA was isolated from fresh leaves of two Egyptian bread wheat cultivars with opposite salinity responses (Sensitive: Gemmeiza-9 and tolerant: Sakha-93) using the DNeasy Plant Mini Kit protocol (Qiagen, USA). Two primer pairs were designed to be used in Nested-PCR analysis. The first primer pair was designed using Primer3web v4.1.0 [Citation41], masking 100 bases up and down the SNP position to ensure that our target SNP will be represented in the amplified fragment. For allele-specific PCR, the second primer pair was designed using WASP online web (http://bioinfo.biotec.or.th/WASP) according to the following parameters: primer size (optimum: 20; minimum: 18; maximum: 27), GC% (optimum: 50; minimum: 20; maximum: 85), Tm (optimum: 55; minimum: 40; maximum: 65), max Tm complementarity: 100, max self complementarity: 8, max three prime complementarity: 3 and max polyX in primer: 4 [Citation42]. The allele-specific PCR reaction was finally electrophoresed in a 2%agarose gel.
Results
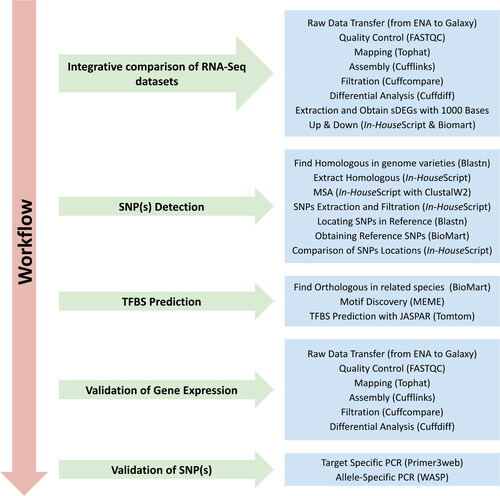
This study implemented different analysis approaches to identify variants associated with salinity tolerance that could be used to develop efficient wheat breeding programs. These different analysis approaches are summarized in the workflow (). This workflow includes the following main steps: 1) Mining of RNA-seq datasets to extract the sDEGs, 2) Utilization of multiple wheat genomes to ascertain the allele frequency, 3) Prediction of transcription factor binding sites, 4) In silico validation of the SNP-based gene expression, and 5) In vitro PCR validation of identified SNPs associated with salt tolerance.
Figure 1. Workflow summary of the analysis approaches implemented in this study. TFBS, transcription factor binding sites; SNP, single-nucleotide polymorphisms.
Mining of RNA-seq datasets to extract the sDEGs
Initially, the quality of the obtained transcriptomic datasets was assessed (). The quality control results revealed that TD1, TD2 and TD3 datasets exhibited a high Phred quality score (>Q30). Furthermore, for mapping reads results, TD1 and TD2 showed high mapping rates ranging between 84.4 to 85.5 and 90.9 and 91.3, respectively.
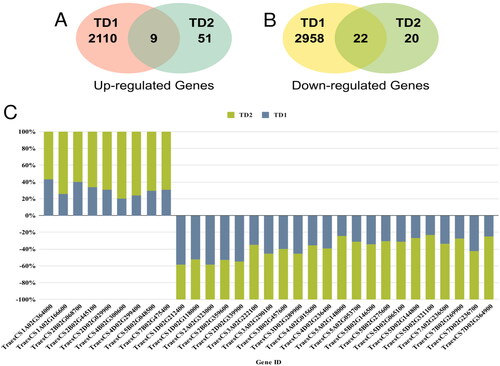
The differential expression analysis successfully identified a total number of 5099 and 102 DEGs in TD1 and TD2, respectively. Among these DEGs, 2179 DEGs were up-regulated, and 3022 DEGs were down-regulated. Interestingly, only nine sDEGs were determined between the TD1 and TD2 in the up-regulated DEGs (). Meanwhile, 22 sDEGs were determined in the down-regulated DEGs (). Notably, the gene expression levels of up-regulated sDEGs were higher in TD2 compared to TD1. Similarly, the sDEGs expression levels within the down-regulated genes were also higher in TD2 than in TD1 ().
Figure 2. Venn diagram (A) illustrates the up-regulated DEGs determined between the TD1 and TD2, Venn diagram (B) illustrates the down-regulated DEGs determined between the TD1 and TD2; and (C) the expression levels of up- and down-regulated sDEGs in TD2 compared to TD1.
Homology analysis of identified sDEGs
Initially, a pairwise alignment was performed against the five retrieved wheat genomes to identify the homologous genes for each sDEG. The alignment results showed that the average of identical matches ranged from 97.5% to 100% (). Among the 31 sDEGs identified, seven genes were identical to their peers in the five wheat genomes. The remaining 24 sDEGs contained mismatches (with the highest average equal to 44) and/or gaps (with the highest average equal to 7).
Table 1. Six SNPs identified within the 4 sDEGs and their allele, chromosomal position, gene name and description.
SNPs identification and mapping
Based on multiple sequence alignment results, a total number of 419 SNPs were identified across the 24 sDEGs (Supplemental Table S2). We filtered all identified SNPs and excluded SNPs with allele frequency less than 33% for precise SNPs selection. Based on this filtration, 96 SNPs were found in only 13 of the 24 sDEGs (Supplemental Table S2). Finally, these 96 SNPs were mapped against the reference wheat genome. To determine the known SNPs, we compared the positions of the filtered SNPs against the 6,550 reference SNPs located within the 31 sDEGs in the reference wheat genome. The comparison results showed that only 6 SNPs were known and relevant to only 4 sDEGs ().
Based on the sDEGs description, we identified only one SNP (Cadenza0951.chr7D.471217538) located at site 471217538 in the 7 D chromosome. This SNP showed an allelic frequency of 50% C and 50% G across the six genomes. This SNP was located in a region upstream of the Myo-inositol oxygenase 1 (MIOX-1) gene (TraesCS7D02G364900), which will be used for all further downstream analysis.
Prediction of transcription factor binding sites (TFBS)
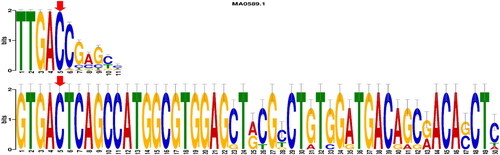
With the help of the NCBI taxonomy database, we selected the closest ten species to the bread wheat plant that have completely annotated genomes on Ensembl Plants (Supplemental Table S3). Based on genome mining analysis, we obtained the upstream regions of all MIOX-1 orthologous genes found within these ten selected genomes with the aid of the Ensembl Plants Genes Database (Version 48) to be used in the prediction of transcription factor binding sites. Out of three motifs obtained from MEME results, the motif with the highest E-value was selected to be compared against the plant motifs in the JASPAR database (). We found that out of 489 plant motifs in JASPAR; nine motifs were found to be matched with our discovered binding site. Out of these nine motifs, there was only one motif in which our targeted SNP is located at position seven, and this position is irreplaceable to the transcription factor (). TF-mining revealed that our transcription factor is WRKY transcription factor 1 (WRKY-1).
Figure 3. Discovered motifs and their p- and E-values as identified by MEME web server within the upstream regions of all MIOX-1 orthologous genes.
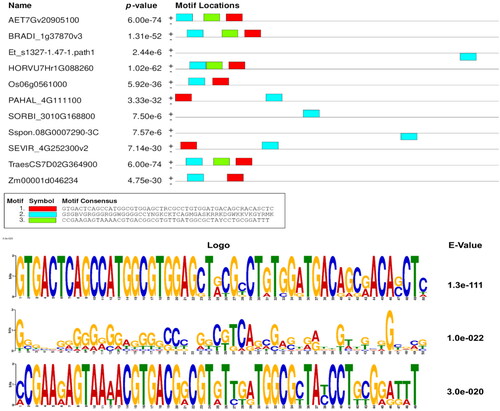
Figure 4. Motif comparison analysis shows the targeted SNP located at position five and its matching with the WRKY transcription factor 1 binding site.
In silico validation of the SNP-based gene expression
Since the binding site of the WRKY-1 transcription factor was identified in the upstream region of the MIOX-1 gene, it is necessary to ascertain the correlation in gene expression of WRKY-1 and MIOX-1 genes within the same cultivar under different salt stress conditions. The transcriptome-mining analysis of the TD3 dataset revealed that both the MIOX-1 and WRKY-1 genes were expressed. For WRKY-1 expression level analysis, the results demonstrated that the expression level of WRKY-1 was up-regulated (Average fold change = 5.49) in the CS cultivar (sensitive) under salinity. In contrast, in the QM6 cultivar (tolerant), there is a slight increase (non-significant) in the expression level (Average fold change = 0.82). Initially, we found that the expression of WRKY-1 was up-regulated (Average fold change = 4.69) in the QM6 cultivar (tolerant) compared to the CS cultivar (sensitive) under the control condition. Interestingly, the results showed that the expression of WRKY-1 was remarkably similar in the QM6 cultivar (tolerant) compared to the CS cultivar (sensitive) under the salt stress conditions ().
Figure 5. Heatmap represents the comparative expression levels results of the MIOX1 and WRKY1 genes between the QM6 cultivar (tolerant) and CS cultivar (sensitive) at four different timepoints.
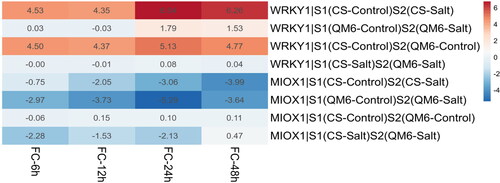
For MIOX-1, the results showed that the expression level of MIOX-1 was down-regulated (Average fold change = −2.46) in the CS cultivar (sensitive) under salinity. Similarly, in the QM6 cultivar (tolerant), there is down-regulation in the expression level (Average fold change = −3.9). Meanwhile, no difference in the expression level of the MIOX-1 was observed (Average fold change = 0.07) between the QM6 cultivar (tolerant) and the CS cultivar (sensitive) under the control condition. However, the results showed that the expression of MIOX-1 was down-regulated (Average fold change = −1.36) in the QM6 cultivar (tolerant) compared to the CS cultivar (sensitive) under the salt stress conditions ().
In vitro allele-specific PCR validation of the identified SNP associated with salt tolerance
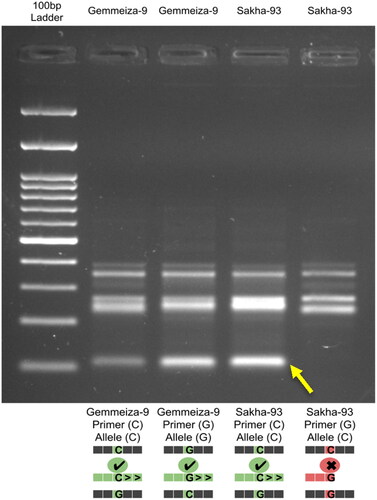
Based on the abovementioned SNP-based gene expression analysis, we identified a candidate SNP (C/G) that could be validated. Therefore, the nested PCR with target-specific primer pair (Supplemental Table S4) was performed to extract a segment of 386 bp in length containing the SNP at position 175. After that, the allele-specific PCR was applied to differentiate between the two reference Egyptian cultivars known for their opposite salinity behavior (Sakha-93: salt-tolerant and Gemmeiza-9: salt-sensitive) using the amplicons obtained from the first primer pair to confirm the SNP/salt-tolerance correlation. The results showed that the homozygous allele (C/C) appeared only in Sakha-93 (the salt-tolerant cultivar), while, a heterozygous allele (C/G) appeared only in Gemmeiza-9 (the salt-sensitive cultivar) ().
Figure 6. Allele-specific PCR gel electrophoresis results show that the homozygous allele (C/C) appeared only in Sakha-93 (the salt-tolerant cultivar), while a heterozygous allele (C/G) appeared only in Gemmeiza-9 (the salt-sensitive cultivar).
Discussion
Wheat salinity tolerance includes complex parameters that control the ‘decision-making’ by the wheat plant: for example, how is turgor level neutralized in an energetically-effective manner that does not conflict with any essential metabolic activities? To address this complex question, a sophisticated genome or transcriptome-wide analysis is crucial for a deep and better understanding of the impact and consequences of ionic exclusion. Furthermore, facing the elevated demand for high throughput genotyping in molecular breeding programs, mining available transcriptomic data over whole-genome sequencing data could represent a wealthy resource for developing useful functional markers for molecular-assisted selection. In this study, we aimed to mine the available wheat genomic and transcriptomic datasets to develop functional SNP markers associated with salinity tolerance in wheat. In addition, we validated the efficiency of the developed SNP markers to characterize both salt-tolerant and salt-sensitive wheat genotypes. Our results revealed that mining multi-transcriptomic datasets for salt-tolerant wheat cultivars (at different developmental stages) to identify the shared DEGs could be valuable and effective to develop reliable and reproducible functional markers that can be used to characterize salt-tolerant genotypes in wheat.
Initially, our analysis identified 31 sDEGs (9 up- and 22 down-regulated) shared among all multi-transcriptomic datasets considering the consistency in the gene expression profile of the selected DEGs between TD1 and TD2. Interestingly, a dramatic difference in the number of significant DEGs was identified between the early developmental stage (5099 sDEGs) and late developmental stage (102 sDEGs) under salinity stress. Also, we observed a clear difference in the number of DEGs as TD2 was found to have a lower number compared to TD1 (), and on the contrary, the fold change of sDEGs was higher in TD2 compared to TD1 (). Generally, this lower number of DEGs, particularly in TD2 compared to TD1, is presumably due to the limited number of significant identified DEGs in TD2 or relatively lower number of reads in TD2 [Citation23, Citation24]. Our study had to integrate the TD2, since it represents the only publicly available dataset for long-term salinity stress in wheat roots.
Although there are 6550 reference SNPs distributed over the 31 sDEGs, the filtration of the multiple alignment results yielded only 96 SNPs positioned in 13 out of the 31 sDEGs. Based on comparing the SNPs extracted from our analysis and the reference SNPs (found on the Ensembl database), only 6 shared SNPs (sSNPs) were positioned in only 4 sDEGs. Interestingly, among these 4 sDEGs, one sSNP was in the MIOX-1 gene, particularly in the promoter region. Based on the promoter analysis, this sSNP was identified in the WRKY-1 binding site. Previously, many studies reported that the MIOX-1 gene was found to play a vital role in osmotic balance and root-to-stem sodium transport [Citation43–45]. In our study, the identified down-regulation of the MIOX-1 gene in wheat roots was consistent with previous reports in canola and rice roots as a response to the salt stress [Citation43, Citation46]. Several studies have reported the association between the higher expression levels of MIOX-1 and higher vitamin C content in the shoot to cope with higher levels of abiotic stress [Citation47–49]. On the opposite side, lower expression levels of MIOX-1 were speculated to be combined with the reduction in the vitamin C content, catalase activity, superoxide dismutase activity and malondialdehyde content in roots under salinity stress [Citation50]. It is worthy of mentioning that Myo-inositol was found to play multiple vital roles such as providing storage for phosphate, participating as a component of the plasma membrane, aiding in the synthesis of galactinol, which consequently reduces the synthesis of sugars to aid in stress tolerance or the stimulation of defense genes. Furthermore, binding with auxin toward inhibition of plant growth and increasing transport processes [Citation51, Citation52].
Therefore, further validation was proposed as a crucial step to investigate the possible role of the identified sSNP positioned in the WRKY-1 binding site to regulate the MIOX-1 gene. Initially, we validated in silico the role of sSNP on a new transcriptomic dataset (TD3) to explore the link between the WRKY-1 and MIOX-1 expression levels. Remarkably, we found in TD3 that the salt-tolerant cultivars had significantly reduced MIOX-1 gene expression compared to the salt-sensitive cultivar under salt stress, which crucially needs further investigations to explore the role of the WRKY-1 transcription factor. Furthermore, we found in TD3 a significant down-regulation of WRKY-1 in both the salt-tolerant and sensitive cultivars exposed to salinity compared to the control. This down-regulation probably subsequently down-regulates the MIOX-1 gene. This level of down-regulation of WRKY-1 was also in agreement with previous reports in durum wheat roots under salt stress [Citation53]. Interestingly, our results showed no significant difference between the expression of WRKY-1 in the salt-tolerant and sensitive cultivar under salinity stress, indicating the null effect of WRKY-1 to modulate the expression the MIOX-1 gene. On the other hand, the in vitro validation results based on the allele-specific PCR analysis as an accurate and cost-effective approach to identifying SNPs and mutations revealed that the C/C allele could explain or differentiate between the salinity tolerance and the C/G allele in sensitive genotypes (). This usefulness agreed with previous studies which utilized allele-specific PCR as a powerful tool in SNP/genotype characterization in different plants [Citation42, Citation54, Citation55]. Moreover, based on the in vitro validation results, we speculate that the G allele impairs the binding of the transcription factor WRKY-1 and thus inhibits the down-regulation of MIOX-1. These may lead to an increase in the sensitivity to salinity by increasing defense compounds and osmotic pressure. To the best of our knowledge, these findings represent the first report that describes this SNP as a helpful marker that can be characterized by allele-specific PCR as an easy and inexpensive test to identify elite wheat cultivars with salt-tolerant characteristics. Ultimately, we recommend that the C allele be present rather than the G allele when using the wheat MIOX promoter in genetic engineering studies to improve plant tolerance to environmental stresses [Citation56].
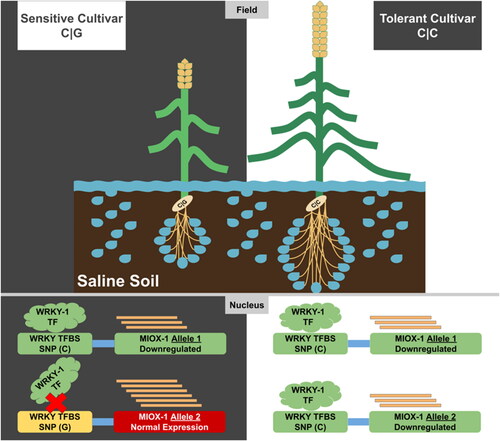
Figure 7. A graphical model illustrate the role of the MIOX1 and WRKY1 genes in presence/absence of the SNP (C/C) or (C/G) and its impact/role in explain the salinity-tolerance in wheat cultivars.
Conclusions
Breeding for salinity tolerance in wheat still represents a fundamental challenge worldwide. The mining of an enormous amount of released omics data enabled an excellent opportunity to develop novel markers that can be implemented in breeding strategies. This study utilized and integrated both in silico and in vitro mining approaches to characterize and annotate robust SNP markers that can differentiate between salt-tolerant and sensitive wheat genotypes. These novel SNPs could be a helpful marker for selecting salinity tolerance genotypes and accelerating wheat breeding programs.
Supplemental Material
Download Zip (209.4 KB)Acknowledgements
The authors would like to sincerely thank the administration of the Agricultural Genetic Engineering Research Institute (AGERI), as well as the administration of the Agricultural Research Center (ARC), Egypt, for their continued support.
Data availability statement
The authors agree to make data and materials supporting the results or analyses presented in their paper available upon reasonable request.
Disclosure statement
No potential conflict of interest was reported by the authors.
Funding
The author(s) reported there is no funding associated with the work featured in this article.
Related Research Data
References
- Tesfaye K. Climate change in the hottest wheat regions. Nat Food. 2021;2(1):8–9.
- Kizilgeci F, Yildirim M, Islam MS, et al. Normalized difference vegetation index and chlorophyll content for precision nitrogen management in durum wheat cultivars under semi-arid conditions. Sustainability. 2021;13(7):3725.
- EL Sabagh A, Islam MS, Skalicky M, et al. Salinity stress in wheat (Triticum aestivum L.) in the changing climate: adaptation and management strategies. Front Agron. 2021;3:661932.
- Zhu J-K. Salt and drought stress signal transduction in plants. Annu Rev Plant Biol. 2002;53:247–273.
- Hafez EM, Omara AED, Alhumaydhi FA, et al. Minimizing hazard impacts of soil salinity and water stress on wheat plants by soil application of vermicompost and biochar. Physiol Plant. 2021;172(2):587–602.
- Goyal E, Amit SK, Singh RS, et al. Transcriptome profiling of the salt-stress response in Triticum aestivum cv. Kharchia local. Sci Rep. 2016;6:1–14.
- Hu P, Zheng Q, Luo Q, et al. Genome-wide association study of yield and related traits in common wheat under salt-stress conditions. BMC Plant Biol. 2021;21(1):1–20.
- Zimmerman SJ, Aldridge CL, Oyler-McCance SJ. An empirical comparison of population genetic analyses using microsatellite and SNP data for a species of conservation concern. BMC Genomics. 2020;21(1):1–16.
- Wilkinson PA, Winfield MO, Barker GLA, et al. CerealsDB 3.0: expansion of resources and data integration. BMC Bioinformatics. 2016;17(1):1–9.
- Grewal S, Hubbart-Edwards S, Yang C, et al . Rapid identification of homozygosity and site of wild relative introgressions in wheat through chromosome-specific KASP genotyping assays . Plant Biotechnol J. 2020;18(3):743–755.
- Henry IM, Nagalakshmi U, Lieberman MC, et al. Efficient genome-wide detection and cataloging of EMS-induced mutations using exome capture and next-generation sequencing. Plant Cell. 2014;26(4):1382–1397.
- Luo Q, Zheng Q, Hu P, et al. Mapping QTL for agronomic traits under two levels of salt stress in a new constructed RIL wheat population. Theor Appl Genet. 2021;134(1):171–189.
- Ariel O, Brouard J-S, Marete A, et al. Genome-wide association analysis identified both RNA-seq and DNA variants associated to paratuberculosis in Canadian Holstein cattle “in vitro” experimentally infected macrophages. BMC Genomics. 2021;22(1):15.
- Bakhtiarizadeh MR, Alamouti AA. RNA-Seq based genetic variant discovery provides new insights into controlling fat deposition in the tail of sheep. Sci Rep. 2020;10(1):1–13.
- Jehl F, Degalez F, Bernard M, et al. RNA-Seq data for reliable SNP detection and genotype calling: interest for coding variant characterization and cis-regulation analysis by allele-specific expression in livestock species. Front Genet. 2021;12:655707.
- Lam S, Zeidan J, Miglior F, et al. Development and comparison of RNA-sequencing pipelines for more accurate SNP identification: practical example of functional SNP detection associated with feed efficiency in Nellore beef cattle. BMC Genomics. 2020;21(1):1–17.
- Okada M, Yoshida K, Nishijima R, et al. RNA-seq analysis reveals considerable genetic diversity and provides genetic markers saturating all chromosomes in the diploid wild wheat relative Aegilops umbellulata. BMC Plant Biol. 2018;18(1):1–13.
- Muñoz-Espinoza C, Di Genova A, Sánchez A, et al. Identification of SNPs and InDels associated with berry size in table grapes integrating genetic and transcriptomic approaches. BMC Plant Biol. 2020;20(1):1–21.
- Cánovas A, Rincon G, Islas-Trejo A, et al. SNP discovery in the bovine milk transcriptome using RNA-Seq technology. Mamm Genome. 2010;21(11-12):592–598.
- Zhao Y, Wang K, Wang W, et al. A high-throughput SNP discovery strategy for RNA-seq data. BMC Genomics. 2019;20(1):1–10.
- Brouard J-S, Schenkel F, Marete A, et al. The GATK joint genotyping workflow is appropriate for calling variants in RNA-seq experiments. J Anim Sci Biotechnol. 2019;10(1):1–6.
- Kim J, Manivannan A, Kim D-S, et al. Transcriptome sequencing assisted discovery and computational analysis of novel SNPs associated with flowering in Raphanus sativus in-bred lines for marker-assisted backcross breeding. Hortic Res. 2019;6:120.
- Amirbakhtiar N, Ismaili A, Ghaffari MR, et al. Transcriptome response of roots to salt stress in a salinity-tolerant bread wheat cultivar. PLoS One. 2019;14(3):e0213305.
- Mahajan MM, Goyal E, Singh AK, et al. Shedding light on response of Triticum aestivum cv. Kharchia local roots to long-term salinity stress through transcriptome profiling. Plant Growth Regul. 2020;90(2):369–381.
- Afgan E, Baker D, Batut B, et al. The galaxy platform for accessible, reproducible and collaborative biomedical analyses: 2018 update. Nucleic Acids Res. 2018;46(W1):W537–W544.
- Babraham Bioinformatics - FastQC A Quality Control tool for High Throughput Sequence Data. Babraham.ac.uk, 2022.
- Ewels P, Magnusson M, Lundin S, et al. MultiQC: summarize analysis results for multiple tools and samples in a single report. Bioinformatics. 2016;32(19):3047–3048.
- Kim D, Pertea G, Trapnell C, et al. TopHat2: accurate alignment of transcriptomes in the presence of insertions, deletions and gene fusions. Genome Biol. 2013;14(4):R36.
- Trapnell C, Williams BA, Pertea G, et al. Transcript assembly and quantification by RNA-Seq reveals unannotated transcripts and isoform switching during cell differentiation. Nat Biotechnol. 2010;28(5):511–515.
- Smedley D, Haider S, Durinck S, et al. The BioMart community portal: an innovative alternative to large, centralized data repositories. Nucleic Acids Res. 2015;43(W1):W589–W598.
- Cock PJA, Chilton JM, Grüning B, et al. NCBI BLAST + integrated into galaxy. GigaSci. 2015;4(1):39.
- Cock PJA, Antao T, Chang JT, et al. Biopython: freely available python tools for computational molecular biology and bioinformatics. Bioinformatics. 2009;25(11):1422–1423.
- Larkin MA, Blackshields G, Brown NP, et al. Clustal W and Clustal X version 2.0. Bioinformatics. 2007;23(21):2947–2948.
- Schoch CL, Ciufo S, Domrachev M, et al. NCBI taxonomy: a comprehensive update on curation, resources and tools. Database. 2020;2020:baaa062.
- Bailey TL, Williams N, Misleh C, et al. MEME: discovering and analyzing DNA and protein sequence motifs. Nucleic Acids Res. 2006;34(Web Server issue):W369–W373.
- Tanaka E, Bailey T, Grant CE, et al. Improved similarity scores for comparing motifs. Bioinformatics. 2011;27(12):1603–1609.
- Fornes O, Castro-Mondragon JA, Khan A, et al. JASPAR 2020: update of the open-access database of transcription factor binding profiles. Nucleic Acids Res. 2020;48(D1):D87–D92.
- Zhang Y, Liu Z, Khan AA, et al. Expression partitioning of homeologs and tandem duplications contribute to salt tolerance in wheat (Triticum aestivum L.). Sci Rep. 2016;6:1–10.
- Langmead B, Salzberg SL. Fast gapped-read alignment with Bowtie 2. Nat Methods. 2012;9(4):357–359.
- Metsalu T, Vilo J. ClustVis: a web tool for visualizing clustering of multivariate data using principal component analysis and heatmap. Nucleic Acids Res. 2015;43(W1):W566–W570.
- Untergasser A, Cutcutache I, Koressaar T, et al. Primer3 – new capabilities and interfaces. Nucleic Acids Res. 2012;40(15):e115.
- Wangkumhang P, Chaichoompu K, Ngamphiw C, et al. WASP: a web-based allele-specific PCR assay designing tool for detecting SNPs and mutations. BMC Genomics. 2007;8(1):1-9.
- Cotsaftis O, Plett D, Johnson AAT, et al. Root-Specific transcript profiling of contrasting rice genotypes in response to salinity stress. Mol Plant. 2011;4(1):25–41.
- Li C, Tien H, Wen M, et al . Myo-inositol transport and metabolism participate in salt tolerance of halophyte ice plant seedlings. Physiol Plant. 2021;172(3):1619–1629.
- Duan J, Zhang M, Zhang H, et al. OsMIOX, a myo-inositol oxygenase gene, improves drought tolerance through scavenging of reactive oxygen species in rice (Oryza sativa L.). Plant Sci. 2012;196:143–151.
- Long W, Zou X, Zhang X. Transcriptome analysis of canola (Brassica napus) under salt stress at the germination stage. PLos One. 2015;10(2):e0116217.
- Munir S, Mumtaz MA, Ahiakpa JK, et al. Genome-wide analysis of myo-inositol oxygenase gene family in tomato reveals their involvement in ascorbic acid accumulation. BMC Genomics. 2020;21(1):1–15.
- Lisko KA, Torres R, Harris RS, et al. Elevating vitamin C content via overexpression of myo-inositol oxygenase and l-gulono-1,4-lactone oxidase in Arabidopsis leads to enhanced biomass and tolerance to abiotic stresses. In Vitro Cell Dev Biol Plant. 2013;49(6):643–655.
- Nepal N, Yactayo-Chang JP, Medina-Jiménez K, et al. Mechanisms underlying the enhanced biomass and abiotic stress tolerance phenotype of an Arabidopsis MIOX over-expresser. Plant Direct. 2019;3(9):e00165.
- Wang H, Xiao X, Yang M, et al. Effects of salt stress on antioxidant defense system in the root of Kandelia candel. Bot Stud. 2014;55(1):1-7.
- Siddique S, Endres S, Sobczak M, et al . Myo-inositol oxygenase is important for the removal of excess myo-inositol from syncytia induced by Heterodera schachtii in Arabidopsis roots. New Phytol. 2014;201(2):476–485.
- Nelson DE, Rammesmayer G, Bohnert HJ. Regulation of cell-specific inositol metabolism and transport in plant salinity tolerance. Plant Cell. 1998;10(5):753–764.
- Yousfi F-E, Makhloufi E, Marande W, et al. Comparative analysis of WRKY genes potentially involved in salt stress responses in Triticum turgidum L. ssp. durum. Front Plant Sci. 2016;7:2034.
- Darawi MN, Ai-Vyrn C, Ramasamy K, et al. Allele-specific polymerase chain reaction for the detection of Alzheimer’s disease-related single nucleotide polymorphisms. BMC Med Genet. 2013;14(1):1–8.
- Gaudet M, Fara A-G, Beritognolo I, et al. Allele-specific PCR in SNP genotyping. In: Methods in molecular biology, Anton A. Komar, editor. 2009. p. 415–424. Totowa, NJ: Humana Press.
- Alok A, Kaur J, Tiwari S. Functional characterization of wheat myo-inositol oxygenase promoter under different abiotic stress conditions in Arabidopsis thaliana. Biotechnol Lett. 2020;42(10):2035–2047.