
 ?Mathematical formulae have been encoded as MathML and are displayed in this HTML version using MathJax in order to improve their display. Uncheck the box to turn MathJax off. This feature requires Javascript. Click on a formula to zoom.
Abstract
Drought has historically represented the greatest abiotic stress to adversely affect the stability of soybean (Glycine max (L.) Merr.) yields in non-irrigated field conditions. To investigate the genetic basis underlying drought tolerance in soybean, we screened the seed yield per plant (YP) in a natural diversity panel of 149 accessions under both water deficit (drought-stressed; YP-S) and well-watered (full irrigation; YP-W) conditions in field and greenhouse trials and calculated a drought susceptibility index (DSI) based on the differences in yield between treatments within each accession. A total of 19 quantitative trait loci (QTLs) were identified: eight were significantly associated with YP-W, 10 were associated with YP-S, 2 were associated with DSI and one QTL was associated with both YP-S and DSI. We then compared QTLs identified here with previously reported markers and found that these loci were located in regions associated with yield-related and other agronomic traits. In particular, YP-S-associated single nucleotide polymorphism (SNP) ss246509299 in chromosome (Chr.) 8, and YP-W-associated ss249310678 on Chr. 17 were both previously correlated with canopy wilt. Eight significant QTLs were located within eight genes. Glyma.18g092200, contained ss249600231 and annotated as GmWRKY168, is reportedly responsive to cadmium. This study helps to resolve which loci contribute to yield under drought stress in soybean, and can potentially serve as markers for selection of elite, high-yield and drought tolerant varieties.
Introduction
Drought represents the single most significant environmental stress adversely affecting agricultural production on a global scale [Citation1–2]. In particular, water deficit has been predicted to increase in both frequency and severity. Improving crop tolerance to drought stress through breeding is currently considered the most economical strategy for increasing agricultural productivity and reducing water use [Citation3–5].
Soybean (Glycine max (L.) Merr.; 2n = 40) is one of the most protein- and oil-rich (40 and 20%, respectively) grain legumes and is widely consumed by both humans and livestock [Citation6]. The amount of water soybean plants require during the growth season is approximately 450–700 mm, depending on the hybrid characteristics [Citation7]. However, the sustainability of soybean yields is under threat by predicted climatic changes, with persistent droughts reported in agricultural regions of the world [Citation8–11]. During drought, yield losses in soybean reportedly reach about 40% [Citation12], even amounting to 80% at certain developmental stages and particularly severe episodes [Citation13,Citation14]. However, irrigation is unviable in many soybean-growing areas because of high costs and/or water scarcity [Citation15]. The development of drought-tolerant soybean lines is thus one of the best ways to enhance the stability and sustainability of soybean production and therefore serves as a major target for crop improvement [Citation16].
Drought response in crop plants is genetically and physiologically complex, and as a result, it has remained poorly understood. To address this problem, it is necessary to establish accurate phenotyping methods and to target traits for evaluating drought tolerance that are stable and robust to environmental variation. Several quantitative traits have been reported for screening the response to drought conditions. Major drought stress-related traits in soybean include seed yield under water deficit [Citation13], relative yield (determined by the difference between rain-fed and irrigated yields) [Citation13], drought susceptibility index [Citation9], leaf wilting [Citation17–21], water use efficiency (WUE; the quantity of crop dry matter accumulated per unit of soil water transpired) [Citation11, Citation22, Citation23], relative water content [Citation19], excised leaf water loss [Citation19], seed number per plant and stem diameter [Citation24]. Plants use various adaptive physiological strategies to cope with drought stress. In particular, the capacity for high seed yield in drought-affected fields represents the ultimate indicator of drought tolerance [Citation9, Citation25].
Strong genotype-by-environment (GE) interactions have been frequently described in the results of drought tolerance screens [Citation26] which, along with low reproducibility of response to water deficit under field conditions, can result in inaccurate evaluation of drought tolerance [Citation27,Citation28]. In addition, the process of conventional breeding for drought-tolerant crop varieties is time-consuming and labor intensive owing to the need for extensive data collection for quantitative drought tolerance traits and difficulties in selection of tolerant accessions [Citation29]. To develop improved cultivars via marker-assisted selection, researchers need to identify genomic regions associated with drought tolerance.
Previous works in quantitative trait loci (QTL) mapping of drought-related traits in soybean have cumulatively resulted in the publication of 236 QTLs related to drought in Soybase (http://www.soybase.org), which typically focus on traits such as WUE [Citation22, Citation23, Citation30–32], canopy wilting [Citation33–36], drought tolerance [Citation37] and drought index [Citation9].
A major difficulty in using QTLs for environmentally dependent traits is their instability throughout different experiments [Citation19]. In order to identify alleles that exert an effect across a wide range of drought conditions, more experiments are necessary that characterize responses to different drought severities, different developmental stages and different populations. Moreover, few studies have identified QTLs specifically related to yield-associated traits under drought conditions.
In the present study, we aimed to identify the genetic mechanisms underlying drought tolerance using association analysis in a germplasm diversity panel of 149 commercially available soybean cultivars. The objectives were to (i) analyze the genetic variation in traits that contribute to drought tolerance; and (ii) to identify the QTLs associated with both drought tolerance and yield under full irrigation and water deficit conditions. The major loci detected in this study can provide a useful resource for molecular breeding of soybean to improve drought tolerance in soybean molecular breeding.
Materials and methods
Plant materials and phenotyping
We constructed an association mapping panel consisting of 149 cultivars, among which 59 accessions were from Heilongjiang province, 86 were from Jilin province, 2 from Liaoning province, 1 from Beijing, China and 1 from Japan. Detailed information for these 149 accessions is presented in Supplemental Table S1. Three independent experiments were conducted in 2016. Field sites were located in the experimental station at Dunhuang (N40°08′51.35″E94°38′30.36″, average annual rainfall = 39.9 mm, cumulated irrigated soil) in Gansu province, Sanya (N18°23′30.37″E109°11′29.45″, average annual rainfall = 32.7 mm during November to February, sandy loam soil) in Hainan province, and one field trial was conducted with a rain shelter at the experimental research station of Nankou (N40°13′31.06″E116°05′38.86″, fluvo-aquic soil), Beijing, China. All accessions were tested under two conditions: well-watered (full irrigation; WW) and water-stressed (drought-stressed; WS). Plots were irrigated at sowing time to ensure maximum seed germination. Then, to simulate conditions that induce drought stress under WS condition, irrigation was ceased for plots in Dunhuang and Sanya, and the rain shelter was closed during precipitation in Nankou. Under WW conditions, plots were irrigated as needed to ensure normal plant growth. Field management, including fertilization, pest and disease control, was the same as that used for the general maintenance of each field site.
Table 1. Analysis of variance (ANOVA) of soybean seed yield per plant (YP) under drought stressed and full irrigation conditions for 149 soybean accessions.
At the Dunhuang experimental station, accessions were grown in two-row plots 2 m in length, with 0.50 m spacing between rows and 0.10 m spacing between plants in a randomized block design with 3 replications. At the Nankou experimental station, all accessions were grown in one-row plots 2 m long, with 0.50 m spacing between rows and 0.10 m spacing between plants, in a randomized block design with 3 replications. At the Sanya experimental station, all accessions were grown in one-row plots 5 m in length, with 0.35 m spacing between rows and 0.06 m spacing between plants in a randomized block design with 3 replications.
Five plants in the middle of each row were selected to determine seed yield per plant under full irrigation (YP-W) and drought-stressed (YP-S) conditions at maturity.
Phenotypic data analysis
The best linear unbiased prediction (BLUP) values of YP under both conditions were calculated using the MIXED procedure in SAS software v.9.1.3 [Citation38] and were used to calculate the drought susceptibility index (DSI) using the following formula:
where Yws and Yww are BLUP values of YP under WS and WW conditions, respectively, and DII = 1–
, where
and
are the averaged values across all genotypes under WS and WW conditions, respectively [Citation9, Citation39, Citation40]. Thus, the higher the yield under WS conditions, the smaller the DSI score, indicating higher drought tolerance for accessions of interest. Hereafter, YP-W, YP-S and DSI were used to evaluate seed yield under full irrigation, seed yield under water deficit and drought stress index, respectively, in the following genetic study. Analysis of variance (ANOVA) for phenotypic data was conducted using the MIXED procedure of SAS software v.9.1.3 [Citation38], with the accessions as the fixed effect and the replications as random effects. The correlation coefficients between YP-W, YP-S and DSI were calculated using the CORR procedure of SAS software v.9.1.3 [Citation38].
Genotyping and genotypic data analyses
In general, the genotyping protocol and genotypic data analyses, including population structure analysis, principal component analysis (PCA), unrooted neighbor-joining tree, analysis of molecular variance and F-statistics analysis, followed the same pipeline as described in Liu et al. [Citation41]. All of the accessions in our diversity panel were genotyped with the Illumina SoySNP6k iSelect BeadChip (Illumina, USA), which contained 5361 single nucleotide polymorphisms (SNPs) [Citation42]; the chromosomal distributions and quality control for these SNPs were demonstrated in Wen et al. [Citation43]. A subset of 4995 SNPs (with missing rates lower than 0.25 and minor allele frequency higher than 0.05) were selected from the total 5361 SNPs and used in the following analyses.
Genome-wide association study
For marker–trait associations, a multi-locus random-SNP-effect mixed linear model controlling both population structure and kinship matrices was used, and implemented by mrMLM.GUI 3.2 software [Citation44] containing six GWAS models [Citation44–52]. The kinship coefficient between each accession pair was estimated in TASSEL 5.0 using the Loiselle algorithm [Citation53]. Markers were defined as significantly associated with the trait of interest by LOD ≥ 3 [Citation44]. To avoid false positives due to the strong LD for the nearby SNPs, the LD blocks were determined by LD decay distance (r2 = 0.1) and used as the support intervals to determine the QTLs significantly associated with a given target trait.
Results
Phenotypic variation and correlation analysis
ANOVA revealed significant variation among the different sites, as well as between blocks within each field trial, between genotypes, and significant genotype-by-environment (GE) interactions (). Significant variation emerged among replicate blocks within each of the three environments, which indicated that effects on the ANOVA linear model could be introduced by distribution across blocks (Supplemental Tables S2 and S3). The results also showed smaller effects of GE interaction in comparison with the effects of genotype. This finding suggested that phenotypic variation was likely dependent on variations in genotype.
Table 2. Descriptive statistics of seed yield per plant (YP) under drought stressed and full irrigation conditions and DSI-YP values for 149 soybean cultivars.
Table 3. Phenotypic BLUP (best linear unbiased prediction) correlations between seed yield per plant (YP) under drought stressed and full irrigation conditions and DSI-YP in the 149 soybean cultivars.
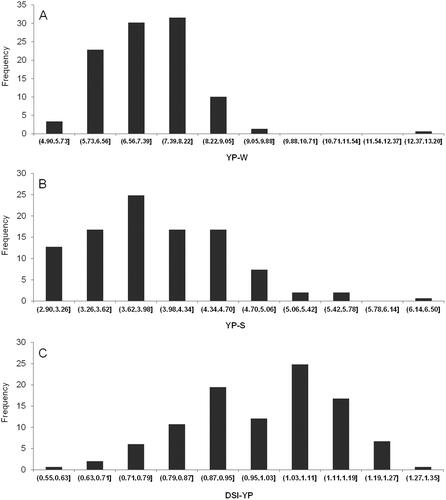
The average YP-W was 7.248 (range: 4.9127 − 13.1329; coefficient of variation, CV: 13.35), which was significantly higher than that of YP-S, that is, 4.0045 (range: 2.9344 − 6.4222; CV: 15.79) (; ). Consequently, the average DSI was 0.9964 (range: 0.5745 − 1.2719; CV: 14.43). Pearson’s correlation analysis among treatments and DSI scores revealed a positive correlation between YP-W and YP-S (r = 0.6950; p < 0.001), while DSI shared a positive relationship with YP-W (r of 0.1865; p < 0.05), but displayed a negative correlation with YP-S (r = −0.5711; p < 0.001) (). These results thus indicated that cultivars with high yield under full irrigation conditions were apparently more likely to exhibit a lower reduction in yield under water deficit conditions, therefore suggesting that selection of high-yield cultivars was necessary for higher yield during water limitation. Furthermore, the higher the yield for a given cultivar under water deficit, the smaller the yield reduction and the lower their DSI.
Figure 1. Frequency distributions of YP-W (A), YP-S (B) and DSI (C) in the 149 soybean accessions.
Based on the YP-S, YP-W and DSI, elite accessions were screened. Some accessions, including Jiunong 33 (ZDD24511), Changnong 8 (ZDD23773) and Jiyu 54 (ZDD23720), presenting higher YP-S and YP-W and smaller DSI, were selected. Those accessions have potential to be used as the founder parents in soybean breeding with high drought tolerance.
Genetic diversity of the 149 accessions based on 4955 SNPs
Genetic diversity analyses based on 4955 SNPs showed average values of 0.2310 for MAF, 0.3064 for gene diversity, 0.0737 for heterozygosity and 0.2450 for PIC (Supplemental Table S4, Supplemental Figure S1). In addition, LD analysis revealed mean r2 = 0.2678 for the whole genome, which decreased to half that of the maximum at ∼2100 kb decay distance. By contrast, r2 was < 0.1 at a decay distance of 10,500 kb (Supplemental Figure S2). Taken together, these findings showed that LD decay was relatively slow throughout the diversity panel population. Moreover, the SNP marker density was 188.77 kb across the full test population, indicating that this set of SNPs was sufficiently robust for accurate detection of major drought tolerance QTLs in this population.
Figure 2. Genetic structure and relatedness of the 149 soybean accessions. (A) Evolution of the natural logarithm probability of the data against K and the magnitude of Δk for each k value. (B) Clustering using k = 2 for the entire panel of soybean accessions. Each accession is represented by a vertical bar, partitioned into colored segments with the length of each segment representing the proportion of each individual genome contributed by either group when k = 2. (C) Unrooted neighbor-joining tree constructed using SNP data; soybean accessions from Heilongjiang are shown in red; from Jilin are shown in black; from Beijing are shown in purple; and from Japan are shown in blue. (D) Principal component analysis for the entire panel of soybean accessions.
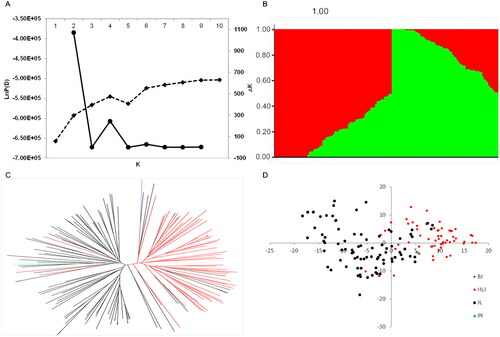
Table 4. SNPs significantly associated with YP under drought stressed and full irrigation conditions and DSI-YP.
We next performed STRUCTURE analysis, and the resulting Δk values indicated an appropriate subdivision based on k = 2, that is, two main clusters emerged from the total association panel population (). Accessions largely from Jilin province (71 out of 78) comprised one of the groups, while the other main group consisted mostly of accessions from Heilongjiang province (54 out of 71) (Supplemental Table S5). In order to better understand the evolutionary relationships among these accessions, we also reconstructed a neighbor-joining phylogeny based on shared allele frequency. The results were in agreement with that of the STRUCTURE analysis and further supported the division of the panel of 149 accessions into two clades associated with geographical origin (). Subsequent PCA analysis of population structure using the 4995 SNPs revealed an obvious separation of the accessions into two clusters (), which further supported the results of STRUCTURE and phylogenetic analyses. We also performed analysis of molecular variance [Citation54] and F-statistics analysis [Citation55] to identify differentiation within the panel, and the resulting significant pairwise FST value of 0.17 (p < 0.001, Supplemental Table S6) indicated that the 149 accessions could be separated into two distinct sub-populations. Collectively, these results indicated that GWAS should use a Q matrix generated with k = 2 to screen for loci associated with seed yield under two treatments and drought susceptibility index.
QTLs for the drought tolerance traits
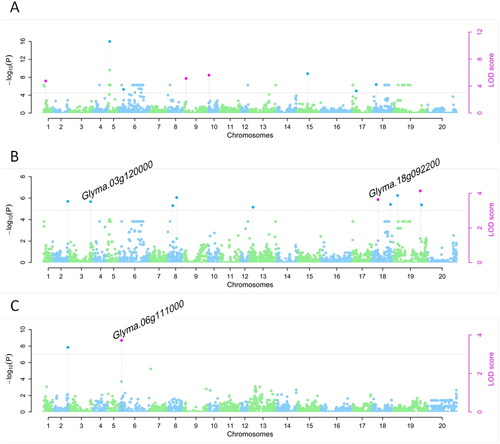
GWAS revealed that 19 QTLs were identified and distributed across 13 chromosomes (), each of which explained 6.51% of the phenotypic variation on average (). Two QTLs were found on each of chromosomes 6 and 8, while chromosomes 18 and 19 each harbored three QTLs. Among the 19 QTLs detected by GWAS, 8 were associated with YP-W, 10 were associated with YP-S and 2 were associated with DSI, one of which was associated with both YP-S and DSI. It warrants mention that 11 of the QTLs reported here were located within 500 kb of QTLs identified using segregating populations in a previous study (). Among these previously reported QTLs, two were significantly associated with canopy-wilt, and one of these was also associated with drought index. Two of the other QTLs reported in this region were associated with seed coat hardness and root-related traits ().
Figure 3. Manhattan plots from the Q + K model across YP-W (A), YP-S (B) and DSI-YP (C). The names of candidate genes that are hit by significant SNPs are labeled on the top.
Candidate gene identification
We also looked for genes in close proximity or directly harboring these associated QTLs detected in this study (Supplemental Table S7) and found that eight QTLs were located within eight genes. In addition, two were found in exons, five within introns, and one was located in a 3’UTR. Specifically, Glyma.06g111000, encoding a pyridoxal phosphate (PLP)-dependent transferase superfamily protein, contained ss245842048 and was expressed with high level in leaf tissue, while Glyma.18g092200, encoding a WRKY family transcription factor, contained ss249600231. In addition, Glyma.18g092200, annotated as GmWRKY168, is reportedly responsive to cadmium [Citation84], but exhibits no response to high salt concentrations [Citation85]. Another gene, Glyma.03g120000, encoding alpha-l-arabinofuranosidase and highly expressed in roots, which contains a SNP in its 3′UTR, was reported to be down-regulated gene by shading [Citation86]. We also found eleven QTLs located directly upstream or downstream of genes, among which four appeared likely to be located in the promoter regions, including ss250063822, ss246509299, ss245889259 and ss246573652. However, the function of these genes remains uncharacterized in soybean, and future work will clarify whether and how they could affect drought tolerance and yield in soybean.
Discussion
Decreased yield due to drought stress poses a long-standing problem for soybean breeders [Citation87], given the role of drought as the most detrimental environmental factor limiting yield in cropping systems dependent on rain for irrigation. Currently, little is known about the underlying genetic basis of drought tolerance in soybean. While our results showed that YP-W was significantly higher than YP-S across accessions ( and ), the results of ANOVA revealed significant variation between replicates associated with field site (environment) and strong genotype-by-environment interactions for both YP-W and YP-S treatments (Supplemental Tables S2 and S3). These confounding factors thus increase the difficulty of determining effects due strictly to water deficit and can complicate field selection of tolerant accessions. To circumvent this issue in this work, we used the BLUP of genotypic value for each accession under each treatment as the phenotype.
In our study, YP-S and YP-W were significantly correlated (). The positive correlation between seed yield in water limited versus fully irrigated environments is in agreement with similar findings by Ramirez-Vallejo and Kelly [Citation88] and Du et al. [Citation9, Citation19]. Therefore, cultivars with the highest yield under water deficit conditions are most likely to be selected from among cultivars with the highest yield under full irrigation. Previous studies have proposed that cultivars with robust drought tolerance should exhibit stable yields, meaning that they have high yields in both normal and drought years, or at least display a limited reduction in yield under water deficit [Citation89]. Ideal varieties can be bred through selection under both water-limited and full water environmental conditions, and the combination of mean seed yield in both drought stress-inducing and non-stress environments is recommended as the most effective criterion for selecting drought-resistant genotypes [Citation39].
Seminal work by Fischer and Maurer [Citation90] showed that the effects of variation on plant phenological characteristics and yield potential in tolerant genotypes can be minimized through the use of a yield-based drought susceptibility index (DSI) calculated by the relative loss in yield between drought and non-drought treatments within individual genotypes. Thus, the DSI may be the same for both high and low yielding varieties, dependent on their proportional reduction in yield under water restriction. The strategy of combining yield under both conditions, to calculate DSI, was further supported by Du et al. [Citation9] for screening elite drought-tolerant lines.
In this study, we found eight QTLs that were significantly associated with YP-W, 10 associated with YP-S, but none that were significantly associated with seed yield under both treatments. Previous studies have proposed that instability in yields between drought-stressed and full irrigation conditions could be at least partially explained by regulatory contributions of several, unlinked (i.e., distributed across several chromosomes), small-effect loci [Citation91]. Similarly, other early studies proposed that environmental variability can introduce GE interactions that lead to differential gene expression during drought stress compared to their expression profiles under full irrigation [Citation9].
Since environmental conditions influence QTL stability, which can confound marker-assisted selection, QTLs that are robust to environmental variability may be therefore more informative than those detectable only under specific conditions. Thus, the QTLs identified here were compared with QTLs reported within a 500 kb vicinity using the Soybase (http://www.soybase.org) web-based toolkit. This analysis showed that 11 of the 19 QTLs we found were mapped to genomic regions previously associated with drought tolerance, seed yield and other traits. In addition, the overlap of QTLs associated with different traits could also be due to common physiological features shared between these traits or even a directly causal relationship between them [Citation92]. However, these hypothetical interactions could potentially reduce the likelihood of finding false positive QTLs in overlapping regions. While this possibility is interesting, these overlapping QTLs require further detailed characterization and validation. The other eight detected QTLs that we identified in this study have not been reported in previous studies.
Notably, we found that ss244871057 (Chr.2) associated with both DSI-YP and YP-S, was located in the same region as QTLs responsible for seed coat hardness [Citation56], lateral root density [Citation57] and root dry weight [Citation58]. Root characteristics such as deeper taproots or fibrous lateral roots are reportedly related to soybean drought tolerance [Citation93–94]. In addition, drought tolerance in this crop is also purportedly associated with seed coat hardness, and cultivars with strong drought tolerance frequently also exhibit high percentage of seed hardness [Citation95]. Our analysis also showed that the region containing the QTL for SNP marker ss246509299 (Chr.8) correlated with YP-S is 121,598 bp distant from Satt424, detected by Abdel-Haleem et al. [Citation34], which is associated with delayed canopy wilting. Interestingly, one QTL related with seed coat hardness [Citation56] and a QTL related with root weight [Citation67] were also identified in the same region as ss246509299. It also deserves mention that the region containing the QTL for SNP marker ss249310678 (Chr.17), significantly associated with YP-W, is 147,691 bp away from Satt154, reported by both Charlson et al. [Citation33] and Hwang et al. [Citation35] as also significantly associated with delayed canopy wilting. This satt154 marker was also described by Hwang et al. [Citation36] as significantly related to canopy wilting, and by Du et al. [Citation9] as associated with DSI. Collectively, these results indicate that these QTLs may be valuable for improvement of drought tolerance in elite, high-yield lines.
This work also shows that seven QTLs, distributed across Chr. 2, 6, 8, 10, 17, 18 and 19, are genetically linked to markers associated with seed weight- and yield-related traits (). In particular, the YP-S-associated SNP marker ss250223327 (Chr. 19) is located 344,261 bp away from Satt156, which is reportedly correlated with seed weight [Citation77] and seed protein content [Citation83]. This SNP is also 27,174 bp from Satt481, reportedly associated with seed protein and seed oil [Citation60]. These findings suggest that these QTL regions could also be used in the concurrent improvement of tolerance and yield.
Conclusions
In this study, 19 SNP–trait associations were identified by GWAS. Among them two SNPS were significantly associated with DSI, and 11 SNPs were located in or close to agronomically important QTL mapped by linkage analysis. Eight candidate genes were identified and Glyma.18g092200 annotated as GmWRKY168. The important drought-tolerant SNPs and potential genes in this study, will be useful and feasible to accelerate genetic gain in soybean breeding.
Authors’ contributions
Zhangxiong Liu, Lijuan Qiu and Xusheng Qi: Conceptualization and Writing – revision and editing. Zhangxiong Liu and Lijuan Qiu: Resources. Zhangxiong Liu, Xingrong Wang, Yanjun Zhang and Zuowang Gou: Investigation. Huihui Li, Honglei Ren, Zixiang Wen, Yinghui Li, Lili Yu, Huawei Gao, and Dechun Wang: Data curation. Zhangxiong Liu, Huihui Li, Xingrong Wang, Yanjun Zhang and Xingzhen Zhao: Writing - original draft.
Supplemental Material
Download Zip (679.6 KB)Disclosure statement
The authors declare no potential conflicts of interest with respect to the research, authorship, and/or publication of this article.
Data availability statement
The data that support the findings of this study are available from the corresponding author, [LJQ], upon reasonable request.
Additional information
Funding
References
- Tuberosa R, Salvi S. Genomics-based approaches to improve drought tolerance of crops. Trends Plant Sci. 2006;11(8):405–412.
- Cattivelli L, Rizza F, Badeck FW, et al. Drought tolerance improvement in crop plants: an integrated view from breeding to genomics. Field Crop Res. 2008;105(1–2):1–14.
- Bruce WB, Edmeades GO, Barker TC. Molecular and physiological approaches to maize improvement for drought tolerance. J Exp Bot. 2002;53(366):13–25.
- RÖnnberg-Wästljung AC, Glynn C, Weih M. QTL analyses of drought tolerance and growth for a Salix dasyclados × Salix viminalis hybrid in contrasting water regimes. Theor Appl Genet. 2005;110(3):537–549.
- Xiong LM, Wang RG, Mao GH, et al. Identification of drought tolerance determinants by genetic analysis of root response to drought stress and abscisic acid. Plant Physiol. 2006;142(3):1065–1074.
- Lee SH, Park KY, Lee HS, et al. Genetic mapping of QTLs conditioning soybean sprout yield and quality. Theor Appl Genet. 2001;103:702–709.
- Dogan E, Kirnak H, Copur O. Deficit irrigations during soybean reproductive stages and CROPGRO-soybean simulations under semi-arid climatic conditions. Field Crop Res. 2007;103(2):154–159.
- He CY, Zhang JS, Chen SY. A soybean gene encoding a proline-rich protein is regulated by salicylic acid, an endogenous circadian rhythm and by various stresses. Theor Appl Genet. 2002;104(6-7):1125–1131.
- Du W, Wang M, Fu S, et al. Mapping QTL for seed yield and drought susceptibility index in soybean (Glycine max L.) across different environments. J Genet Genomics. 2009a;36(12):721–731.
- Dai A. Increasing drought under global warming in observation sand models. Nature Clim Change. 2013;3(1):52–58.
- Hufstetler EV, Boerma HR, Carter TE, et al. Genotypic variation for three physiological traits affecting drought tolerance in soybean. Crop Sci. 2007;47(1):25–35.
- Specht JE, Hume DJ, Kumudini SV. Soybean yield potential—a genetic and physiological perspective. Crop Sci. 1999;39(6):1560–1570.
- Oya T, Nepomuceno AL, Neumaier N, et al. Drought tolerance characteristics of Brazilian soybean cultivars – evaluation and characterization of drought tolerance of various Brazilian soybean cultivars in the field. Plant Prod Sci. 2004;7(2):129–137.
- Dias FG, Borges ACN, Viana AAB, et al. Expression analysis in response to drought stress in soybean: shedding light on the regulation of metabolic pathway genes. Genet Mol Biol. 2012;35(1 (suppl):222–232.
- Saleem A, Aper J, Muylle H, et al. Response of a diverse European soybean collection to “short duration” and “long duration” drought stress. Front Plant Sci. 2022;13:818766.
- Pennisi E. The blue revolution, drop by drop, gene by gene. Science. 2008;320(5873):171–173.
- Sloane RJ, Patterson RP, Carter TE. Field drought tolerance of a soybean plant introduction. Crop Sci. 1990;30(1):118–123.
- Ebdon JS, Kopp KL. Relationships between water use efficiency, carbon isotope discrimination, and turf performance in genotypes of Kentucky bluegrass during drought. Crop Sci. 2004;44(5):1754–1762.
- Du W, Yu D, Fu S. Detection of quantitative trait loci for yield and drought tolerance traits in soybean using a recombinant inbred line population. J Integr Plant Biol. 2009;51(9):868–878.
- Kaler AS, Ray JD, Schapaugh WT, et al. Genome wide association mapping of canopy wilting in diverse soybean genotypes. Theor Appl Genet. 2017;130(10):2203–2217.
- Steketee CJ, Schapaugh WT, Carter TE, et al. Genome-wide association analyses reveal genomic regions controlling canopy wilting in soybean. G3 (Bethesda). 2020;10(4):1413–1425.
- Mian MAR, Bailey MA, Ashley DA, et al. Molecular markers associated with water use efficiency and leaf ash in soybean. Crop Sci. 1996;36(5):1252–1257.
- Mian MAR, Ashley DA, Boerma HR. An additional QTL for water use efficiency in soybean. Crop Sci. 1998;38(2):390–393.
- Chen L, Fang Y, Li X, et al. Identification of soybean drought-tolerant genotypes and loci correlated with agronomic traits contributes new candidate genes for breeding. Plant Mol Biol. 2020;102(1–2):109–122.
- Ye H, Roorkiwal M, Valliyodan B, et al. Genetic diversity of root system architecture in response to drought stress in grain legumes. J Exp Bot. 2018;69(13):3267–3277.
- Chapman SC. Use of crop models to understand genotype by environment interactions for drought in real world and simulated plant breeding trials. Euphytica. 2008;161(1–2):195–208.
- Dolferus R, Ji X, Richards RA. Abiotic stress and control of grain number in cereals. Plant Sci. 2011;181(4):331–341.
- Hall AJ, Feoli C, Ingaramo J, et al. Gaps between farmer and attainable yields across rainfed sunflower growing regions of Argentina. Field Crop Res. 2013;143:119–129.
- Ribaut JM, Jiang C, Gonzalez-de-Leon D, et al. Identification of quantitative trait loci under drought conditions in tropical maize. 2. Yield components and marker assisted selection strategies. Theor Appl Genet. 1997;94(6-7):887–896.
- Kumar M, Lal SK. Molecular analysis of soybean varying in water use efficiency using SSRs markers. J Environ Biol. 2015;36(4):1011–1016.
- Kaler AS, Dhanapal AP, Ray JD, et al. Genome-wide association mapping of carbon isotope and oxygen isotope ratios in diverse soybean genotypes. Crop Sci. 2017;57(6):3085–3100.
- Dhanapal AP, Ray JD, Singh SK, et al. Genome-wide association study (GWAS) of carbon isotope ratio (δ 13 C) in diverse soybean [Glycine max (L.) Merr.]. Theor Appl Genet. 2015;128(1):73–91.
- Charlson D, Bhatnagar S, King C, et al. Polygenic inheritance of canopy wilting in soybean [Glycine max (L.) merr.]. Theor Appl Genet. 2009;119(4):587–594.
- Abdel-Haleem H, Carter TE, Purcell LC, et al. Mapping of quantitative trait loci for canopy-wilting trait in soybean (Glycine max L. Merr). Theor Appl Genet. 2012;125(5):837–846.
- Hwang S, King C, Ray J, et al. Confirmation of delayed canopy wilting QTLs from multiple soybean mapping populations. Theor Appl Genet. 2015;128(10):2047–2065.
- Hwang S, King A, Chen P, et al. Meta-analysis to refine map position and reduce confidence intervals for delayed-canopy-wilting QTLs in soybean. Mol Breed. 2016;36(7):1–4.
- Carpentieri-Pipolo V, Pipolo AE, Abdel-Haleem H, et al. Identification of QTLs associated with limited leaf hydraulic conductance in soybean. Euphytica. 2012;186(3):679–686.
- SAS Institute Inc. SAS/STAT software: version 9.1.3. Cary, NC: SAS Institute, 2007.
- Terán H, Singh SP. Comparison of sources and lines selected for drought resistance in common bean. Crop Sci. 2002;42(1):64–70.
- Lopez CG, Banowetz GM, Peterson CJ, et al. Dehydrin expression and drought tolerance in seven wheat cultivars. Crop Sci. 2003;43(2):577–582.
- Liu Z, Li H, Gou Z, et al. Genome-wide association study of soybean seed germination under drought stress. Mol Genet Genomics. 2020;295(3):661–673.
- Akond M, Liu S, Schoener L, et al. SNP-based genetic linkage map of soybean using the SoySNP6K illumina infinium BeadChip genotyping array. PGGB. 2013;1(3):80–89.
- Wen Z, Tan R, Yuan J, et al. Genome-wide association mapping of quantitative resistance to sudden death syndrome in soybean. BMC Genomics. 2014;15(1):809.
- Zhang YW, Tamba CL, Wen YJ, et al. mrMLM v4.0.2: an R platform for multi-locus genome-wide association studies. Genomics Proteomics Bioinform. 2020;18(4):481–487.
- Wang SB, Feng JY, Ren WL, et al. Improving power and accuracy of genome-wide association studies via a multi-locus mixed linear model methodology. Sci Rep. 2016;6:19444.
- Tamba CL, Ni YL, Zhang YM. Iterative sure independence screening EM-Bayesian LASSO algorithm for multi-locus genome-wide association studies. PLoS Comput Biol. 2017;13(1):e1005357.
- Zhang J, Feng JY, Ni YL, et al. pLARmEB: integration of least angle regression with empirical Bayes for multi-locus genome-wide association studies. Heredity (Edinb). 2017;118(6):517–524.
- Ren WL, Wen YJ, Dunwell JM, et al. pKWmEB: integration of Kruskal-Wallis test with empirical Bayes under polygenic background control for multi-locus genome-wide association study. Heredity (Edinb). 2018;120(3):208–218.
- Tamba CL, Zhang YM. A fast mrMLM algorithm for multi-locus genome-wide association studies. bioRxiv. 2018:341784.
- Wen YJ, Zhang H, Ni YL, et al. Methodological implementation of mixed linear models in multi-locus genome-wide association studies. Brief Bioinform. 2018;19(4):700–712.
- Zhang YM, Mao Y, Xie C, et al. Mapping quantitative trait loci using naturally occurring genetic variance among commercial inbred lines of maize (Zea mays L.). Genetics. 2005;169(4):2267–2275.
- Zhang YM, Jia Z, Dunwell JM. Editorial: the applications of new multi-locus GWAS methodologies in the genetic dissection of complex traits. Front Plant Sci. 2019;10:100.
- Loiselle BA, Sork VL, Nason J, et al. Spatial genetic structure of a tropical understory shrub, PSYCHOTRIA OFFICINALIS (Rubiaceae). Am J Bot. 1995;82(11):1420–1425.
- Excoffier L, Smouse PE, Quattro JM. Analysis of molecular variance inferred from metric distances among DNA haplotypes: application to human mitochondrial DNA restriction data. Genetics. 1992;131(2):479–491.
- Excoffier L, Laval G, Schneider S. Arlequin (version 3.0): an integrated software package for population genetics data analysis. Evol Bioinform. 2005;1:47–50.
- Kuroda Y, Kaga A, Norihiko T, et al. QTL affecting fitness of hybrids between wild and cultivated soybeans in experimental fields. Ecol Evol. 2013;3(7):2150–2168.
- Liang H, Yu Y, Yang H, et al. Inheritance and QTL mapping of related root traits in soybean at the seedling stage. Theor Appl Genet. 2014;127(10):2127–2137.
- Zhang D, Cheng H, Geng L, et al. Detection of quantitative trait loci for phosphorus deficiency tolerance at soybean seedling stage. Euphytica. 2009;167(3):313–322.
- Kato S, Sayama T, Fujii K, et al. A major and stable QTL associated with seed weight in soybean across multiple environments and genetic backgrounds. Theor Appl Genet. 2014;127(6):1365–1374.
- Mao T, Jiang Z, Han Y, et al. Identification of quantitative trait loci underlying seed protein and oil contents of soybean across multi-genetic backgrounds and environments. Plant Breed. 2013;132(6):630–641.
- Han Y, Teng W, Wang Y, et al. Unconditional and conditional QTL underlying the genetic interrelationships between soybean seed isoflavone, and protein or oil contents. Plant Breed. 2015;134(3):300–309.
- Han Y, Li D, Zhu D, et al. QTL analysis of soybean seed weight across multi-genetic backgrounds and environments. Theor Appl Genet. 2012;125(4):671–683.
- Ning H, Yuan J, Dong Q, et al. Identification of QTLs related to the vertical distribution and seed-set of pod number in soybean [Glycine max (L.) Merri]. PLoS One. 2018;13(4):e0195830.
- Lu W, Wen Z, Li H, et al. Identification of the quantitative trait loci (QTL) underlying water soluble protein content in soybean. Theor Appl Genet. 2013;126(2):425–433.
- Yao D, Liu Z, Zhang J, et al. Analysis of quantitative trait loci for main plant traits in soybean. Genet Mol Res. 2015;14(2):6101–6109.
- Swaminathan S, Abeysekara N, Liu M, et al. Quantitative trait loci underlying host responses of soybean to Fusarium virguliforme toxins that cause foliar sudden death syndrome. Theor Appl Genet. 2016;129(3):495–506.
- Brensha W, Kantartzi S, Meksem K, et al. Genetic analysis of root and shoot traits in the ‘Essex’ by ‘Forrest’ recombinant inbred line (RIL) population of soybean [Glycine max (L.) Merr]. JPGS. 2012;1(1):1–9.
- Brucker E, Carlson S, Wright E, et al. Rhg1 alleles from soybean PI 437654 and PI 88788 respond differentially to isolates of Heterodera glycines in the greenhouse. Theor Appl Genet. 2005;111(1):44–49.
- Guzman PS, Diers BW, Neece DJ, et al. QTL associated with yield in three backcross-derived populations of soybean. Crop Sci. 2007;47(1):111–122.
- Fox C, Cary T, Nelson R, et al. Confirmation of a seed yield QTL in soybean. Crop Sci. 2015;55(3):992–998.
- Tischner T, Allphin L, Chase K, et al. Genetics of seed abortion and reproductive traits in soybean. Crop Sci. 2003;43(2):464–473.
- Hu Z, Zhang H, Kan G, et al. Determination of the genetic architecture of seed size and shape via linkage and association analysis in soybean (Glycine max L. Merr.). Genetica. 2013;141(4–6):247–254.
- Han Y, Teng W, Yu K, et al. Mapping QTL tolerance to phytophthora root rot in soybean using microsatellite and RAPD/SCAR derived markers. Euphytica. 2008;162(2):231–239.
- Fan S, Li B, Yu F, et al. Analysis of additive and epistatic quantitative trait loci underlying fatty acid concentrations in soybean seeds across multiple environments. Euphytica. 2015;206(3):689–700.
- Wang J, Chen P, Wang D, et al. Identification of quantitative trait loci for oil content in soybean seed. Crop Sci. 2015;55(1):23–34.
- Reinprecht Y, Poysa V, Yu K, et al. Seed and agronomic QTL in low linolenic acid, lipoxygenase-free soybean (Glycine max (L.) Merrill) germplasm. Genome. 2006;49(12):1510–1527.
- Hyten DL, Pantalone VR, Sams CE, et al. Seed quality QTL in a prominent soybean population. Theor Appl Genet. 2004;109(3):552–561.
- Sun Y, Pan J, Shi X, et al. Multi-environment mapping and meta-analysis of 100-seed weight in soybean. Mol Biol Rep. 2012;39(10):9435–9443.
- Sun D, Li W, Zhang Z, et al. Quantitative trait loci analysis for the developmental behavior of soybean (Glycine max L. Merr.). Theor Appl Genet. 2006;112(4):665–673.
- Vuong T, Sleper D, Shannon J, et al. Novel quantitative trait loci for broad-based resistance to soybean cyst nematode (Heterodera glycines ichinohe) in soybean PI 567516C. Theor Appl Genet. 2010;121(7):1253–1266.
- Li D, Pfeiffer T, Cornelius P. Soybean QTL for yield and yield components associated with Glycine soja alleles. Crop Sci. 2008;48(2):571–581.
- Qi Z, Wu Q, Han X, et al. Soybean oil content QTL mapping and integrating with meta-analysis method for mining genes. Euphytica. 2011;179(3):499–514.
- Tajuddin T, Watanabe S, Yamanaka N, et al. Analysis of quantitative trait loci for protein and lipid contents in soybean seeds using recombinant inbred lines. Breed. Sci. 2003;53(2):133–140.
- Cai Z, Xian P, Wang H, et al. Transcription factor GmWRKY142 confers cadmium resistance by up-regulating the cadmium tolerance 1-like genes. Front Plant Sci. 2020;11:724.
- Yu Y, Wang N, Hu R, et al. Genome-wide identification of soybean WRKY transcription factors in response to salt stress. Springerplus. 2016;5(1):920.
- Li Y, Jiang H, Sun X, et al. Quantitative proteomic analyses identified multiple sugar metabolic proteins in soybean under shade stress. J Biochem. 2019;165(3):277–288.
- Zhang Y, Liu Z, Wang X, et al. Identification of genes for drought resistance and prediction of gene candidates in soybean seedlings based on linkage and association mapping. Crop J. 2022;10(3):830–839.
- Ramirez-Vallejo P, Kelly JD. Traits related to drought resistance in common bean. Euphytica. 1998;99(2):127–136.
- Bhatia VS, Jumrani K, Pandey GP. Developing drought tolerance in soybean using physiological approaches. Soybean Res. 2014;12:1–19.
- Fischer RA, Maurer R. Drought resistance in spring wheat cultivars. Aust J Agric Res. 1978;29(5):897–912.
- Beavis WD, Smith OS, Grant D, et al. Identification of quantitative trait loci using a small sample of top crossed and F4 progeny from maize. Crop Sci. 1994;34(4):882–896.
- Tuberosa R, Sanguineti MC, Landi P, et al. Identification of QTLs for root characteristics in maize grown in hydroponics and analysis of their overlap with QTLs for grain yield in the field at two regimes. Plant Mol Biol. 2002;48(5-6):697–712.
- Manavalan LP, Guttikonda SK, Nguyen VT, et al. Evaluation of diverse soybean germplasm for root growth and architecture. Plant Soil. 2010;330(1–2):503–514.
- Kaspar TC, Taylor HM, Shibles RM. Taproot elongation rates of soybean cultivars in the glasshouse and their relation to field rooting depth. Crop Sci. 1984;24(5):916–920.
- Lam HM, Chang R, Shao G. Chapter 1: Drought. In: Liu X, editor. Research on tolerance to stresses in Chinese soybean. Beijing: China Agriculture Press; 2009. p. 20.