
Abstract
Sertoli cells constitutively maintain the spermatogonial stem cell niche and blood-testis barrier via impenetrable tight junctions under hormonal, growth factor and cytokine control. Immature Sertoli cell proliferation and survival benefit from FSH, NF-κB, and IL-1α-dependent signalling effective via the MAPK family of pathways and related to p38 MAPK dependent Ca2+ and K+ fluxes. Little is known about how the NF-κB and MAPK axis interact with pro-inflammatory NOD1/TLR4 and different voltage-gated channels. Silencing MAPK1, we found that MAPK1/ERK2 has a synergistic role with TLR4 in restricting the pro-inflammatory NF-κB/Caspase-1/IL-1β axis while having an antagonistic effect on TLR4 in promoting adult 15 P-1 Sertoli cell line proliferation and migration. In MAPK1/ERK2 absence, there was an unexpected TLR4-NF-κB behaviour, showing a strong NF-κB transactivation, assessed using a pNIFTY-SEAP reporter plasmid, accompanied by significantly activated cell migration and proliferation, as demonstrated by the wound healing assay. Voltage-gated potassium flux, most likely via Kv1.3, was significantly increased after TLR4 and NOD1 challenge in ATP DAMP signal presence, associated with inflammasome activation. TLR4 challenge also activated macroautophagy while inhibiting mitophagy. Thus, TLR4 activation restricted the NF-κB and Caspase-1/IL-1β pro-inflammatory axis, cell migration and proliferation, voltage-gated potassium efflux, and shifted mitophagy to macroautophagy (towards an inflammasome pathway-related cell death), promoting cell survival. MAPK1/ERK2 had a differential effect, as in its absence, TLR4 activation had the opposite effect on NF-κB transactivation and cell migration and proliferation. Thus, TLR4/MAPK1/NF-κB/Kv1.3 interaction provides optimal Sertoli cell maintenance conditions and allows cell death only in extreme circumstances of cumulative DAMP/PAMP signalling stimulation.
Introduction
Sertoli cells, a distinct category of somatic cells found within the testis, play a pivotal role in the sustaining of spermatogenesis. They are not only integral to the maturation process of sperm cells, but also provide the requisite structural and nutritional support for the developing germ cells. Before interacting with the germ cells, Sertoli cells form tight junctions (TJs), thereby contributing to the formation of the blood-testis barrier. Follicle-stimulating hormone (FSH) is vital for the early development, proliferation and maturation of Sertoli cells, as well as the formation of these tight junctions. This process is crucial for the proper functioning of the male reproductive system [Citation1,Citation2]. The mitogenic effect of FSH is enhanced by interleukins 1 alpha (IL-1α) and 1 beta (IL-1β). However, in mature Sertoli cells, only IL-1α promotes the development of tight junctions [Citation3,Citation4], while IL-1β disrupts it [Citation5,Citation6].
Mitogen-activated protein kinases (MAPKs) are involved in the signal transduction process from the plasma membrane to the nucleus. The three primary mammalian families of Mitogen-activated protein kinases (MAPKs) encompass the extracellular signal-regulated kinases (ERK), the JUN amino-terminal kinases or stress-activated protein kinases (JNK/SAPK), and the p38 kinases. All three of these types of MAPKs, which are activated by phosphorylation, are expressed in immature Sertoli cells. It seems that the different MAPK families exert mitogenic effects on Sertoli cells in a stage specific manner, as in early rat Sertoli development there is a FSH driven ERK-dependent mitogenic effect on day 5 that is later transformed to suppressive effect on day 19 by the same FSH [Citation7]. The ERK pathway is generally considered to be associated with growth factor-mediated signalling. In contrast, the p38 and JNK pathways are more closely related to apoptosis, responses to stress, and inflammation, notably cytokine signalling. However, in immature rat Sertoli cells, IL-1α triggers the activation of p38 MAPK and JNK/SAPK, but not ERK. This activation operates in synergy with the ERK-mediated mitogenic activity of FSH [Citation8]. MAPK are critical to spermatogenesis, as they are involved in the control of mammalian testes cell survival (or death) and also contribute to the blood-testis barrier formation, but also putative disruption via tumour necrosis factor alpha (TNFα)/p38 MAPK involvement [Citation9,Citation10]. The p38 MAPK acts on thyroid hormones signalling, but it was established recently that the p38 MAPK signalling in immature rat Sertoli cells is different than that of reverted triiodothyronine (rT3)-stimulated calcium uptake [Citation11].
The rT3 causes hyperpolarisation of Sertoli cells, opening of voltage-dependent calcium channels, entry of extracellular Ca2+, cellular depolarisation and activation of protein kinase C and MEK, and subsequent activation of the efflux of potassium ions through voltage-dependent potassium channels repolarising the Sertoli cells. Sertoli cells express several types of voltage gated potassium channels [Citation12], and recently some types like Kv1.3 were associated with membrane potential changes-initiated cell proliferation with the participation of RAF/MEK/ERK pathway conducting downstream the signal towards transcription factors such as c-Myc and others [Citation13]. In some cell types, this effect is even flux independent [Citation14].
The described effects were primarily observed during early Sertoli cell development and maturation, while less is known about the behaviour and regulation of mature adult Sertoli cells. Interestingly, the effects of FSH on the MAPK1/ERK2 pathway in mature cells are opposite to those in early development [Citation7]. To gain deeper insights, we investigated Damage-associated molecular pattern (DAMP) and Pathogen-associated molecular pattern (PAMP) signalling pathways. Specifically, we focused on pathways related to Nucleotide-binding oligomerisation domain-containing protein 1/2 (NOD1/NOD2) and Toll-like receptor 4 (TLR4) signalling, since FSH upregulates these receptor transcripts in adult mice Sertoli cells, compared to prepubertal ones [Citation15,Citation16]. Our investigations were conducted on an in vitro model of adult Sertoli cells, using the well-characterised 15 P-1 mouse cell line. We and others have previously shown that Sertoli cells express and arm a NLRP3 inflammasome, thus activating the caspase-1/IL-1β axis, which resulted in cell death, cytokine proinflammatory signalling [Citation15,Citation16] and TJ disruption by IL-1β [Citation5,Citation6]. Unlike immature Sertoli cells, in adult Sertoli cells, FSH upregulates proinflammatory genes and induces formation of TJ, while most pro-inflammatory cytokines exert disruptive effect. TJ proteins claudin-5, claudin-11 and occludin have been previously observed to be upregulated in mature adult Sertoli cells in response to NOD1 or NOD2 challenge [Citation17,Citation18]. In the absence of NLRP3 expression, claudins were downregulated, whereas occludin was upregulated. Even prepubertal primary Sertoli cells that do not form TJ in vivo due to a lack of FSH and do not express occludin in FSH-free media in vitro showed upregulated occludin expression in the absence of NLRP3 [Citation17]. Similarly, the expression of Glial cell line-derived neurotrophic factor (GDNF), which is vital for the development of the spermatogonial stem cell niche, has been discovered to be regulated by PAMP receptors and pro-inflammatory cytokines such as lipopolysaccharide (LPS), IL-1β and tumour necrosis factor alpha (TNF-α). In primary Sertoli cells, TNF-α downregulates GDNF levels through a Nuclear factor-κB (NF-κB)-dependent mechanism [Citation19]. NOD receptors are also involved in recruitment of early autophagy members like ATG16L [Citation20] and together with LPS are promotors of macroautophagy flux [Citation15]. NF-κB is differentially engaged in either pro-inflammatory or anti-apoptotic and proliferative cell survival functions, depending on the cell type and development stage. Not only is NF-κB required for autophagy induction, but also NF-κB translocation by TNF-α and other pro-inflammatory cytokines is tightly dependent on autophagy genes ATG5 and ATG7, making autophagy essential for its signalling. Energy sensing and cell proliferation inhibition in Sertoli cells are mediated by AMPK and Sirt1, while the main signal transduction pathways implicated in Sertoli cell proliferation include cAMP/PKA, ERK1/2, PI3K/Akt, and the autophagy-inhibiting mTORC1/p70SK6 pathways [Citation21].
This tight integration between cell survival, nutrient and danger response to stress, pro-inflammatory and inflammasome response with autophagy have profound consequences for both states of health and disease. That is why in this study, we investigated several complementing pathways downstream of NOD1 and TLR4 receptors signalling via NF-κB – MAPK (EKR2 or p38 MAPK) – Caspase-1 - IL-1β and K+ channels (putatively EKR2 dependent) to establish their role in Sertoli homeostasis and cell survival.
Materials and methods
Reagents and cell line(s)
The 15 P-1 Adult Sertoli cell line, obtained from ATCC (reference: CRL-2618), originated from adult male mice aged six months [Citation22]. These cells were cultured and sustained in Dulbecco’s Modified Eagle Medium (DMEM) tissue culture medium (Sigma, D5796) as per the aforementioned conditions.
The employed PAMPs/DAMPs included: γ-D-glutamyl-meso-diaminopimelic acid (iE-DAP) (InvivoGen, tlrl-iedap), used at a concentration of 5 μg/mL for 24 h in subsequent assays; Lipopolysaccharide (LPS) from E. coli, serotype EH100 (Ra) (TLRgrade) (Enzo Life Sciences, ALX-581-008), used at concentration of 5 μg/mL for 24 h; Adenosine 5′-triphosphate (ATP; disodium salt) from (SIGMA, A2383) used at a concentration of 5 mmol/L alone or after LPS/iE-DAP for 1 h.
MAPK1/ERK2 siRNA transfection
Transfection experiments were performed for 48 h using validated siRNA targeting MAPK1/ERK2 coding sequence (Qiagen, SI02654810) and PureFection™ reagent (System Bioscience, LF501A-1), according to the manufacturer’s protocol. In 6-well plates with plating density of 2 x 10⁵ and 60% confluency, a 100 μL DMEM solution was added dropwise to the wells, containing a 100 pmol MAPK1 siRNA with nucleotide sequence 5′-AAT GCT GAC TCC AAA GCT CTG-3′, and 1 μL PureFection™ reagent. The transfection efficiency was confirmed by a cell-death phenotype inducing positive control and scrambled negative control.
Wound healing assay
To investigate the interactions between MAPK1 and TLR4 pathways in cellular migration, an in vitro wound healing assay (‘scratch test’) was conducted [Citation23] using the adult Sertoli cell line 15 P-1. Cells were cultured until a confluent monolayer formed. For targeted inhibition of the MAPK1 pathway, cells were transfected with siRNA targeting MAPK1 and incubated for 48 h. TLR4 activation was performed by challenging the cells with lipopolysaccharide (LPS) for 24 h. A scratch was then carefully made across the confluent monolayer using a sterile pipette tip, and bright-field images were captured at 0-, 6- and 24-h post-scratch to assess the migration front. The rate of cell migration (RM) was calculated using the formula RM = (Wi-Wf)/t, where Wi is the initial wound width in micrometres, Wf is the final wound width in micrometres, and t is the duration of migration in hours. Data are presented as the mean rate of migration, with error bars indicating the standard error of the mean (SEM). Experiments were conducted independently and involved three technical replicates.
Nuclear factor-κB (NF-κB) SEAP live monitoring
A stable reporter Sertoli cell line containing the pNifty2-SEAP plasmid (InvivoGen, pnil-seap) and based on ATCC 15 P-1, was previously established [Citation15]. These cells were subjected to ATP treatment, either alone or alongside MAPK1/ERK2 silenced 15 P-1 Sertoli cells, or solely silenced using the same protocol. NF-κB activation was live-tracked via SEAP in the collected media, using a colourimetric detection method (InvivoGen) and 405 nm readings on a FLUOStar Optima reader (BMG Labtech, Germany).
Caspase-1 assay
Sertoli cells (2 × 10⁵/well) were plated and stimulated with LPS and iE-DAP or transfected with siRNA MAPK1/ERK2. Caspase-1 activation was detected using a Caspase-1 Colourimetric Assay Kit (BioVision, K111), which is based on spectrophotometric detection of p-nitroanilide (pNA) after cleavage from the labeled substrate YVAD-pNA, where YVAD represents enzyme specific amino-acid sequence Tyr-Val-Ala-Asp. The pNA light emission was quantified at 405 nm (BMC FLUOStar Optima). The absorbance of pNA from a treated sample was compared with an untreated control to determine the fold increase in Caspase-1 activity, presented as arbitrary units [AU]. The protein content was normalised via 280 nm readings, as described before [Citation15].
Fluorescence imaging of autophagy and mitophagy activation
Dojindo (Japan) developed fluorescent dye DAPGreen detecting autophagosome formation (like LC3) and MtPhagy, detecting mitochondrial destruction within autolysosomes (Dojindo, DG01 and MP01) [Citation2]Citation4, which were used in LPS-challenge experiments in high-glucose (growth medium DMEM, glucose (4.5 g/L), 1 mmol/L sodium pyruvate, 1500 mg/L sodium bicarbonate, 10% FBS and 1% Pen-Strep sol.) or starvation with low-glucose (1 g/L in same DMEM formulation) conditions. Sertoli cell line 15 P-1 were challenged for 24 h using LPS (2 mg/mL) followed by 2 h of ATP (5 µmol/L) treatment compared to non-treated controls in high or low glucose conditions respectively, with or without prior treatment with Bafilomycin A1 (Sigma, B1793) for 2 h. Several images (minimum 3) were captured using Axio Vert.A1 FL-LED inverted fluorescence microscope (Zeiss, DE), equipped with a digital camera. Images were evaluated visually, and semi-quantitatively scored (-, +,++,+++) for at least three fields of view, based on the assessment of the fluorescent intensity.
FluxOR™ potassium ion channel assay
The FluxOR™ Potassium Ion Channel Assay (LifeSciences, F10463) leverages the known permeability of potassium channels to thallium (Tl+) ions [Citation25]. Upon thallium addition to the extracellular solution and channel stimulation, thallium enters the cells, and the activity is detected by a proprietary indicator dye that enhances cytosolic fluorescence. Voltage gated potassium channels such as hERG, Kv1.3, Kv2.1 and Kv7.2/7.3 are opened by the co-administration of potassium and thallium in the stimulus buffer. For ligand gated channels, resting potassium channels and potassium transporters, the extra potassium is left out of the stimulus buffer, and the stimulus buffer is composed of the channel opener and thallium concentrate, which are necessarily prepared in the chloride-free buffer [Citation26]. Thus, the FluxOR™ system fluorescence signifies any ion channel activity or transport process permitting thallium entry into cells. The adult Sertoli 15 P-1 cell line was loaded with FluxOR™ reagent and subjected to the manufacturer’s protocol using ATP, LPS, ATP and LPS, or LPS, iE-DAP and ATP. The fluorescent signal was recorded before and after adding the stimulus buffer (containing final concentrations of 10 mmol/L of K2SO4 and 2 mmol/L of Tl2SO4) using a FLUOStar Optima reader (BMG Labtech, Germany). Potassium flux is represented as F/F0 (experimental signal normalised to background signal) [Citation25].
ELISA
Sertoli cells were plated on a 96-well plate (1–2.104/well) and challenged with combination of LPS and iE-DAP for 24 h, followed by 1 h stimulation with ATP, added to the cell culture media in concentration as described above. Culture fluid was collected for assessment of secreted IL-1β. The murine-specific Mouse IL-1 beta ELISA Ready-SET-Go!® (eBioscience, 88-7013-22) bioassay was applied according to the manufacturer’s instructions as described before [Citation15]. The concentrations were estimated by sigmoidal interpolation of a standard dilution assay (GraphPad Prism, v.6) using the optic density readings (λ = 405 nm) on a FLUOStar Optima reader (BMG Labtech, Germany).
Data analysis
The scores in the semiquantitative rank (-, +,++,+++) of the fluorescent images were converted to numbers (0,1,2,3), and a non-parametric Kruskal-Wallis H test (GraphPad Prism, US) was used to compare the scores among the DapGreen Autophagy or MtPhagy mitophagy markers accordingly in cases of Bafilomycin treated or non-treated, intact or LPS challenged 15 P-1 cells, provided that for each condition a 3 representative replicates were used. For all other comparisons, analysis of variance (ANOVA; GraphPad Prism, US) was used with pairwise comparison non-parametric post-hoc test.
Results
MAPK1/ERK2 singularly restricts caspase-1 activation and NF-κB transactivation. TLR4 independently curtails NF-κB transactivation, yet paradoxically amplifies it in the context of MAPK1/ERK2 silencing coupled with TLR4 activation
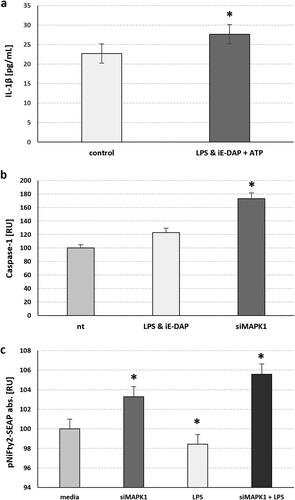
We have previously shown that challenge of TLR4 for 24 h followed by a challenge of NOD1 for another 24 h using their cognate ligands LPS or iE-DAP respectively resulted in release of mature IL-1β, and this corroborated with increase in the intracellular proform of IL-1β when combined with NOD2 co-induction, but not when combined with NOD1 induction via iE-DAP. Similarly, the combination of both NOD1 and NOD2 receptors induction resulted in a decrease in the activation of transcription factor NF-κB after 24 h, suggesting that some proinflammatory transcription factors get downregulated after their initial ligand-induced upregulation [Citation15]. Here we show that simultaneous TLR4 and NOD1 challenge for 24 h also results in release of mature IL-1β (p = 0.047) (). Since this could most often occur after NLPR3 inflammasome induced caspase-1 activation and subsequent IL-1β cleavage, as we have shown before [Citation15], we compared caspase-1 activation after this combined TLR4 & NOD1 challenge to MAPK1/ERK2 silenced conditions. We found that MAPK1/ERK2 silencing resulted in much higher caspase-1 upregulation (p = 0.011) suggesting that, in intact conditions, MAPK1 is restrictive to caspase-1 activation (), aside of regulating the Kv1.3 channels. Since the transcription factor NF-κB is tightly implicated in TLR4 pathway and inflammasome activation, we followed the NF-κB transactivation dynamics using a SEAP reporter plasmid harbouring two NF-κB response elements in the SEAP promotor. We found that TLR4 challenge with LPS for 24 h resulted in suppression of NF-κB transactivation, while MAPK1/ERK2 silencing resulted in a significant activation of NF-κB (p = 0.031) (). Even stronger activation was observed when TLR4 was challenged for 24 h in MAPK1/ERK2 silenced Sertoli cells, suggesting that MAPK1 is repressive towards NF-κB, but in its absence TLR4 activation follows a different downstream scenario and promotes the activation of NF-κB.
Figure 1. MAPK1 silencing in adult 15 P-1 Sertoli cells suggests that MAPK1 Potentiates the NF-κB pathway and caspase-1 activation, either with TLR4 challenge alone or combined with NOD1. (a) Combined TLR4 challenge using 24 h LPS treatment with NOD1 challenge using simultaneous iE-DAP treatment, followed by 1 h of ATP treatment induced mature IL-1β secretion. (b) Specific caspase-1 activation is observed 24 h after TLR4 & NOD1 ligand challenge (LPS, iE-DAP), followed by 1 h of ATP supplementation, or after 48 h of MAPK1 silencing (siMAPK1). (c) NFκB activation is assessed after 48 h of MAPK1 silencing (siMAPK1) alone or followed by a TLR4 challenge for 24 h, using the stable 15 P-1 adult Sertoli cell line harbouring the pNIFTY2-SEAP reporter, which is sensitive to NFκB translocation. The secretory alkaline phosphatase released upon binding to the NFκB response element cassette, is measured in cell media as a colour reading at 405 nm. Error bars indicate SEM. Data are representative of independent experiments with three technical replicates using the adult Sertoli cell line 15 P-1. Asterisks above bars denote statistical significance as determined by ANOVA (* p < 0.05).
MAPK1/ERK2 and TLR4 exhibit a complex interplay, with TLR4 assuming a compensatory protective function in the absence of MAPK1, as demonstrated through in vitro wound healing assays and gene silencing techniques
When further used the same TLR4 challenge in intact or MAPK1/ERK2 silencing context using a ‘wound healing’ assay to investigate TLR4 and MAPK1/ERK2 signalling effect on the combined cell migration and proliferation (). We found that TLR4 challenge alone resulted in a decrease at 24th hour, compared to control non-challenged Sertoli cells (, 2b – blue, interrupted line). Similarly, MAPK1/ERK2 silencing resulted in an increase in cell migration/proliferation at 6th and especially at 24th hour (, red line), suggesting MAPK1 to promote cell proliferation in intact Sertoli cells. Interestingly, when TLR4 was challenged in MAPK1/ERK2 silenced cells, we observed a significant increase in cell migration/proliferation (, red, interrupted line), very much alike the NF-κB activation dynamics experiment described above.
Figure 2. In vitro wound healing assay suggests complex interactions between MAPK1 and TLR4 pathways, where TLR4 plays a protective role in MAPK1 absence. (a) Representative bright-field images of Sertoli cell line 15 P-1 after forming confluent monolayer was scratched across and the migration front was assessed at 0, 6 and 24 h. (b) The rate of cell migration RM [µm/h] is expressed as RM = (Wi-Wf)/t, where Wi is the initial wound width [µm], Wf is the final wound width [µm] and t is the duration of migration [hours]. RM was plotted vs. time for intact (control) (black line), siMAPK1 transfected (48 h) (red line), TLR4 challenged with LPS (24 h)(blue, interrupted line) and siMAPK1 transfected and then LPS challenged 15 P-1 cells (red, interrupted line). Error bars indicate SEM. Data are representative of independent experiments with three technical replicates using the adult Sertoli cell line 15 P-1.
![Figure 2. In vitro wound healing assay suggests complex interactions between MAPK1 and TLR4 pathways, where TLR4 plays a protective role in MAPK1 absence. (a) Representative bright-field images of Sertoli cell line 15 P-1 after forming confluent monolayer was scratched across and the migration front was assessed at 0, 6 and 24 h. (b) The rate of cell migration RM [µm/h] is expressed as RM = (Wi-Wf)/t, where Wi is the initial wound width [µm], Wf is the final wound width [µm] and t is the duration of migration [hours]. RM was plotted vs. time for intact (control) (black line), siMAPK1 transfected (48 h) (red line), TLR4 challenged with LPS (24 h)(blue, interrupted line) and siMAPK1 transfected and then LPS challenged 15 P-1 cells (red, interrupted line). Error bars indicate SEM. Data are representative of independent experiments with three technical replicates using the adult Sertoli cell line 15 P-1.](/cms/asset/3f9dbf16-1d6e-4873-83d6-865419391c18/tbeq_a_2268749_f0002_c.jpg)
Upon TLR4 stimulation, preferential induction of macroautophagy over mitophagy was observed, a phenomenon particularly pronounced under conditions of nutrient deprivation
Since NF-κB has an impact on regulating autophagy in order to tamper excessive inflammasome activation, we monitored the effect of TLR4 challenge for 24 h using LPS towards macroautophagy and mitophagy (), using Dojindo-developed fluorescent dye DAPGreen, which detects autophagosome formation (like LC3), and MtPhagy, which detects mitochondrial destruction within autolysosomes [Citation24]. DAPGreen fluorescence was increased after TLR4 challenge with LPS for 24 h, compared to non-treated cells in high glucose conditions. Starvation alone (low glucose) increases the signal from DAPGreen, and LPS treatment in starvation conditions even doubles this signal, suggesting an TLR4-induced macroautophagy. Using vacuolar H+-ATPase (V-ATPase) inhibitor Bafilomycin A1 to block the fusion between autophagosomes and lysosomes, preventing the latter from getting acidified, we found that LPS-induced TLR4 activation resulted most likely in a destabilised autophagosome formation in high glucose conditions, manifested by decreased DAPGreen signal. We draw this conclusion based on the expected increase in autophagosome staining usually observed after lysosome fusion blocking by Bafilomycin A1, which is exactly what we observed when comparing the DAPGreen signal in non-treated and Bafilomycin A1 treated cells. In low glucose conditions, where the autophagy flux was increased by the LPS treatment and autophagosome formation was doubled, we found no difference when the fusion to lysosomes was prevented by Bafilomycin A1, hence the DAPGreen signal exhibited no change ().
Figure 3. TLR4 challenge Favoured macroautophagy for mitophagy and this was more pronounced in starvation conditions. Sertoli cell line 15 P-1 was subjected to 24 h LPS challenge compared to non-treated controls in high glucose and low glucose conditions, with or without prior treatment with Bafilomycin A1 for 2 h. (a) The DOJINDO fluorescent dye DAPGreen was used to monitor the autophagosome initiation and formation, as well as its fusion with lysosomes, as its fluorescence depended on its incorporation into double hydrophobic autophagosome membrane. DOJINDO MtPhagy fluorescent dye was used to monitor specific mitophagy, as its fluorescence depended on environment pH during autolysosome formation and dye transformation within mitochondrial membranes. Representative figures of DAPGreen and MtPhagy treated control and LPS challenged cells in high/low glucose conditions with or without Bafilomycin A1 pretreatment are shown. Each panel consists of brightfield image (grey), DAPI nuclear staining (blue), DAPGreen autophagosome staining (green), MtPhagy mitophagy staining (red). arrowheads show regions with autophagosome formation or mitophagy, accordingly. (b) Each condition was analysed by estimating semiquantitative score (0, no staining; 1-3 levels of staining) for at least three fields of view. Error bars indicate SEM. Data are representative of independent experiments with three technical replicates using the adult Sertoli cell line 15 P-1. Asterisks above bars denote statistically significant differences as determined by non-parametric Kruskal-Wallis H test (*, **, *** p < 0.05). Each pairwise comparison is denoted by same the number of asterisks.
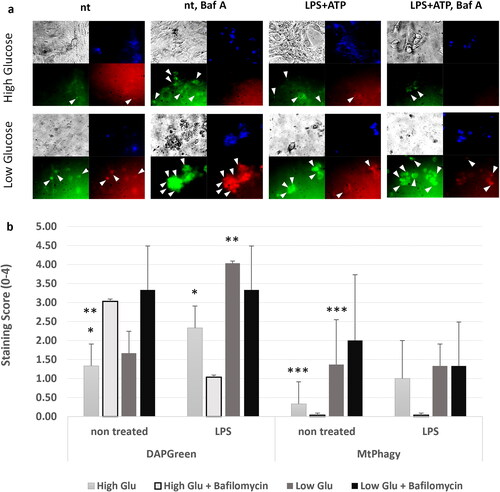
The process of specific ligand-induced autophagy of mitochondria is known as mitophagy. We used the fluorescence cell dye MtPhagy to monitor this process. We found that in high glucose conditions the challenge of TLR4 using LPS for 24 h had no effect on mitophagy, nor there were changes in MtPhagy signal when Bafilomycin A1 was used to block lysosome fusion, regardless of LPS treatment. This suggested that mitophagy occurred as a background process, and it was not affected by LPS or Bafilomycin A1 as the macroautophagy flux. In low glucose conditions, there was an increase in the background mitophagy compared to high glucose levels, but the difference between the non-treated and LPS treated cells was non-significant. Using Bafilomycin A1 to emphasise autophagosome formation, we observed a much stronger signal that was more pronounced in non-treated vs. LPS treated starved cells, suggesting that LPS induced TLR4 signalling actually decreased the specific mitophagy in favour of non-specific macroautophagy (). We hypothesise that the increased mitophagy levels in low glucose conditions were the result of starvation-induced autophagy and increased general cellular organelles turnover.
The simultaneous activation of TLR4 and NOD1 in the presence of ATP, or the sole presence of ATP, instigates potassium efflux through voltage-gated potassium channels, notably Kv1.3, in adult Sertoli cells
We used FluxORTM potassium flux assay to monitor the activation of voltage gated channels such as Kv.1.3 in adult Sertoli cells, using K+-containing activation buffer. We found that TLR4 activation for 24 h using LPS followed by 1 h ATP treatment as well as co-activation of TLR4 and NOD1 using their respective cognate ligands LPS and iE-DAP to challenge, then for 24 h, followed by ATP treatment for 1 h, both resulted in activation of the voltage gated potassium flux (). Even stronger activation was observed when ATP treatment was applied alone, while TLR4 challenge with LPS alone, without further addition of ATP resulted in a decrease of the flux ().
Figure 4. FluxORTM assessment of TLR4 and NOD1 challenge alone or in combination with ATP supplementation on voltage gated potassium channels (such as Kv1.3) in adult Sertoli 15 P-1 cells. (a) Relative potassium ion (K+) flux assessed as F0/F ratio at 120 s in the following conditions: non-treated; ATP treated (1 h); TLR4 challenged for 24 h (LPS); TLR4 challenged for 24 h (LPS) and ATP treated for 1 h; co-challenged TLR4 and NOD1 for 24 h (LPS, iE-DAP) and ATP treated for 1 h. Error bars indicate SEM. Data are representative of independent experiments with three technical replicates using the adult Sertoli cell line 15 P-1. Inlet: FluxORTM experimental setting. K2SO4 is added to stimulus buffer to promote opening of voltage-gated K + channels. Baseline F0 values and F values were recorded for 120 s, and the F/F0 ratio was calculated, thus averaging, and normalising the flux towards treatment. (b) Schematic representation of the interaction between MAPK1/ERK2, TLR4.NF-κB, Kv1.3 channels, autophagy and NLRP3-CASP1-IL1β.
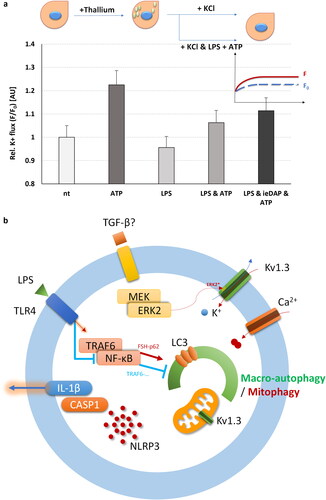
Potassium voltage gated channels, Kv1.3. especially, are very important in regulating the pro-inflammatory and cell death pathways, such as the NLRP3 pathway. Their activity or inactivity could either activate or suppress inflammasome activation, respectively [Citation27,Citation28]. Since there were few reports recently on putative phosphorylation sites on Kv1.3. by MAPK1/ERK2, participating in their potential activation, we sought to investigate if the MAPK1/ERK2 could also influence the NLRP3 inflammasome activation pathway. An oversimplified view of the interactions between TLR4-TRAF6-NF-κB, (FSH)-MEK/MAPK1(ERK2), ion fluxes, NLRP3 inflammasome activation – Caspase-1-IL-1β and autophagy is shown in , with the putative involvement of voltage gated potassium Kv1.3 channels.
Discussion
Sertoli cells play a pivotal role in the process of spermatogenesis, with their early growth and maturation being influenced by the combined actions of FSH and pro-inflammatory cytokines like IL-1α, which operate through distinct MAPK family members, including ERK2 and p38 MAPK/JNK. They in turn interact with autophagy dependent multifaceted NF-κB. The development of Sertoli cells is further regulated by various ion channel fluxes that modulate their cell membrane potential.
In this study, we delved into the less explored aspects of mature adult Sertoli cell behaviour, specifically focusing on the impact of DAMP/PAMP signalling pathways associated with NOD1/NOD2 and TLR4 signalling. Here we propose a hypothesis about the MAPK1/ERK2 – TLR4 – NF-κB interactions, on the basis of the data we have obtained so far, as well as on the literature published on Sertoli and other cells. Sertoli cells are responsible for spermatogonial niche support releasing Transforming growth factor beta (TGF-β) and FSH-dependent-GDNF [Citation29]. FSH and TGF-β downstream regulate several pathways related to cell proliferation including non-canonical p38 MAPK, ERK, JNK [Citation30]. FSH is a paracrine activator of the MAPK1/ERK2 pathway, while TGF-β is controlled by NF-κB. Upon release of pro-inflammatory or danger signal stress factors, like TLR4 ligands and ATP, at least three signal pathways are engaged: TLR4 activates both MyD88/TRAF6/NF-κB as well as the p38 MAPK pathway, while ATP in combination with TLR4 downstream pathway could also upregulate NLRP3 inflammasome expression, and subsequent caspase-1 activation and IL-1β cleavage and release. While in intact conditions, NF-κB promotes proliferation and anti-apoptotic phenotype [Citation31], as well as promotes mitophagy (via FSH-p62) to keep inflammasome activation at bay [Citation32], under increased cytokine stress (TNF-α induced), NF-κB has a negative effect on GDNF signalling [Citation19] and mitophagy [Citation33].
Sertoli cell proliferation is dependent mostly on two distinct signalling pathways. FSH is a major Sertoli cell regulator and its mitogenic effect is mediated via ERK [Citation7], while some cytokines, such as interleukin 1 family ones that are constitutively secreted by Sertoli cells, mostly their IL-1α form, exert their mitogenic effect via activation of p38 MAPK and JNK/SAPK pathways [Citation8].
As we found here, MAPK1/ERK2 in intact conditions restricts NF-κB activation, while TLR4 induction for prolonged time of 24 h results in suppressive effects on NF-κB activation, cell proliferation and migration, as well as on mitophagy. TLR4 prolonged activation also results in an increased caspase-1 activation and IL-1β secretion, which combined with suppressed mitophagy and increased potassium cellular flux (via Kv1.3) could result in reduced cell survival. Since the MAPK1/ERK2 pathway is stimulated by growth factors such as TGF-β and FSH, their absence could reasonably signal for a potential Sertoli cell demise via increased cell death and decreased anti-apoptotic signalling promoted also by the long TLR4-NF-κB stimulation. NF-κB was shown to increase after a short stimulus for TLR4 in the first 4-6 h, followed by a decrease after the 24th hour, while its MyD88 downstream targets are still active for another 24-48 h [Citation34]. This could explain our observations for TLR4 mono stimulation. Interestingly, when TLR4 was activated for 24 h in Sertoli cells with silenced MAPK1/ERK2 pathway we found a significant cell proliferation/migration and NF-κB activation. We hypothesise that the lack of MAPK1 pathway results in a switch towards more abundant expression of the p38 MAPK pathway, since the p38 MAPK pathway was found essential for conducting the LPS-induced NF-κB activation, TNF-a and IL-1β release, cell adhesion [Citation35–37]. The inhibition of p38 MAPK abrogates TLR4-induced NF-κB signalling [Citation38], since p38 regulates the accessibility of NF-κB transcription factor to its chromatin targets [Citation39], and TLR4-induced NF-κB and p38 MAPK signalling also regulate IL-6 mRNA stabilisation [Citation38]. Another key signal transducer and interactor crucial for both TLR4 signalling and p38 signalling is the Toll-interleukin-1 Receptor (TIR) domain-containing adaptor protein (TIRAP), which connects the TLR4 receptor transmembrane form to MyD88 [Citation40]. TIRAP also interacts with TRAF6 to conduct the signal for NF-κB to transactivate and migrate to the nucleus. TIRAP also interacts with p38 MAPK providing a scaffold for PKCδ, so it can activate p38 [Citation40], conducting the signal to the downstream transcription factor AP-1, essential for induction of the proinflammatory cytokines IL-12, IL-23, TNF-α, IL-6, and IL-1β [Citation41]. AP-1 activity is controlled by both ERK2 (via Elk-1, Ets-1) and p38 MAPK (via direct phosphorylation at Thr69 and Thr71) [Citation42]. It is highly likely that two pathways, ERK and p38 MAPK, interact to tailor the NF-κB downstream signalling.
FSH facilitates the activation of extracellular signal-regulated protein kinases 1 and 2 (ERK1/2) in a cAMP/PKA-dependent manner, thereby initiating the MAPK cascade in vitro, exerting its mitogenic effect [Citation7]. Conversely, the mitogenic effect in immature Sertoli cells exerted by IL-1α is not triggered by ERK, but by the p38 MAPK and JNK pathways [Citation21], and IL-1α-induced Sertoli cell proliferation was attenuated by the p38 MAPK inhibitor SB203580 [Citation8]. This p38 MAPK dependent effect is synergistic to the ERK-dependent FSH effect, and it is likely operational in adult Sertoli cells as well. However, the mitogenic effect of FSH in rat Sertoli cells is pertinent only during foetal and early postnatal life [Citation43]. This observation brings into focus the impact of the IL-1 pathway via TLR4/NF-κB on Sertoli cell proliferation. Given that we do not add FHS to the cell culture medium, EKR2 (MAPK1) silencing somewhat mirrors the observed effect of FSH post day 19, when FSH exerts an opposite effect, and the ERK pathway is significantly inhibited by FSH treatment [Citation7]. Another aspect to consider is the differential timing of NF-κB and AP1 activation and the upregulation of Tlr4, Il1A, Il1B and other genes associated with LPS-induced pathways, in comparison to the p38 MAPK and ERK pathway signalling downstream of Tlr4. For instance, Il1B gene is upregulated after 24 h in chicken [Citation44] and mouse Sertoli cells [Citation15], while Tlr4 gene is upregulated after 48 h [Citation44]. Moreover, activated NF-κB and ERK2 were not observed in neonatal pigs within the first 6 h post LPS treatment [Citation45], suggesting that ERK2 activation as a downstream process should occur after the 6th hour.
Since TLR4 and NF-κB are involved in inflammasome signalling and a crucial mechanism for its downregulation is attributed to autophagy, we further investigated both how the TLR4 activation affects macroautophagy and mitophagy, as well as how voltage gated channels affected the process. Although Nuclear factor κB (NF-κB), a key activator of inflammation, primes the NLRP3-inflammasome for activation by inducing pro-IL-1β and NLRP3 expression, NF-κB at the same time is able to the prevent excessive inflammation by restraining NLRP3-inflammasome activation through an increased autophagic clearance of damaged mitochondria (mitophagy). Since NLRP3 agonists damage mitochondria and release inflammasome activating signals, in macrophages NF-κB mediates LPS-induced p62/SQSTM1 expression allowing the ubiquitinated damaged mitochondria to be eliminated by p62-dependent mitophagy [Citation32]. In our study, TLR4 challenge with LPS for 24 h resulted in an expected increase in the macroautophagy, but not in an increase in mitophagy; rather the opposite, mitophagy was reduced. Other studies have demonstrated that p62 attenuates sterile inflammation and fulminant hepatitis, but both p62 and Parkin expression are required for this effect [Citation32]. Autophagy, proteasome trafficking and NF-κB transactivation are all regulated by p62, also referred to as the Sequestosome 1. It functions as a scaffold protein which consists of a PB1-, TRAF6 binding-, LC3 interacting- and ubiquitin-associated domains. p62 organised TRAF6-regulated NF-κB signalling and polyubiquinated protein sorting to sequestosomes and proteasomes by binding TRAF-6 and MEKK3. IL-1β regulated MEKK3-p62-TRAF6. MEKK3 regulates ERK1/2 and p38 MAPK independently of NF-κB [Citation46]. ERK2 and NF-κB suppressed apoptosis and cell differentiation, while ERK1/2 promote cell proliferation [Citation21], while p38 MAPK promoted cell apoptosis, but also cell migration [Citation47]. Thus NF-κB controls both pathways to induce and pathways to restrict inflammation and cell death, depending on the cell type and condition. Our data suggest that TLR4 challenge is still pro-inflammatory and inflammasome activating in prolonged 24 h challenge conditions.
Cell proliferation vs. inflammasome cell death are also controlled by another player, the Kv1.3 potassium channels. In this study, using K+ containing stimulus buffer, we selectively measured the K+ flux via voltage gated channels. We found TLR4 challenge in MAPK1 silenced conditions to promote cell migration and cell proliferation. This could be associated also with Kv.1.3 channels activity, according to a recent study, and its proposed ‘voltage sensing model’, Kv.1.3 could sense the changes in membrane voltage upon cell stimulation [Citation48]. Cell membrane depolarisation opens the channels, thus promoting phosphorylation of intracellular C-terminal tyrosine and serine residues by protein kinases of the MEK-ERK signalling pathway, including MAPK1/ERK2. This phosphorylation is also required for activation of the MEK-ERK signalling pathway, however, the mechanism of interactions between the phosphorylated channel and the signalling pathway remains to be elucidated [Citation49]. Kv1.5 channels in contrast to Kv1.3 could not promote cell proliferation [Citation48]. Kv.1.3 are MAPK1/ERK2 regulated both on cell membranes and in mitochondria, where they induce oxidative phosphorylation and reactive oxygen species (ROS) production that promotes proliferation. In case of additional TLR4 challenge in the presence of ATP (a danger associated molecular pattern signal, DAMP), it is possible for Kv1.3. and other voltage gated channels to participate in an excessive potassium flux to support inflammasome activation. While NF-κB uses mitophagy to control this process, in co-stimulated prolonged conditions, where MAPK1 is suppressed, the NF-κB possibly reverts orchestrated cell signalling towards inflammation and cell death. While ROS induced NF-κB activates autophagy with protective outcome, TLR4 induced NF-κB initially activates autophagy via Beclin1, but later suppresses it via A20 induction [Citation50]. Additionally, FSH was found to protect goat Sertoli cells from oxidative stress via p62-Nrf2 inhibiting macro-autophagy [Citation51], which could explain our data showing increased macroautophagy and repressed microautophagy (mitophagy) in FSH devoid cell media. Since FSH is required for MAPK1/ERK2 expression, this would result in decreased MAPK1 in intact high glucose conditions and repressed mitophagy, as MAPK1/ERK2 and MAPK14/p38 are essential for its activation. This study explains why partial mitophagy activation occurs under starvation conditions, accompanied by metabolic stress-induced general autophagy, but not in TLR4 challenged ones, as the TLR4 pathway further differentially modulates MAPK pathways.
Conclusions
The intricate interplay between the NF-κB and MAPK1/ERK2 pathways, particularly in the presence of FSH and IL-1α, fosters a micro-autophagic anti-inflammatory regulatory environment that promotes cellular survival and proliferation while concurrently suppressing pro-inflammatory signalling. However, under circumstances where DAMPs persistently interact with NOD1 receptor activation or TLR4 activation, a shift in cellular response is observed. In such scenarios, NOD1 instigates macroautophagy via Autophagy related 16 Like (ATG16L), and NF-κB reconfigures the downstream response pathways. This reprogramming steers the cellular machinery towards inflammasome activation and equips the cell for caspase-1 dependent cell death, thereby highlighting the dynamic and context-dependent nature of these signalling pathways.
Author’s contribution
EA and IT equally contributed to this work, conducting all the experimental work. KT and SH provided the funding, conceived the research and wrote the manuscript, together with the help of EA and IT. All authors contributed to data analysis, have read and agreed to the published version of the manuscript.
Disclosure statement
The authors declare that they have no conflict of interest.
Additional information
Funding
References
- Setchell BP. Hormones: what the testis really sees. Reprod Fertil Dev. 2004;16(5):1–14. doi: 10.10371/RD03048.
- McCabe MJ, Allan CM, Foo CFH, et al. Androgen initiates sertoli cell tight junction formation in the hypogonadal (hpg) Mouse1. Biol Reprod. 2012;87(2):38. doi: 10.1095/biolreprod.111.094318.
- Sarkar O, Mathur PP, Cheng CY, et al. Interleukin 1 alpha (IL1A) is a novel regulator of the blood-testis barrier in the rat. Biol Reprod. 2008;78(3):445–454. doi: 10.1095/biolreprod.107.064501.
- Lie PPY, Cheng CY, Mruk DD. Interleukin-1alpha is a regulator of the blood-testis barrier. Faseb J. 2011;25(4):1244–1253. doi: 10.1096/fj.10-169995.
- Al-Sadi R, Ye D, Said HM, et al. IL-1β-induced increase in intestinal epithelial tight junction permeability is mediated by MEKK-1 activation of canonical NF-κB pathway. Am J Pathol. 2010;177(5):2310–2322. doi: 10.2353/ajpath.2010.100371.
- Al-Sadi R, Ye D, Dokladny K, et al. Mechanism of IL-1beta-induced increase in intestinal epithelial tight junction permeability. J Immunol. 2008;180(8):5653–5661. doi: 10.4049/jimmunol.180.8.5653.
- Crépieux P, Marion S, Martinat N, et al. The ERK-dependent signalling is stage-specifically modulated by FSH, during primary sertoli cell maturation. Oncogene. 2001;20(34):4696–4709. doi: 10.1038/sj.onc.1204632.
- Petersen C, Svechnikov K, Froysa B, et al. The p38 MAPK pathway mediates interleukin-1-induced sertoli cell proliferation. Cytokine. 2005;32(1):51–59. doi: 10.1016/j.cyto.2005.07.014.
- Wong CH, Yan Cheng C. Mitogen-activated protein kinases, adherens junction dynamics, and spermatogenesis: a review of recent data. Dev Biol. 2005;286(1):1–15. doi: 10.1016/j.ydbio.2005.08.001.
- Lu Y, Luo B, Li J, et al. Perfluorooctanoic acid disrupts the blood–testis barrier and activates the TNFα/p38 MAPK signaling pathway in vivo and in vitro. Arch Toxicol. 2016;90(4):971–983. doi: 10.1007/s00204-015-1492-y.
- Zanatta AP, Gonçalves R, Zanatta L, et al. New ionic targets of 3,3′,5′-triiodothyronine at the plasma membrane of rat sertoli cells. Biochim Biophys Acta Biomembr. 2019;1861(4):748–759. doi: 10.1016/j.bbamem.2019.01.002.
- Rato L, Socorro S, Cavaco JEB, et al. Tubular fluid secretion in the seminiferous epithelium: ion transporters and aquaporins in sertoli cells. J Membr Biol. 2010;236(2):215–224. doi: 10.1007/s00232-010-9294-x.
- Pérez-García MT, Cidad P, López-López JR. The secret life of ion channels: kv1.3 potassium channels and proliferation. Am J Physiol Cell Physiol. 2018;314(1):C27–C42. doi: 10.1152/ajpcell.00136.2017.
- Cidad P, Jiménez-Pérez L, García-Arribas D, et al. Kv1.3 channels can modulate cell proliferation during phenotypic switch by an ion-flux independent mechanism. Arterioscler Thromb Vasc Biol. 2012;32(5):1299–1307. doi: 10.1161/ATVBAHA.111.242727.
- Hayrabedyan S, Todorova K, Jabeen A, et al. Sertoli cells have a functional NALP3 inflammasome that can modulate autophagy and cytokine production. Sci Rep. 2016;6(1):18896. doi: 10.1038/srep18896.
- Walenta L, Schmid N, Schwarzer JU, et al. NLRP3 in somatic non-immune cells of rodent and primate testes. Reproduction. 2018;156(3):231–238. doi: 10.1530/REP-18-0111.
- Hayrabedyan S, Todorova K. Nalp signalling is required in sertoli cells for tight-junction protein interaction. Acta Medica Bulgarica. 2015;42(1):12–17. doi: 10.1515/amb-2015-0002.
- Hayrabedyan SB, Zasheva DY, Todorova KO. NLRs challenge impacts tight junction claudins in sertoli cells. Folia Med (Plovdiv). 2015;57(1):43–48. doi: 10.1515/folmed-2015-0018.
- Di Persio S, Starace D, Capponi C, et al. TNF-α inhibits GDNF levels in sertoli cells, through a NF-κB-dependent, HES1-dependent mechanism. Andrology. 2021;9(3):956–964. doi: 10.1111/andr.12959.
- Travassos LH, Carneiro LAM, Ramjeet M, et al. Nod1 and Nod2 direct autophagy by recruiting ATG16L1 to the plasma membrane at the site of bacterial entry. Nat Immunol. 2010;11(1):55–62. doi: 10.1038/ni.1823.
- Meroni SB, Galardo MN, Rindone G, et al. Molecular mechanisms and signaling pathways involved in sertoli cell proliferation. Front Endocrinol (Lausanne). 2019;10:224. doi: 10.3389/fendo.2019.00224.
- Rassoulzadegan M, Paquis-Flucklinger V, Bertino B, et al. Transmeiotic differentiation of male germ cells in culture. Cell. 1993;75(5):997–1006. doi: 10.1016/0092-8674(93)90543-y.
- Grada A, Otero-Vinas M, Prieto-Castrillo F, et al. Research techniques made simple: analysis of collective cell migration using the wound healing assay. J Invest Dermatol. 2017;137(2):e11–e16. doi: 10.1016/j.jid.2016.11.020.
- Iwashita H, Torii S, Nagahora N, et al. Live cell imaging of mitochondrial autophagy with a novel fluorescent small molecule. ACS Chem Biol. 2017;12(10):2546–2551. doi: 10.1021/acschembio.7b00647.
- Chih Chen Y, Rivera J, Fitzgerald M, et al. PreImplantation factor prevents atherosclerosis via its immunomodulatory effects without affecting serum lipids. Thromb Haemost. 2016;115(5):1010–1024. doi: 10.1160/TH15-08-0640.
- Beacham DW, Blackmer T, Grady O’, et al. Cell-based potassium ion channel screening using the FluxORTM assay. J Biomol Screen. 2010;15(4):441–446. doi: 10.1177/1087057109359807.
- Pike AF, Szabò I, Veerhuis R, et al. The potential convergence of NLRP3 inflammasome, potassium, and dopamine mechanisms in Parkinson’s disease. NPJ Parkinsons Dis. 2022;8(1):32. doi: 10.1038/s41531-022-00293-z.
- Yuan X, Han S, Manyande A, et al. Spinal voltage-gated potassium channel Kv1.3 contributes to neuropathic pain via the promotion of microglial < scp > M1</scp > polarization and activation of the < scp > NLRP3</scp > inflammasome. Eur J Pain. 2023;27(2):289–302. doi: 10.1002/ejp.2059.
- Tadokoro Y, Yomogida K, Ohta H, et al. Homeostatic regulation of germinal stem cell proliferation by the GDNF/FSH pathway. Mech Dev. 2002;113(1):29–39. doi: 10.1016/s0925-4773(02)00004-7.
- Tzavlaki K, Moustakas A. TGF-β signaling. Biomolecules. 2020;10(3):487. doi: 10.3390/biom10030487.
- Karin M. Nuclear factor-κB in cancer development and progression. Nature. 2006;441(7092):431–436. doi: 10.1038/nature04870.
- Zhong Z, Umemura A, Sanchez-Lopez E, et al. NF-κB restricts inflammasome activation via elimination of damaged mitochondria. Cell. 2016;164(5):896–910. doi: 10.1016/j.cell.2015.12.057.
- Laforge M, Rodrigues V, Silvestre R, et al. NF-κB pathway controls mitochondrial dynamics. Cell Death Differ. 2016;23(1):89–98. doi: 10.1038/cdd.2015.42.
- Hobbs S, Reynoso M, Geddis AV, et al. LPS-stimulated NF-κB p65 dynamic response marks the initiation of TNF expression and transition to IL-10 expression in RAW 264.7 macrophages. Physiol Rep. 2018;6(21):e13914. doi: 10.14814/phy2.13914.
- Lee JC, Laydon JT, McDonnell PC, et al. A protein kinase involved in the regulation of inflammatory cytokine biosynthesis. Nature. 1994;372(6508):739–746. doi: 10.1038/372739a0.
- Nick JA, Avdi NJ, Young SK, et al. An intracellular signaling pathway linking lipopolysaccharide stimulation to cellular responses of the human neutrophil. Chest. 1999;116(1 Suppl):54S–55S. doi: 10.1378/chest.116.suppl_1.54S.
- Fessler MB, Malcolm KC, Duncan MW, et al. A genomic and proteomic analysis of activation of the human neutrophil by lipopolysaccharide and its mediation by p38 mitogen-activated protein kinase. J Biol Chem. 2002;277(35):31291–31302. doi: 10.1074/jbc.M200755200.
- Nyati KK, Masuda K, Zaman MMU, et al. TLR4-induced NF-κB and MAPK signaling regulate the IL-6 mRNA stabilizing protein Arid5a. Nucleic Acids Res. 2017;45(5):2687–2703. doi: 10.1093/nar/gkx064.
- Saccani S, Pantano S, Natoli G. p38-dependent marking of inflammatory genes for increased NF-κB recruitment. Nat Immunol. 2002;3(1):69–75. doi: 10.1038/ni748.
- Rajpoot S, Wary KK, Ibbott R, et al. TIRAP in the mechanism of inflammation. Front Immunol. 2021;12:697588. doi: 10.3389/fimmu.2021.697588.
- Yang Y, Kim SC, Yu T, et al. Functional roles of p38 mitogen-activated protein kinase in macrophage-mediated inflammatory responses. Mediators Inflamm. 2014;2014:352371. doi: 10.1155/2014/352371.
- Atsaves V, Leventaki V, Rassidakis GZ, et al. AP-1 transcription factors as regulators of immune responses in cancer. Cancers (Basel). 2019;11(7):1037. doi: 10.3390/cancers11071037.
- Orth JM. The role of follicle-stimulating hormone in controlling sertoli cell proliferation in testes of fetal rats. Endocrinology. 1984;115(4):1248–1255. doi: 10.1210/endo-115-4-1248.
- Michailidis G, Anastasiadou M, Guibert E, et al. Activation of innate immune system in response to lipopolysaccharide in chicken sertoli cells. Reproduction. 2014;148(3):259–270. doi: 10.1530/REP-14-0064.
- Arato I, Milardi D, Giovagnoli S, et al. In “vitro” lps-stimulated sertoli cells pre-loaded with microparticles: intracellular activation pathways. Front Endocrinol (Lausanne). 2020;11:611932. doi: 10.3389/fendo.2020.611932.
- Nakamura K, Kimple AJ, Siderovski DP, et al. PB1 domain interaction of p62/sequestosome 1 and MEKK3 regulates NF-κB activation. J Biol Chem. 2010;285(3):2077–2089. doi: 10.1074/jbc.M109.065102.
- Craig EA, Stevens MV, Vaillancourt RR, et al. MAP3Ks as Central regulators of cell fate during development. Dev Dyn. 2008;237(11):3102–3114. doi: 10.1002/dvdy.21750.
- Styles FL, Al-Owais MM, Scragg JL, et al. Kv1.3 voltage-gated potassium channels link cellular respiration to proliferation through a non-conducting mechanism. Cell Death Dis. 2021;12(4):372. doi: 10.1038/s41419-021-03627-6.
- Teisseyre A, Palko-Labuz A, Sroda-Pomianek K, et al. Voltage-gated potassium channel Kv1.3 as a target in therapy of cancer. Front Oncol. 2019;9:933. doi: 10.3389/fonc.2019.00933.
- Trocoli A, Djavaheri-Mergny M. The complex interplay between autophagy and NF-κB signaling pathways in cancer cells. Am J Cancer Res. 2011;1(5):629–649.
- Xi H, Hu Z, Han S, et al. FSH-inhibited autophagy protects against oxidative stress in goat sertoli cells through p62-Nrf2 pathway. Theriogenology. 2023;195:103–114. doi: 10.1016/j.theriogenology.2022.10.022.