
 ?Mathematical formulae have been encoded as MathML and are displayed in this HTML version using MathJax in order to improve their display. Uncheck the box to turn MathJax off. This feature requires Javascript. Click on a formula to zoom.
ABSTRACT
Building optimization using traditional approaches based on explicit objective functions is difficult because of large numbers of variables and constraints. Many studies, thus, developed derivative-free optimizations using evolutionary programming, particle swarm methods, swarm intelligence, etc. Applications of artificial neural networks (ANNs) in frame designs are not common, although ANN is an evolutionary technology in many areas. This study presents novel holistic designs and optimizations of prestressed multi-story frames in general and piperack frames in particular, using the ANN-based Hong-Lagrange Algorithm. The proposed method provides optimized designs in terms of multiple objective functions such as costs, CO2 emissions, weights, and energy consumptions. A software is developed based on MATLAB codes for generating big datasets following American standards. A big data of 120,000 samples is used to train ANNs, formulating objective and constraint functions of 38 input and 69 output parameters. Designs minimizing multiple objective functions are performed by applying sequential quadratic programming to ANN-based functions constrained by equalities and inequalities imposed by architectural and code requirements. Examples show reductions up to 31.81%, 38.63%, 5.06%, and 37.36% in costs, CO2 emissions, weights, and energy consumption, respectively, compared with the minima of those identified from 340,000 samples.
1. Introduction
1.1. Literature review
Applying a derivation-based method in structural optimization is difficult due to the involvement of numerous design parameters and constraints. Structural optimizations, hence, were commonly developed based on metaheuristic methods, where explicit objective functions are not required. According to the review of Vasileios Machairas (Machairas, Tsangrassoulis, and Axarli Citation2014), derivation-free algorithms, such as evolutionary programming, pattern search method, and direct search algorithms, were widely implemented in optimizing building designs by numerous studies, for example (Wright and Farmani Citation2001) Wright and Farmani (Coley and Schukat Citation2002), Coley and Schukat (Yi and Malkawi Citation2009), YK Yi and AM Malkawi, and (Peippo, Lund, and Vartiainen Citation1999) K Peippo et al. In 2007, the optimization of buildings life-cycle costs using an -constraint method was provided by X. K. Zou et al. (Zou et al. Citation2007), minimizing expenses from material costs and expected damages due to seismic actions. CO2 emissions and costs in frames were optimized using a simulated annealing algorithm by Ignacio Paya-Zaforteza et al. (Paya-Zaforteza et al. Citation2009). Similar objective functions were minimized in the study of Camp and Huq (Citation2013) using the algorithm of big bang-big crunch. Both studies (Paya-Zaforteza et al. Citation2009) (Camp and Huq Citation2013) reported a close relationship between CO2 emissions and costs. Developments in cost optimizations of 3D reinforced concrete (RC) frames were found in studies by P. Sharafi et al. in 2012 (Sharafi, Hadi, and Teh Citation2012) and Sahab et al. in 2005 (Sahab, Ashour, and Toropov Citation2005), where results based on colony optimization algorithm showed a further cost reduction of 4.8% compared with those provided by an exhaustive search algorithm, a genetic algorithm, and a Hook and Jeeves method. In 2012, a new metaheuristic method called the charge system search was implemented in structural optimization by A. Kaveh and A.F. Behnam (Kaveh and Behnam Citation2013), minimizing the weight of a 7-story frame with three spans. In 2020, Herian Leyva et. al (Leyva et al. Citation2021). implemented the non-dominated sorting genetic algorithm (NSGA II) in optimizing seismic designs of RC buildings with buckling restrained braces, results indicated that higher and more economical buildings compared with ones designed conventionally can be achieved using the proposed method. In the study (Mergos Citation2021) by Panagiotis E. Mergos in 2021, a metaheuristic method named the flower pollination algorithm was adopted for optimizing 3D RC buildings, successfully minimizing the costs of a 12-story building design according to Eurocodes. Recently in 2022, the plasma generation optimization was applied to 3D RC frames by Ali Kaveh and Shaylin Rezazadeh Ardebili (Kaveh and Ardebili Citation2022), resulting in good performances in finding optimized building designs. H. Nikzad and S. Yoshitomi proposed a structural optimization methodology developed based on the MATLAB platform (Nikzad and Yoshitomi Citation2018) (Nikzad and Yoshitomi Citation2017). In 2020, P.S.M. Thilakarathna et al. presented an analysis of embodied carbon in high and ultra-high strength concrete using machine learning algorithms (Thilakarathna et al. Citation2020), proposing a method to identify concrete mix ingredients for minimizing the embodied carbon. More descriptions of AI-based applications in building and construction can be found (Baduge et al. Citation2022). On the other hand, Artificial Neural Networks (ANNs), the pioneering technology of computer sciences, were not common in the field of structural engineering despite its evolutionary successes in other areas, for instance medical, financial, astronomy, and automotive. Several recent studies (such as Hong et al. Citation2022, Hong et al. Citation2022, Hong et al. Citation2023) successfully implemented ANNs in the structural field at a level of member designs, showing the potential of AI technologies. The study of Hong et al. (Citation2022) presented ANN-based optimizations of steel RC columns under biaxial loads, resulting in costs and CO2 emissions of 30.7% and 40.4%, respectively, compared with conventionally designed ones. The work done by Hong et. al. in 2022 (Hong et al. Citation2022) demonstrated holistic designs of pre-tensioned concrete beams using ANNs, showing that AI algorithms can effectively replace humans in structural designs. In 2023, the study of Hong and Pham (Hong et al. Citation2023) introduced an AI-based algorithm for optimizing RC frames, considerably reducing costs and weights of structures. However, applications of ANNs in prestressed (PT) piperack frames were not available in previous studies even though pipe hangers and supports are a lucrative industry with a market size of 1.537 billion USD in 2022 according to (Business Research Insights Citation2021).
1.2. Research significance
shows three commonly used methods in structural optimizations and the proposed ANN-based Hong-Lagrange algorithm (ANN-based HLA). Method #1 uses the traditional Lagrange optimization to solve for the minimum of explicit objective functions, providing the best accuracies. However, this method is nearly impossible for frame designs because formulating an explicit objective function considering a large number of variables and constraints is difficult. Many studies described in Section 1.1 implement metaheuristic methods, which do not require explicit objective functions. However, results obtained from these metaheuristic methods can be unstable because randomness in procedures (Katoch, Chauhan, and Kumar Citation2021). For example, the well-known genetic algorithm searches for optimal solutions using a population-based strategy where the designs are improved by fitness selections, mutations, and crossovers throughout many generations. However, initialization of the first generation, selecting parental designs for crossovers, and choosing mutated parameters are conducted based on stochastic algorithms. Therefore, there are debates about the robustness of genetic algorithms. Furthermore, considerable computational costs are required when optimizing large-scale structures because many metaheuristic methods used population-based techniques, which examine many building designs during optimization processes. Method #3 in is developed to reduce computational demands of Method #2 by replacing heavy structural investigations with faster AI-based regressions. However, Method #3 is still unstable due to the usage of metaheuristic methods. The present study introduces Method #4 (ANN-based HLA) in , where objective and constraint functions are formulated by ANNs. Optimized designs of frames are performed by the sequential quadratic programming (SQP) algorithm in finding stationary points of ANN-based functions. In doing so, ANN-based HLA possesses not only all advantages of Method #3 but also eliminates instabilities in optimizations. Overall, the present study focuses on creating an AI-based program that not only replaces engineers in daily structure designs but also enhances design efficiencies. Such a program is currently not available for practical structural designs, and design procedures are mainly conducted based on iteration methods. The target of this study is to achieve optimized designs that meet all design requirements imposed by design standards ACI 318–19 and ASCE 7–16. It is noted that designs are widely accepted once all code-based requirements are stratified. Additional experiments are not required because big datasets are generated using code-based equations which are established based on test data. For example, ACI 318–19 established strength reduction factors based on a study by MacGregor in 1976 (MacGregor Citation1976), which summarized variabilities in material strengths, overloading, and severities of failure consequences of test data in multiple studies. Furthermore, the sustainability of the building structures is also considered by minimizing the CO2 emissions of frames. It is noted that sustainability is becoming a key factor in various industries, leading to many valuable studies (such as Sher et al. Citation2021, Yaqoob et al. Citation2021, Yaqoob et al. Citation2022, Sher et al. Citation2021).
Table 1. Three available methods of optimizations and the new ANN-based HLA.
Villarrubia et. al. proposed a procedure of optimization by formulating ANN-based objective functions and optimizing these ANN-based functions by Lagrange multipliers. An example of a simple linear function (Villarrubia et al. Citation2018) by Villarrubia et. al. shows a potential of ANNs in optimization. The novel ANN-based HLA substantially extends applications of ANN-based functions introduced in Villarrubia et al. (Citation2018) to a real-world problem, where designs of practical buildings are optimized, determining a large number of variables while satisfying all constraints imposed by codes and architectures. Before this study, it is hard to find any research that associated ANN-based functions with holistic frame designs. A robust and facile procedure is established by implementing one of the latest artificial intelligences (AI) technologies in structural engineering, substantially enhancing design effectiveness while minimizing human efforts. The present study is based on autonomous building designs initiated by the books (Hong Citation2022, Hong Citation2023c, Hong Citation2023a, Hong Citation2023b, Hong Citation2019). The proposed method demonstrated capabilities for structural designs. In particular, complex structures such as tuned mass dampers were developed by Wang, L. et al. in their studies (Wang, Shi, and Zhou Citation2019, Wang et al. Citation2020, Wang et al. Citation2020, Wang et al. Citation2019).
2. The ANN-based Hong-Lagrange algorithm (ANN-based HLA)
2.1. General procedure for individual objective optimization using the ANN-based HLA
The present paper is the first attempt to implement the ANN-based HLA in optimizing PT piperack. The ANN-based HLA is a standard algorithm for structural optimizations introduced in the Books (Villarrubia et al. Citation2018, Hong Citation2022, Hong Citation2023c, Hong Citation2023a) where the algorithm was successfully used in optimizing RC, PT, and SRC beams and columns.
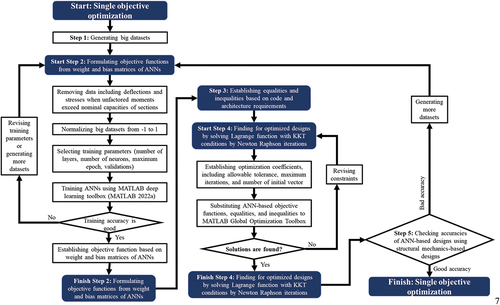
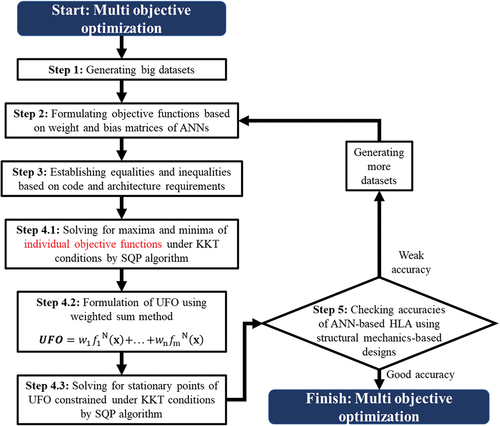
shows five steps of designing a PT piperack using the ANN-based HLA, summarizing a procedure from generating datasets to the final designs. In the first step, big datasets are generated by the ABBA (Auto design-Based Building Application) frame generators developed using MATLAB (MATLAB 2022a) (MathWorks Citation2022a), MATLAB parallel computing toolbox (MATLAB 2022a) (MathWorks Citation2022e), and MATLAB Statistics and Machine Learning toolbox (MATLAB 2022a) (MathWorks Citation2022f). The large datasets consist of input design parameters and corresponding structural responses of PT piperack frames, which are used to train the ANNs. The second step is training ANNs using MATLAB deep learning toolbox (MATLAB 2022a) (MathWorks Citation2022b), mapping forward input parameters to forward output parameters of a PT piperack frame, after which ANN-based objective functions are established from weight and bias matrices obtained by training ANNs. The ANNs are trained based on a backpropagation algorithm that minimizes the mean squared error between the predicted and actual output parameters. The ANN-based objective functions are formulated as combinations of the weight and bias matrices, which represent the nonlinear relationships between the input and output parameters. Architectural and code-based requirements (ACI 318–19 (Building Code Requirements for Structural Concrete ACI 318–19 Commentary on, & Building Code Requirements for Structural Concrete ACI 318R–19 Citation2019) and ASCE 7–16 (Loads and Structures Citation2017)) are converted into inequalities in Step 3. The inequalities ensure that the optimized designs satisfy the minimum safety and serviceability criteria specified by the codes. The inequalities also impose ranges on the input parameters to avoid unrealistic or infeasible designs. In the fourth step, ANN-based objective functions and inequalities are implemented in the MATLAB optimization toolbox (MATLAB 2022a) (MathWorks Citation2022d) and MATLAB global optimization toolbox (MATLAB 2022a) (MathWorks Citation2022c), finding optimized design parameters by solving for stationary points of Lagrange functions constrained by KKT conditions (Kuhn and Tucker Citation1951). The optimization problem is solved using a gradient-based algorithm that iteratively updates the input parameters until the optimality conditions are satisfied. The Lagrange functions are composed of the ANN-based objective functions and the equality and inequality constraints, which are multiplied by Lagrange multipliers. Finally, the accuracy of ANN-based optimized designs is verified by structural mechanics-based calculations. The algorithm returns to Step 2, generating more datasets when design errors are unacceptable. The structural mechanics-based calculations are performed based on a finite element analysis software to simulate the behavior of PT piperack frames under various loading conditions. The design errors are measured by comparing the structural responses obtained from the structural mechanics-based calculations and the those obtained from ANNs. If the design errors exceed a predefined tolerance, more datasets are generated with more the input parameters based on certain ranges, and trained to formulate the ANNs.
Figure 1. Flow chart for designing prestressed pipe rack using the ANN-based Hong-Lagrange algorithm.
2.2. Step 1 of the ANN-based HLA: generating big datasets
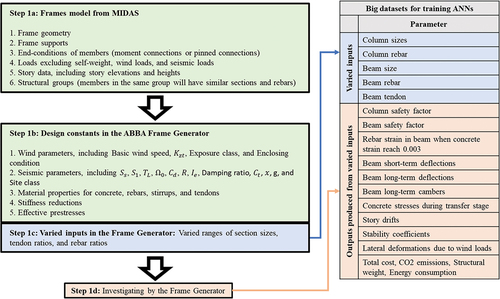
The ABBA frame generator is developed on MATLAB platform (MATLAB 2022a) (MathWorks Citation2022a), with MATLAB parallel computing toolbox (MATLAB 2022a) (MathWorks Citation2022e) and MATLAB Statistics and Machine Learning toolbox (MATLAB 2022a) (MathWorks Citation2022f), referring to open-source software LESM (Fernando Martha et al. Citation2022). illustrates four steps of generating big datasets, where 38 varied inputs are given in Step 1c, and 111 outputs are calculated in Step 1d. Design constants provided in Steps 1a and 1b are not saved in the big datasets. First of all, graphical interfaces of MIDAS developed to model geometry of a frame are utilized to establish parameters for generating big datasets as shown in Step 1a of . Design constants of frames such as wind and seismic parameters are substituted into the ABBA frame generator in Step 1b. In Step 1c, ranges of member sizes, rebar ratios, and tendon ratios are input parameters for the ABBA frame generator. Inputs of 38 parameters of each dataset are randomly selected within preassigned ranges. These ranges should be larger than ranges used in optimizations, avoiding optimization in the vicinity of the edge of datasets. Finally, ABBA frame generator conducts structural investigation according to ACI 318–19 (Katoch, Chauhan, and Kumar Citation2021) and ASCE 7–16 (MacGregor Citation1976).
Figure 2. Data generations using the ABBA frame generator.
2.3. Step 2 of the ANN-based HLA: formulating ANN-based objective functions
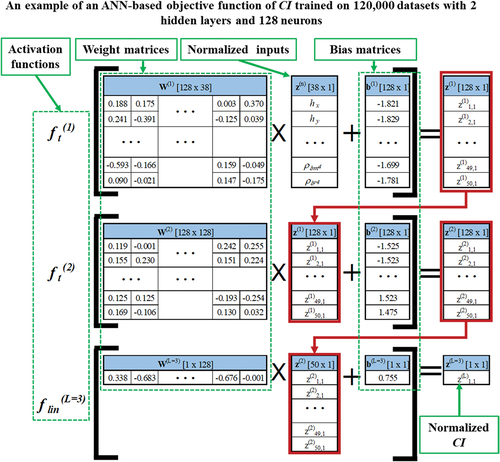
Eqs. (1) – (4) present an artificial multilayer perception (MLP) ANN, which is inspired by a biological neural system. An MLP neural network has multiple layers, consisting of a visible input layer, multiple hidden layers, and a visible output layer (Hong Citation2023c). ANN-based objective functions are derived by mapping 38 forward input parameters to 69 constrained forward output parameters of a PT piperack frame, replacing structural mechanics-based explicit formulas. Objective functions including costs, CO2 emissions, weights, and energy consumptions of designs can be respectively formulated using weight and bias matrices as shown in EquationEquation (1)(1)
(1) –EquationEquation (4)
(4)
(4) according to (Villarrubia et al. Citation2018). A part of the ANN-based function of cost trained on 120,000 datasets with two hidden layers and 128 neurons is shown in . Each layer of an ANN consists of a column of neurons, which is connected to the layer preceding it, as presented in , in which multiple layers and neurons are arranged in a feedforward fully connected network. Input and output layers are visible, but layers in the middle are called hidden layers because they are not visible. The Langrage functions are, then, formulated by implementing ANN-based objective functions for prestressed frames.
Figure 3. An example of an ANN-based objective function of CI trained on 120,000 datasets with 2 hidden layers and 128 neurons.
where
- De-normalizing function of objective functions
- A linear activation function of the output layer (L)
- Tanh activation functions of the hidden layers (1~L-1)
- Weight matrices of hidden layers and an output layer
- Bias matrices of hidden layers and an output layer
- Normalizing function
2.4. Step 3 of the ANN-based HLA: establishing constraints based on codes and architectural requirements
shows constraints required by codes when designing PT piperack, where ranges of big datasets of member sizes, rebar ratios, and tendon ratios are constrained by Requirement 1, while avoiding design errors due to extrapolations. It is noted that ranges of big datasets should be determined properly based on preliminary designs of frames, focusing on probable ranges of designs to reduce computational efforts. Requirements 2 to 12 constrain all design output parameters according to ACI 318–19 (Building Code Requirements for Structural Concrete ACI 318–19 Commentary on, & Building Code Requirements for Structural Concrete ACI 318R–19 Citation2019) and ASCE 7–16 (Loads and Structures Citation2017).
Table 2. Constraints required by codes when designing PT piperack.
2.5. Step 4 of the ANN-based hla solving lagrange functions using sequential quadratic programming (SQP)
MATLAB global optimization toolbox (MathWorks Citation2022c) and MATLAB optimization toolbox (MathWorks Citation2022d) are used to find stationary points (optimized design parameters) of piperack frames based on ANN-based objective function, equalities, and inequalities shown in EquationEquation (5)(5)
(5) . Optimized design parameters are determined by an iteration method named SQP (MathWorks Citation2022c), as shown in . In the first iteration, an initial input parameter
is established based on equalities and inequalities imposed on input parameters.
Figure 4. Flow chart for Lagrange optimizations using MATLAB global optimization toolbox (MathWorks Citation2022d, MathWorks Citation2022c, Kuhn and Tucker Citation1951, Fernando Martha et al. Citation2022, Fletcher Citation2013, Gill et al. Citation1984, Gill, Murray, and Wright Citation1991, Han Citation1977, Powell Citation1978).
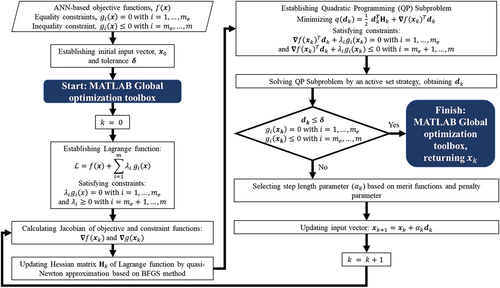
In the kth iteration, the toolbox calculates the Jacobian of objective () and constraint functions (
) at an input parameter
. A Hessian matrix (
at an input parameter
of Lagrange function shown in EquationEquation (6)
(6)
(6) is approximated by the quasi-Newton algorithm based on the Broyden – Fletcher–Goldfarb – Shanno (BFGS) method (Fletcher Citation2013).
A Quadratic Programming (QP) Subproblem shown in EquationEquation (7)(7)
(7) is established from the Hessian of Lagrange function and the Jacobian of objective and constraint functions. This QP Subproblem is solved by an active set strategy described in Gill et al. (Citation1984) and Gill, Murray, and Wright (Citation1991), providing
for updating input vector
for the next iteration.
Input parameter for the next iteration is updated using EquationEquation (8)(8)
(8) , where step length parameter (
) is selected based on merit functions developed in Han (Citation1977) and Powell (Citation1978) and penalty parameter recommended by Powell (Citation1978). The procedure returns to the step of recalculating Jacobian of objective and constraint functions, as shown in .
Updating input vector:
The algorithm finishes when an increment step is smaller than a predefined tolerance (
and all constraints are satisfied.
2.6. Multiple objective optimization (MOO) using a unified function of objectives (UFO)
presents five steps for optimizing piperack with multiple objective functions (UFO). Steps 1, 2, 3, and 5 are similar to those of optimizations with individual objective functions in . Step 4.1 uses the SQP algorithm to solve for maxima and minima of each objective function which are used to normalize objective functions to remove dominances of one parameter to others. Step 4.2 establishes a unified function of objectives (UFO) based on a weighted sum method introduced in (Zadeh Citation1963). The weighted sum method is a method for formulating UFO in MOO, combining multiple objective functions using weight fractions of contributions, as shown in EquationEquation (9)(9)
(9) . However, it is noted that combinations of weight fractions must be established properly to provide a non-discrete Pareto frontier (Afshari, Hare, and Tesfamariam Citation2019). Step 4.3 uses the SQP algorithm to solve for stationary points of UFO constrained by KKT conditions, producing designs optimizing multiple objective functions simultaneously.
Figure 5. Flow chart for optimizing piperack with multiple objective functions (UFO).
Where:
– A vector of 38 input parameters
– Trade-off ratios contributed by each objective function.
– Normalized individual objective function, removing dominances of one parameter to others.
…
– individual objective functions
– The minima of single objective function determined in Step 4.1 in
– The maxima of single objective function determined in Step 4.1 in
3. Optimization
3.1. Introducing a piperack frame under investigation
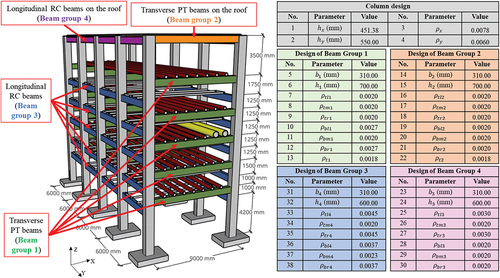
An example is established based on a refinery project in Karbala, Iraq (Calculation sheet of KARBALA REFINERY PROJECT, E, and Seoul Citation2015), where a segment containing four bays is investigated in the present study. shows a 4-bay frame with 11 staggered stories. RC longitudinal beams are placed on Stories 1, 3, 5, 7, 9, and 11, while PT transverse beams are located at Stories 2, 4, 6, 8, 10, and 11, avoiding interferences of one pipeline to another. Pipes on Stories 2, 4, 6, 8, and 10 and grading platforms on the top floor for operations and maintenance are supported by transverse PT frames. Beams are separated into four groups denoted by four colors in while the same design is used for all columns. Beam Groups 1 and 2 are PT beams where Beam Group 1 includes all transverse beams which support pipes, and Beam Group 2 are transverse beams on the roof that support the grading floor. Beam Groups 3 and 4 are longitudinal RC beams that do not support vertical loads. Material properties used in the present example are demonstrated in , where material prices are taken based on Korean markets in 2021, while unit CO2 emissions and energy consumptions of materials are estimated according to Hong et al. (Citation2010) and Kuk Kim et al. (Citation2013), respectively. shows 14 load cases in a piperack, which are combined in 75 service combinations for stress calculations, 29 combinations for determining deformations, and 81 factored combinations for strength checks. Detail load combinations can be found in APPENDIX F. The seismic and wind loads on structural components are automatically calculated by the ABBA frame generator from parameters in .
Figure 6. A staggered piperack frame under investigation (Calculation sheet of KARBALA REFINERY PROJECT, E, and Seoul Citation2015).
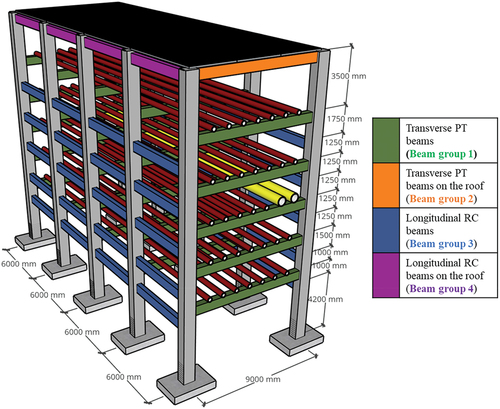
Table 3. Material properties.
Table 4. Unit costs, weights, CO2 emissions, and energy consumption of materials.
Table 5. 14 load cases considered in a PT piperack.
Table 6. Wind parameters (Calculation sheet of KARBALA REFINERY PROJECT, E, and Seoul Citation2015) input in the ABBA frame generator.
Table 7. Seismic parameters (Calculation sheet of KARBALA REFINERY PROJECT, E, and Seoul Citation2015) input in the ABBA frame generator.
3.2. Data ranges
shows definitions of parameters generated for the PT piperack frame in . A preliminary design is conducted based on criteria of lateral deflections, predetermining the appropriate beam depths and tendon areas. Predefined beam depths of in transverse PT beams and
in longitudinal RC beams produce clustered data within a range limited by the allowable lateral deflection
shown in . Tendon areas of
are used for all transverse PT beams. A tendon area of 400 mm2 is selected based on recommendations of (Raiss Citation1994), providing average prestress level at around 1.9 N/mm2. The design handbooks of PT floors (Raiss Citation1994) suggests selecting an average prestress level between 0.7 N/mm2 and 2 N/mm2 for solid slabs and occasionally up to 6 N/mm2 for waffle and ribbed slabs.
Figure 7. Data distribution of lateral deflections in the Y direction.
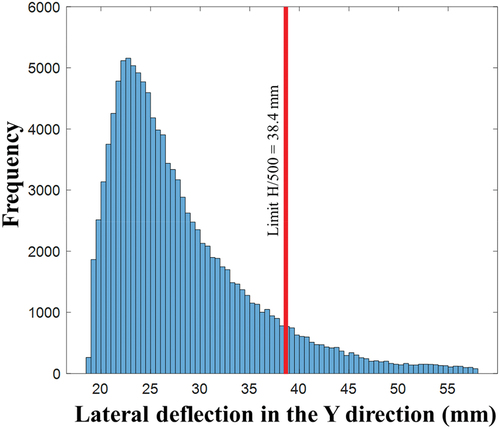
Table 8. Parameter generated for the PT piperack frame in .
presents ranges of all deflections, cambers and concrete compressive stresses calculated from input parameters shown in , where all values do not exceed limits required by ACI 318–19 (Building Code Requirements for Structural Concrete ACI 318–19 Commentary on, & Building Code Requirements for Structural Concrete ACI 318R–19 Citation2019). The maximum short-term deflection shown in ) is , which is smaller than a limit of
. ) shows the largest long-term deflection of
, which is smaller than a limit of
. The highest camber of
shown in ) occurs at beam Group 1 on the 10th floor, whereas a camber limit in beams is
. Deflections are one of the most important service parameters in building designs, deflection limits ensure the aesthetic and serviceability of structures. Short-term deflections present beam deformations immediately after applying loads while long-term deflections account for additional displacements due to time-dependent effects such as shrinkages, creeps, and relaxations. ) shows concrete compressive stresses at a transfer stage, where the largest stress is 7.217
, which is smaller than a limitation of
. Ranges of other output parameters are presented in of APPENDIX A
Table 9. Ranges of deflections, cambers and concrete compressive stresses.
3.3. Design constraints
~ show constraints, where constraints related to deflections and concrete compressive stresses are removed because the highest magnitudes in the big datasets do not exceed code-based limitations, as shown in . In other words, deflections and concrete compressive stresses do not exceed limitations regulated by codes even though constraints are not used. The training can be simplified to reduce running time when deflections and concrete compressive stresses are removed from training. show inequalities related to column and beam configurations, where member sizes, rebar ratios, and tendon ratios are constrained by ranges from big datasets, avoiding design errors due to extrapolations. It is noted that ranges of big datasets should be determined properly based on preliminary designs and the knowledge of frames, focusing on probable ranges for optimizations to reduce computational efforts. Inequalities in constrain all safety factors, rebar strains, story drift ratios, stability coefficient, and lateral deflections according to requirements imposed by ACI 318–19 (Building Code Requirements for Structural Concrete ACI 318–19 Commentary on, & Building Code Requirements for Structural Concrete ACI 318R–19 Citation2019) and ASCE 7–16 (Loads and Structures Citation2017). Inequalities in constrain all safety factors in beams and columns to be bigger than or equal to 1, satisfying Sections 9.5.1.1 and 10.5.1.1 of ACI 318–19 (Building Code Requirements for Structural Concrete ACI 318–19 Commentary on, & Building Code Requirements for Structural Concrete ACI 318R–19 Citation2019). Inequalities in constraints beam rebar strains of RC beams when concrete strain reaches 0.003 to be greater than or equal to 0.006, avoiding brittle failures in RC beams according to Section 9.3.3.1 of ACI 318–19 (Building Code Requirements for Structural Concrete ACI 318–19 Commentary on, & Building Code Requirements for Structural Concrete ACI 318R–19 Citation2019). Inequalities 106 and 107 in constraint maximum story drift ratios of all stories to be smaller than or equal to corresponding to a piperack frame with the Risk category III from .12–1 in ASCE 7–16 (Loads and Structures Citation2017). Inequalities 108 and 109 in constraint stability coefficients to be smaller than or equal to
according to Section 12.8.7 in ASCE 7–16 (Loads and Structures Citation2017). Inequalities 110 and 111 in constraint the lateral deflections due to wind loads to be smaller than or equal to
according to Section CC.2.2 in ASCE 7–16 (Loads and Structures Citation2017).
Table 10. Inequalities related to column configurations.
Table 11. Inequalities related to configurations of beam.
Table 12. Inequalities related to safety factors.
Table 13. Inequalities related to rebar strains in beam when concrete strains reach 0.003.
Table 14. Inequalities related to lateral loads.
3.4. Training accuracy
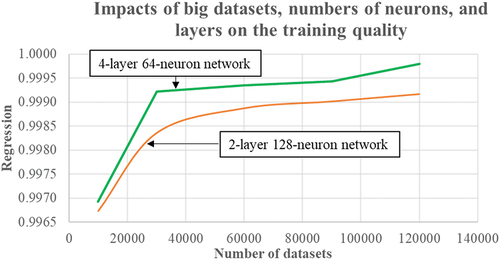
The present study evaluates training qualities based on regression values (correlation factor) calculated by the MATLAB deep learning toolbox, quantifying comparisons between predicted and targeted values in the test data. A value close to 1 represents good training qualities. compares training qualities based on four layers and 64 neurons with those based on two layers and 128 neurons, indicating that training qualities increase when the number of data samples increases. Regression values of the training with four layers and 64 neurons are higher than those from the training with two layers and 128, implying that a deeper network is better than a wider one in this case. Training with four layers and 64 neurons, thus, is used for all parameters. Training accuracies of constrained output parameters can be found in APPENDIX B, where training for short-term deflections, long-term deflections, and concrete stresses are not needed. These outputs satisfy code-based requirements without being constrained, as discussed in Section 3.3.
Figure 8. Comparison of training accuracies between a 2-layer 64-neuron network and a 4-layer 128-neuron network.
3.5. Optimized designs
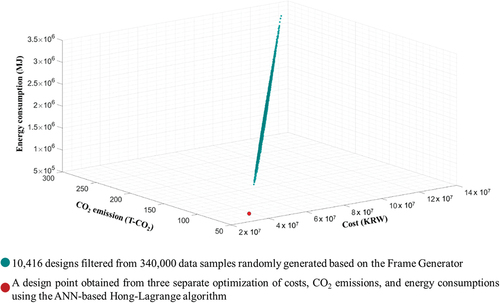
This section presents optimized designs and verifies them by big datasets, where 340,000 data samples are investigated, resulting in 10,416 designs satisfying all inequalities presented in Section 3.3. Let’s call these 10,416 designs satisfying all inequalities as filtered designs. Three separate optimizations of costs, CO2, and energies result in one design illustrated by a red point in , showing close relationships among these three objective functions. shows the three-dimensional optimizations of costs, CO2 emissions, and energy consumptions using the ANN-based HLA which are verified by 10,416 filtered designs, clearly illustrating positive correlations among costs, CO2 emissions, and energy consumptions. In other words, design optimizing costs also provide the minimum CO2 emissions and energy consumption. It can be observed that the costs, CO2 emissions, and energy consumptions of big data are considerably higher than those in the optimized designs, indicating the efficiencies of the proposed method.
Figure 9. A comparison among optimized costs, CO2 emissions, and energy consumptions obtained by the ANN-based HLA and those of 10,416 valid designs filtered from 340,000 big data samples.
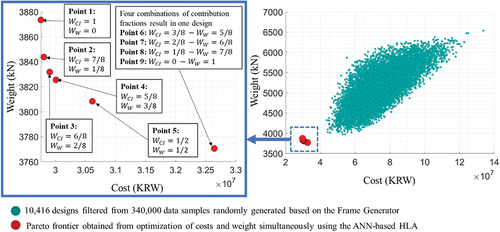
shows a Pareto frontier obtained by optimizing costs and weights simultaneously. It is noted that considering the two objective functions of CO2 emissions and energy consumption is not necessary when constructing the Pareto frontier because the costs, CO2 emissions, and energy consumption are minimized in a similar trend. A comparison between designs in the Pareto frontier and 10,416 filtered designs shows a saving up to 31.81% and 5.06% in costs and weights. A design optimizing cost also provides a saving of 38.63%, and 37.36% in CO2 emissions and energy consumption, respectively. It is noted that four combinations of contribution fractions result in one design minimizing weights, as shown in .
Figure 10. A comparison between Pareto frontier optimizing costs and weights by the ANN-based HLA and those of 10,416 valid designs filtered from 340,000 big data samples.
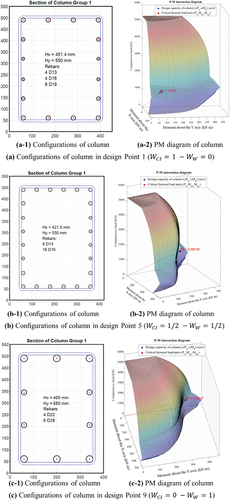
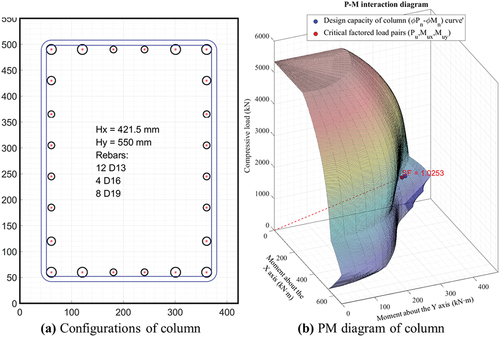
shows beam sections obtained from all nine design points in , where section dimensions of 700 mm × 310 mm for transverse beams and 600 mm × 310 mm for longitudinal beams are found. It is noted that 310 mm is the minimum beam width constrained by inequalities, indicating that narrow beams are suggested by the algorithm in all design points. In transverse PT beams (Beam Groups 1 and 2), 4ϕ13 corresponding to the minimum rebar ratios setup in are determined for all positions except for bottom rebars at supports of Beam Group 1, where 5ϕ13 is designed for resisting tensions due to lateral loads. Higher rebar ratios are required for longitudinal RC beams (Beam Groups 3 and 4), where rebar areas at supports are larger than those at mid-spans. It is noted that rebars presented in provided by the ANN-based HLA are rounded up to the closest natural numbers based on rebar ratios shown in APPENDIX C, automatically ensuring the constructability of the designs. For example, rebar ratios at bottom of the beam support in Design Points 1 (Parameter #10 in ) and 9 (Parameter #10 in ) are 0.0027 (4.41ϕ13) and 0.0028 (4.57ϕ13), respectively, resulting in a design of 5ϕ13 for both Design Points 1 and 9. shows column sections with P-M interaction diagrams for Design Points 1, 5, and 9. The optimized column section for minimizing costs, CO2 emissions, and energy consumption is 451.38 mm × 550.00 mm while 4ϕ13, 4ϕ16, and 8ϕ19 are identified, as shown in . A small column section of
and large rebars of 4ϕ22 and 6ϕ29 are used for minimizing weight, as shown in whereas a larger column volume of
and smaller rebars (4ϕ13, 4ϕ16, and 8ϕ19) are used for minimizing costs. Optimized designs of columns indicate an opposite trend in optimizing costs and weights, where a design with the minimum cost demands a large section with small rebars while the lightest design requires a small section and big rebars.
Figure 11. The same optimized beam sections are obtained from all nine design points in the Pareto of fig. 10.
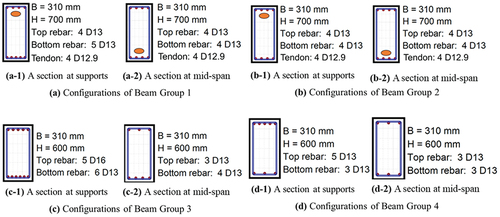
Figure 12. Optimized column sections with P-M interaction diagrams obtained from all design points 1, 5, and 9 in fig. 10.
The applicability and validity of AI-based designs should be evaluated based on design tables, where errors must be limited to avoid violating constraints. Design accuracies of ANN-based designs are presented in APPENDIX D where the largest design error is 6.6% shown in Row 6 of for Design Point 9. Design errors do not affect designs Points 1 and 9 because all design constraints are satisfied whereas a design error of 1.28% in Design Point 5 shown in Row 1 of makes column safety factor 0.987 below 1.0 which violates design requirements. However, a satisfactory safety factor of 1.0253 shown in can be achieved by slightly modifying rebar ratios of columns from and
to
. APPENDIX E shows deflections, cambers, and concrete stresses calculated by structural mechanics-based software. All deflections, cambers, and concrete stresses are smaller than their limits without being constrained because beam depths and tendon areas are predetermined as discussed in Section 3.2.
Figure 13. A revised column design of the design Point 5.
4. Conclusion
Optimized designs for piperack frames that meet all design requirements imposed by design standards ACI 318–19 and ASCE 7–16 are performed in this study. Designs are widely accepted once all code-based requirements are stratified, not requiring additional experiments because big datasets are generated using code-based equations which are established based on test data.
The present study introduces novel designs of PT piperack using ANN-based HLA, minimizing four objective functions including cost, CO2 emissions, weight, and energy consumption of an 11-story with four bays staggered piperack frame under 198 loads combinations. Optimized designs including 38 input variables are performed while satisfying 207 constraints imposed by codes and architecture. A robust and sustainable method is proposed, optimizing PT multi-story frames in general and piperack, in particular, using ANN technologies based on ANN-based HLA. Numerical solutions are provided by an SQP algorithm. Technologies for an auto-design of piperack frames are now available while optimizing design targets and improving design accuracies. The ANN-based proposed technologies are expected to contribute to the design and construction of PT piperack frames, providing economic alternatives to current steel piperack frames. An ABBA frame generator is developed for generating big datasets. Obtained datasets are verified by commercial software (MIDAS and ADAPT), reporting acceptable matches. ANN-based objective and constraint functions of a staggered 4-bay and 11-story piperack frame are formulated, where ANNs are implemented in mapping 38 input parameters to 69 constrained output parameters. Inequalities equal to 207 are imposed to design and optimize a Lagrange function of PT piperacks, reflecting requirements by codes and architecture. The key findings are as follows.
Designs of a staggered 4-bay and 11-story piperack frame demonstrate a reduction of up to 31.81%, 38.63%, 5.06%, and 37.36% in costs, CO2 emissions, weights, and energy consumption, respectively, compared with the minima of those identified based on 340,000 design samples.
The method shows a good potential of not only reducing human labor but also increasing the efficiency of the designs for piperack and building frames. It is noted that this is the first study that applies ANN-based algorithms to Pareto-based multiple objective optimizations of precast PT piperack frames. In future works, the algorithm will be applied to more versatile and complex types of structures including steel frames, SRC frames, dual frames, etc. A commercial software will also be prepared and released.
Abbreviations
| AI | = | Artificial intelligence |
| ANN | = | Artificial neural network |
| ABBA | = | Auto design-Based Building Application |
| HLA | = | ANN-based Hong-Lagrange Algorithm |
| SQP | = | Sequential Quadratic Programming |
| PT | = | Prestressed |
Acknowledgements
This work was supported by the National Research Foundation of Korea (NRF) grant funded by the Korean government (MSIT 2019R1A2C2004965).
Disclosure statement
No potential conflict of interest was reported by the author(s).
Additional information
Funding
Notes on contributors
Won-Kee Hong
Dr. Won-Kee Hong is a Professor of Architectural Engineering at Kyung Hee University. Dr. Hong received his Master’s and Ph.D. degrees from UCLA, and he worked for Englelkirk and Hart, Inc. (USA), Nihhon Sekkei (Japan) and Samsung Engineering and Construction Company (Korea) before joining Kyung Hee University (Korea). He also has professional engineering licenses from both Korea and the USA. Dr. Hong has more than 30 years of professional experience in structural engineering. His research interests include a new approach to construction technologies based on value engineering with hybrid composite structures. He has provided many useful solutions to issues in current structural design and construction technologies as a result of his research that combines structural engineering with construction technologies. He is the author of numerous papers and patents both in Korea and the USA. Currently, Dr. Hong is developing new connections that can be used with various types of frames including hybrid steel–concrete precast composite frames, precast frames and steel frames. These connections would help enable the modular construction of heavy plant structures and buildings. He recently published a book titled as ”Hybrid Composite Precast Systems: Numerical Investigation to Construction” (Elsevier).
Tien Dat Pham
Tien Dat Pham is currently enrolled as a Ph.D. candidate in the Department of Architectural Engineering at Kyung Hee University, Republic of Korea. His research interest includes precast structures.
References
- Afshari, H., W. Hare, and S. Tesfamariam. 2019. “Constrained Multi-Objective Optimization Algorithms: Review and Comparison with Application in Reinforced Concrete Structures.” Applied Soft Computing 83:105631. https://doi.org/10.1016/j.asoc.2019.105631.
- Baduge, S. K., S. Thilakarathna, J. S. Perera, M. Arashpour, P. Sharafi, B. Teodosio, A. Shringi, and P. Mendis. 2022. “Artificial Intelligence and Smart Vision for Building and Construction 4.0: Machine and Deep Learning Methods and Applications.” Automation in Construction 141 (June): 104440. https://doi.org/10.1016/j.autcon.2022.104440.
- Building Code Requirements for Structural Concrete (ACI 318-19) Commentary on, & Building Code Requirements for Structural Concrete (ACI 318R-19). 2019. ACI Committee, 318. Farmington Hills, USA: American Concrete Institute.
- Business Research Insights 2021. Pipe Hangers & Supports Market Size, Share, Growth, and Industry Analysis by Type and by Application. Accessed January 25, 2023. https://www.businessresearchinsights.com/market-reports/pipe-hangers-supports-market-101276.
- Camp, C. V., and F. Huq. 2013. “CO2 and Cost Optimization of Reinforced Concrete Frames Using a Big Bang-Big Crunch Algorithm.” Engineering Structures 48:363–372. https://doi.org/10.1016/j.engstruct.2012.09.004.
- Coley, D. A., and S. Schukat. 2002. “Low-Energy Design: Combining Computer-Based Optimisation and Human Judgement.” Building and Environment 37 (12): 1241–1247. https://doi.org/10.1016/S0360-1323(01)00106-8.
- Fernando Martha, L., R. Lopez Rangel, P. Cortez Lopes, and C. Horta. 2022. LESM. Brasil: PONTIFICAL CATHOLIC UNIVERSITY OF RIO DE JANEIRO.
- Fletcher, R. 2013. Practical Methods of Optimization. Hoboken, New Jersey, USA: John Wiley & Sons.
- Gill, P. E., W. Murray, M. A. Saunders, and M. H. Wright. 1984. “Procedures for Optimization Problems with a Mixture of Bounds and General Linear Constraints.” Transactions on Mathematical Software 10 (3): 282–298. https://doi.org/10.1145/1271.1276.
- Gill, P. E., W. Murray, and M. H. Wright. 1991. Numerical Linear Algebra and Optimization. Vol. 1. Boston, USA: Addison Wesley.
- Han, S. P. 1977. “A Globally Convergent Method for Nonlinear Programming.” Journal of Optimization Theory and Applications 22 (3): 297. https://doi.org/10.1007/BF00932858.
- Hong, W.-K. 2019. Hybrid Composite Precast Systems (Numerical Investigation to Construction). December. Amsterdam, Netherlands: Elsevier.
- Hong, W.-K.October2021Artificial Intelligence-Based Design of Reinforced Concrete StructuresDaegahttps://doi.org/10.1201/9781003314684
- Hong, W.-K. 2022. AI-Based Data-Centric Engineering (AIDE) Using ANN-Based Hong-Lagrange Optimizations. Seoul, Korea: Daega.
- Hong, W.-K.December2022aAI-Based Data-Centric Engineering (AIDE) for Reinforced Concrete Columns Using ANN-Based Hong-Lagrange OptimizationDaegahttps://doi.org/10.1201/9781003314684-3
- Hong, W.-K.December2022bOptimization of a Reinforced Concrete Beam Design Using ANN-Based Lagrange AlgorithmCRC Presshttps://doi.org/10.1201/9781003314684-4
- Hong, W.-K. 2023a. Artificial Neural Network-Based Optimized Design of Reinforced Concrete Structures. Tayor & Francis (CRC press). https://doi.org/10.1201/9781003314684.
- Hong, W.-K. 2023b. Artificial Neural Network-Based Prestressed Concrete and Composite Structures. Tayor & Francis (CRC press). (In printing). March. https://doi.org/10.1201/9781003354796.
- Hong, W.-K. 2023c. “(Artificial Neural Networks for Engineering Applications).” In Artificial Intelligence-Based Design of Reinforced Concrete Structures, 329–394. Elsevier. https://doi.org/10.1016/B978-0-443-15252-8.00004-2.
- Hong, W.-K., J.-M. Kim, S.-C. Park, S.-G. Lee, S.-I. Kim, K.-J. Yoon, H.-C. Kim, and J. T. Kim. 2010. “A New Apartment Construction Technology with Effective CO2 Emission Reduction Capabilities.” Energy 35 (6). https://doi.org/10.1016/j.energy.2009.05.036.
- Hong, W. K., V. T. Nguyen, D. H. Nguyen, and M. C. Nguyen. 2022. “An AI-Based Lagrange Optimization for a Design for Concrete Columns Encasing H-Shaped Steel Sections Under a Biaxial Bending.” Journal of Asian Architecture and Building Engineering 22 (2): 821–841. https://doi.org/10.1080/13467581.2022.2060985.
- Hong, W. K., M. C. Nguyen, T. D. Pham, and T. A. Le. 2022. “Holistic Design of Pre-Tensioned Concrete Beams Based on Artificial Intelligence.” Journal of Asian Architecture and Building Engineering 22 (3): 1714–1745. https://doi.org/10.1080/13467581.2022.2097909.
- Hong, W., T. D. Pham, W. Hong, and T. D. Pham. 2023. “An AI-Based Auto-Design for Optimizing RC Frames Using the ANN-Based Hong – Lagrange Algorithm an AI-Based Auto-Design for Optimizing RC Frames Using the ANN-Based Hong –.” Journal of Asian Architecture and Building Engineering 1–13. https://doi.org/10.1080/13467581.2023.2193621.
- Katoch, S., S. S. Chauhan, and V. Kumar. 2021. “A Review on Genetic Algorithm: Past, Present, and Future.” Multimedia Tools & Applications 80 (5): 8091–8126. https://doi.org/10.1007/s11042-020-10139-6.
- Kaveh, A., and S. R. Ardebili. 2022. “Optimum Design of 3D Reinforced Concrete Frames Using IPGO Algorithm.” https://doi.org/10.21203/rs.3.rs-1507625/v1.
- Kaveh, A., and A. F. Behnam. 2013. “Design Optimization of Reinforced Concrete 3D Structures Considering Frequency Constraints via a Charged System Search.” Scientia Iranica 20 (3): 387–396. https://doi.org/10.1016/j.scient.2012.11.017.
- Korea, G. S. C. 2015. Calculation sheet of KARBALA REFINERY PROJECT. Seoul Korea.
- Kuhn, H. W., A. W. Tucker 1951. Nonlinear Programming. Berkeley Symposium on Mathematical Statistics and Probability, Statistical Laboratory, University of California, Berkeley.
- Kuk Kim, S., W.-K. Hong, K. Hyo-Jin, and J. Tai Kim. 2013. “The Energy Efficient Expansion Remodeling Construction Method of Bearing Wall Apartment Buildings with Pre-Cast Composite Structural Systems.” Energy and Buildings 66:714–723. https://doi.org/10.1016/j.enbuild.2013.07.080.
- Leyva, H., J. Bojórquez, E. Bojórquez, A. Reyes-Salazar, J. Carrillo, and F. López-Almansa. 2021. “Multi-Objective Seismic Design of BRBs-Reinforced Concrete Buildings Using Genetic Algorithms.” Structural and Multidisciplinary Optimization 64 (4): 2097–2112. https://doi.org/10.1007/s00158-021-02965-5.
- Loads, M. D., and O. Structures. 2017. “Minimum Design Loads and Associated Criteria for Buildings and Other Structures.” Minimum Design Loads and Associated Criteria for Buildings and Other Structures. https://doi.org/10.1061/9780784414248.
- MacGregor, J. G. 1976. “Safety and Limit States Design for Reinforced Concrete.” Canadian Journal of Civil Engineering 3 (4): 484–513. https://doi.org/10.1139/l76-055.
- Machairas, V., A. Tsangrassoulis, and K. Axarli. 2014. “Algorithms for Optimization of Building Design: A Review.” Renewable and Sustainable Energy Reviews 31 (1364): 101–112. https://doi.org/10.1016/j.rser.2013.11.036.
- MathWorks. 2022a. MATLAB (R2022a). Natick, Massachusetts, USA: MathWorks.
- MathWorks. 2022b. “Deep Learning Toolbox: User’s Guide (R2022a).” Accessed July 26, 2012. https://www.mathworks.com/help/pdf_doc/deeplearning/nnet_ug.pdf.
- MathWorks. 2022c. “Global Optimization: User’s Guide (R2022a).” Accessed July 26, 2012. https://www.mathworks.com/help/pdf_doc/gads/gads.pdf.
- MathWorks. 2022d. “Optimization Toolbox: Documentation (R2022a).” Accessed July 26, 2022. https://uk.mathworks.com/help/optim/.
- MathWorks. 2022e. “Parallel Computing Toolbox: Documentation (R2022a).” Accessed July 26, 2022. https://uk.mathworks.com/help/parallel-computing/.
- MathWorks. 2022f. “Statistics and Machine Learning Toolbox: Documentation (R2022a).” Accessed July 26, 2022. https://uk.mathworks.com/help/stats/.
- Mergos, P. E. 2021. “Optimum Design of 3D Reinforced Concrete Building Frames with the Flower Pollination Algorithm.” Journal of Building Engineering 44 (March): 102935. https://doi.org/10.1016/j.jobe.2021.102935.
- Nikzad, H., and S. Yoshitomi. 2017. “Structural Optimization Method for 3D Reinforced Concrete Building Structure with Shear Wall.“ World Academy of Science, Engineering and Technology International Journal of Civil and Environmental Engineering 11 (9): 1352–1358.
- Nikzad, H., and S. Yoshitomi. 2018. “Practical Design Procedures of 3D Reinforced Concrete Shear Wall-Frame Structure Based on Structural Optimization Method.” International Journal of Urban and Civil Engineering 12 (6): 694–702.
- Paya-Zaforteza, I., V. Yepes, A. Hospitaler, and F. González-Vidosa. 2009. “CO2-Optimization of Reinforced Concrete Frames by Simulated Annealing.” Engineering Structures 31 (7): 1501–1508. https://doi.org/10.1016/j.engstruct.2009.02.034.
- Peippo, K., P. D. Lund, and E. Vartiainen. 1999. “Multivariate Optimization of Design Trade-Offs for Solar Low Energy Buildings.” Energy and Buildings 29 (2): 189–205. https://doi.org/10.1016/s0378-7788(98)00055-3.
- Powell, M. J. D. 1978. “A Fast Algorithm for Nonlinearly Constrained Optimization Calculations. Lecture Notes in Mathematics.” In Numerical Analysis, G. A. Watson. edited by, Vol. 630 144–157, Springer Verlag. https://doi.org/10.1007/BFb0067703
- Raiss, M. E. 1994. Post-Tensioned Concrete Floors-Design Handbook. Sandhurst, Berkshire, United Kingdom: Concrete Society.
- Sahab, M. G., A. F. Ashour, and V. V. Toropov. 2005. “Cost Optimization of Reinforced Concrete Flat Slab Buildings.” Engineering Structures 27 (3): 313–322. https://doi.org/10.1016/j.engstruct.2004.10.002.
- Sharafi, P., M. N. S. Hadi, and L. H. Teh. 2012. “Heuristic Approach for Optimum Cost and Layout Design of 3D Reinforced Concrete Frames.” Journal of Structural Engineering 138 (7): 853–863. https://doi.org/10.1061/(asce)st.1943-541x.0000508.
- Sher, F., S. Chen, A. Raza, T. Rasheed, O. Razmkhah, T. Rashid, P. M. Rafi-Ul-Shan, and B. Erten. 2021. “Novel Strategies to Reduce Engine Emissions and Improve Energy Efficiency in Hybrid Vehicles.” Cleaner Engineering and Technology 2 (February): 100074. https://doi.org/10.1016/j.clet.2021.100074.
- Sher, F., A. Hazafa, K. Marintseva, T. Rasheed, U. Ali, T. Rashid, A. Babu, and M. Khzouz. 2021. “Fully Solar Powered Doncaster Sheffield Airport: Energy Evaluation, Glare Analysis and CO2 Mitigation.” Sustainable Energy Technologies and Assessments 45 (October 2020):101122. https://doi.org/10.1016/j.seta.2021.101122.
- Thilakarathna, P. S. M., S. Seo, K. S. K. Baduge, H. Lee, P. Mendis, and G. Foliente. 2020. “Embodied Carbon Analysis and Benchmarking Emissions of High and Ultra-High Strength Concrete Using Machine Learning Algorithms.” Journal of Cleaner Production 262 (February 2019): 121281. https://doi.org/10.1016/j.jclepro.2020.121281.
- Villarrubia, G., J. F. De Paz, P. Chamoso, and F. De la Prieta. 2018. “Artificial Neural Networks Used in Optimization Problems.” Neurocomputing 272:10–16. https://doi.org/10.1016/j.neucom.2017.04.075.
- Wang, L., W. Shi, X. Li, Q. Zhang, and Y. Zhou. 2019. “An Adaptive‐Passive Retuning Device for a Pendulum Tuned Mass Damper Considering Mass Uncertainty and Optimum Frequency.” Structural Control and Health Monitoring 26 (7): e2377. https://doi.org/10.1002/stc.2377.
- Wang, L., W. Shi, Q. Zhang, and Y. Zhou. 2020. “Study on Adaptive-Passive Multiple Tuned Mass Damper with Variable Mass for a Large-Span Floor Structure.” Engineering Structures 209:110010. https://doi.org/10.1016/j.engstruct.2019.110010.
- Wang, L., W. Shi, and Y. Zhou. 2019. “Study on Self‐Adjustable Variable Pendulum Tuned Mass Damper.” The Structural Design of Tall & Special Buildings 28 (1): e1561. https://doi.org/10.1002/tal.1561.
- Wang, L., W. Shi, Y. Zhou, and Q. Zhang. 2020. “Semi-Active Eddy Current Pendulum Tuned Mass Damper with Variable Frequency and Damping.” Smart Structures and Systems 25 (1): 65–80. https://doi.org/10.12989/sss.2020.25.1.065.
- Wright, J., & R. Farmani 2001. The Simultaneous Optimization of Building Fabric Construction, Hvac System Size, and the Plant Control Strategy. 7th IBPSA Conference, January 2014, Rio de Janeiro, Brazil. 865–872.
- Yaqoob, H., Y. H. Teoh, T. S. Goraya, F. Sher, M. A. Jamil, T. Rashid, and K. A. Yar. 2021. “Energy Evaluation and Environmental Impact Assessment of Transportation Fuels in Pakistan.” Case Studies in Chemical and Environmental Engineering 3 (January): 100081. https://doi.org/10.1016/j.cscee.2021.100081.
- Yaqoob, H., Y. H. Teoh, F. Sher, M. A. Jamil, M. Ali, Ü. Ağbulut, H. A. Salam, et al. 2022. “Energy, Exergy, Sustainability and Economic Analysis of Waste Tire Pyrolysis Oil Blends with Different Nanoparticle Additives in Spark Ignition Engine.” Energy 251:123697. https://doi.org/10.1016/j.energy.2022.123697.
- Yi, Y. K., and A. M. Malkawi. 2009. “Optimizing Building Form for Energy Performance Based on Hierarchical Geometry Relation.” Automation in Construction 18 (6): 825–833. https://doi.org/10.1016/j.autcon.2009.03.006.
- Zadeh, L. 1963. “Optimality and Non-Scalar-Valued Performance Criteria.” IEEE Transactions on Automatic Control 8 (1): 59–60. https://doi.org/10.1109/TAC.1963.1105511.
- Zou, X. K., C. M. Chan, G. Li, and Q. Wang. 2007. “Multiobjective Optimization for Performance-Based Design of Reinforced Concrete Frames.” Journal of Structural Engineering 133 (10): 1462–1474. https://doi.org/10.1061/(asce)0733-9445(2007)133:10(1462).
APPENDIX A:
Ranges of input and output parameters in 120,000 data samples
Table A1. Ranges of input parameters.
Table A2. Ranges of output parameters (excluding deflections, cambers and concrete compressive stresses presented in table 9).
APPENDIX B:
Training accuracy
Table B1. Training table four layers and 64 neurons.
Table
APPENDIX C:
Beam and column configurations obtained from ANN-based HLA
Beam and column configurations of design Point 1 obtained from ANN-based HLA.
Beam and column configurations of design Point 5 obtained from ANN-based HLA.

Beam and column configurations of design Point 9 obtained from ANN-based HLA.

APPENDIX D:
Design accuracy obtained from ANN-based HLA
Table D1. Forward design output parameters of design Point 1 calculated by ANNs and verified structural mechanics-based software.
Table D2. Forward design output parameters of design Point 5 calculated by ANNs and verified structural mechanics-based software.
Table D3. Forward design output parameters of design Point 9 calculated by ANNs and verified structural mechanics-based software.
APPENDIX E:
Forward design output parameters calculated by structural mechanics-based software
Table E1. Forward design output parameters of design Point 1 calculated by structural mechanics-based software.
Table E2. Forward design output parameters of design Point 5 calculated by structural mechanics-based software.
Table E3. Forward design output parameters of design Point 9 calculated by structural mechanics-based software.
APPENDIX F:
Load combination
Table F1. Service load combinations.
Table F2. Load combinations for calculating immediate deflections.
Table F3. A load combination for a transfer stage.
Table F4. A load combination of sustain loads for calculating long-term deflections.
Table F5. Factored load combinations.
Table F6. Combinations for calculating story drifts due to seismic loads.
Table F7. Combinations for calculating lateral deflections.
Table F8. A combination of vertical loads for checking P-delta effects.
Table F9. A combination of vertical loads for calculating structural masses.