
 ?Mathematical formulae have been encoded as MathML and are displayed in this HTML version using MathJax in order to improve their display. Uncheck the box to turn MathJax off. This feature requires Javascript. Click on a formula to zoom.
ABSTRACT
Deep-plan buildings limit daylight use in spaces far from the building perimeter, leading to uneven daylight distribution. Integrating a Horizontal Light Pipe (HLP) as an optical daylighting system, reflective light shelves, and blinds as shading systems can reduce excessive daylight levels at the perimeter area of a building and improve daylight uniformity. Earlier investigations of HLP daylight performance concentrated on fixed building geometries, but few studies focused on the building aspect ratio, one of the design variables of building geometry that greatly influences daylight performance. This study aims to investigate the impact of the aspect ratio of buildings implementing HLP and shading systems on daylight performance. The research method was experimental, using IES-VE simulation as a tool. The daylight factor (DF), uniformity daylight factor (UDF), and useful daylight illuminance (UDI) of various aspect ratios and depths of office buildings implementing HLP and shading systems were analyzed. The results show that increasing the building aspect ratio from 1:1 to 2.1:1 sequentially increased the average DF and UDF values by 18.47% and 17.2%, respectively. Improving the building aspect ratio from 1:1 to 2.1:1 along the east-west axis improved the UDI by 3%, whereas the north-south axis decreased it by 10.2%.
1. Introduction
Daylight use can reduce the energy consumption of a building and decrease the cooling load and peak demand. Proper daylighting use in buildings can decrease the energy used for electric lighting and the energy consumption of the entire building (Chen et al. Citation2014; Chi, Moreno, and Navarro Citation2018; Wong Citation2017). Natural daylight also reduces the sensible cooling load amount due to electric lighting (Li, Lam, and Wong Citation2005) and lowers the cooling load of buildings (Boubekri Citation2014). Proper daylighting design lowers the air-conditioning system’s (Alrubaih et al. Citation2013) and the building’s peak power demand (Li, Lam, and Wong Citation2005). Reducing peak demand is necessary for office buildings occupied in the daytime. Peak demand usually occurs when daylight is most abundant (Boubekri Citation2014).
Daylight also positively affects human comfort and health. Daylight is the best source of light and is the most probable equivalent to the human visual response (Alrubaih et al. Citation2013). It also makes the interior space appear livelier and more attractive. Building users prefer good daylighting in their working and living environments (Li and Lam Citation2003). Daylight is also associated with serotonin and melatonin hormone production, which regulate circadian rhythms. Inadequate daylight exposure and serotonin or melatonin cycle disturbances can cause seasonal affective disorder (SAD) (Boubekri Citation2014). Daylight has also become one of the most effective antidepressants available (Boubekri Citation2008). Therefore, buildings should provide human exposure to sunlight to facilitate cutaneous photosynthesis, which provides most or all human vitamin D needs (Boubekri Citation2008).
Other essential aspects of daylighting include user productivity and economic value. Daylighting improves productivity in workplaces (Ander Citation2003). Tenants spend 5–6% more on office areas with high daylight than those with low daylight presence (Turan et al. Citation2020). Spaces with high view and daylight access also have a 6% effective rent premium over areas with inadequate access to view and daylight (Turan et al. Citation2021).
The potential for daylight utilization in the tropics is high. Daylight is abundant in this area because of the high sun intensity and long illumination period during the daytime (Roshan and Salisu Citation2016). Studies of daylighting in the tropics need to consider inconsistent cloud formation of intermediate skies, which are neither clear nor overcast (Lim and Heng Citation2016). Global illuminance at noon reached 80 Klux in March and 60 Klux in December (Zain-Ahmed et al. Citation2002).
From the architectural design standpoint, a building should have a narrow plan to optimize daylighting (G-Hansen Citation2006). Nevertheless, deep-plan buildings are commonly developed to maximize the net floor area (G-Hansen Citation2006; Mayhoub Citation2014). A deep-plan building design limits the daylight level in spaces far from side windows. The daylight intensity reduces as the distance from the side window increases (Urbano Gutiérrez et al. Citation2019), leading to uneven daylight distribution and glare problems (Heng, Lim, and Remaz Ossen Citation2020; Mayhoub Citation2014). A core daylighting system is required to bring daylight in spaces around the building perimeter (Friedrich, Wittkopf, and Louis Scartezzini Citation2010).
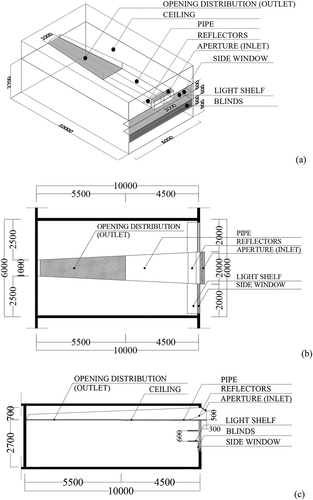
A Horizontal Light Pipe (HLP) is one of the core daylighting systems that can bring daylight further into a building’s interiors. The HLP consists of an aperture, a pipe, and an opening distribution. The aperture collects, redirects, and occasionally concentrates or collimates the incoming light flux (Canziani, Peron, and Rossi Citation2004). Pipe transports and opening distribution distributes daylight to the deep area of the building. HLP is placed in the plenum above the ceiling (Canziani, Peron, and Rossi Citation2004). HLP increases the daylight factor (DF), and estimated indoor illuminance reaches 25% and 24%, sequentially, in deep office spaces (Heng, Lim, and Remaz Ossen Citation2020).
The aperture is located at the building façade, with a flat capturing system to minimize the protrusion of the building façade (Canziani, Peron, and Rossi Citation2004). The aperture is equipped with reflectors to redirect the incoming sunlight to minimize inter-reflections within the pipe and to maximize the system efficiency (Canziani, Peron, and Rossi Citation2004; G-Hansen Citation2006), especially the oblique sunbeam in cases of solar positions not in axis with the pipe (Canziani, Peron, and Rossi Citation2004). Material of reflectors is a highly reflective specular material, such as an aluminum sheet (Canziani, Peron, and Rossi Citation2004; Duc Hien and Chirarattananon Citation2009; Obradovic and Matusiak Citation2021), silver, mirror folium with a reflectivity of 99% (Obradovic and Matusiak Citation2021). The aperture is covered by clear glazing (Duc Hien and Chirarattananon Citation2009) with a visible transmittance of 88%.
The pipe transports the light with the principle of multiple specular reflections. The efficiency of a mirror Light Pipe depends on the area, the pipe’s geometric form, the material’s reflectivity, and the light sources’ directional properties (Hansen and Edmonds Citation2003). The pipe materials are highly specular, such as specular reflective film with a reflectance of 95% (Beltran, Lee, and Selkowitz Citation1997; Canziani, Peron, and Rossi Citation2004), polished aluminum with a reflectivity of 85%, or silvered aluminum with a reflectivity of 95%. In cross-section, the pipe is tapered toward the rear of the room (Beltrán and Mogo Citation2007).
The opening distribution or diffuser transmits daylight to the deep area of the building. The opening distribution is located at the ceiling plane (), at 4.5 m from the side window to the building depth, to optimize the light pipe efficiency (Beltran, Lee, and Selkowitz Citation1997). The material of opening distribution is translucent sheets (Chirarattananon, Chedsiri, and Renshen Citation2000), clear glass with egg-crate reflectors (Elsiana, Soehartono, and Kristanto Citation2020), clear glazing (Elsiana, Nastiti N Ekasiwi, and Gusti Ngurah Antaryama Citation2021), and laser-cut panels (Hansen and Edmonds Citation2003; Kwok and Chung Citation2008).
Figure 1. Office room with horizontal light pipe and shading systems (a) perspective (b) plan and (c) section (Elsiana, Nastiti N Ekasiwi, and Gusti Ngurah Antaryama Citation2021).
The HLP obtains daylight from half of the hemisphere in front of the aperture (Duc Hien and Chirarattananon Citation2009). HLP captures and utilizes direct sunlight. HLP can be installed on any building floor (Duc Hien and Chirarattananon Citation2009), supplement the daylight provided by a side window, and become the primary daylight source in deep areas of the building (Beltran, Lee, and Selkowitz Citation1997).
In the tropics, HLP should be combined with shading systems (Elsiana, Nastiti N Ekasiwi, and Gusti Ngurah Antaryama Citation2021) to reduce high daylight intensity adjacent to the perimeter window (Heng, Lim, and Remaz Ossen Citation2020; Kim et al. Citation2015) and improve daylight uniformity (Elsiana, Nastiti N Ekasiwi, and Gusti Ngurah Antaryama Citation2021). In addition to controlling excessive daylight (Lim and Heng Citation2016), shading systems can protect buildings from direct sunlight and reduce glare problems (Luca, Sepúlveda, and Varjas Citation2022). Internal shading consisting of reflective light shelves and blinds was used in this study. Reflective light shelves can redirect daylight to the ceiling and improve daylight distribution (Hashemi Citation2014), whereas blinds can reduce luminance contrast. The combination of LS and partial blinds at a height of 1.20 m is an effective shading design for office buildings in the tropics (Lim, Hamdan Ahmad, and Remaz Ossen Citation2013).
shows the design of an office room with an HLP, light shelves, and blinds. The aperture captures sunlight and daylight using a fixed mirror system. The pipe transports daylight through multiple specular reflections, and the opening distribution distributes daylight through the translucent glass. Internal shading consists of light shelves that redirect sunlight to the ceiling for better daylight distribution (Kontadakis, Tsangrassoulis, and Doulos Citation2018) and blinds that control direct sunlight (Gomes, Santos, and Calhau Citation2022).
Previous research on HLP has mainly focused on improving its efficiency in capturing, transporting, and distributing daylight. This research includes modification of the HLP geometry and utilization of reflectors (Beltrán and Mogo Citation2007; Beltran, Lee, and Selkowitz Citation1997); laser cut panels at the aperture and opening distribution (Hansen and Edmonds Citation2003; Kwok and Chung Citation2008); anidolic daylighting systems (Heng, Lim, and Remaz Ossen Citation2020; Roshan and Salisu Citation2016), active reflectors (Canziani, Peron, and Rossi Citation2004), egg-crate reflectors (Elsiana, Soehartono, and Kristanto Citation2020), and mirror systems (Duc Hien and Chirarattananon Citation2009). In this research, building geometry, which is one of the design aspects that significantly affects the daylight and energy performance of a building (Fang and Cho Citation2019), is studied.
Building geometry is one of the most essential architectural decisions made in the early design stage (Fang and Cho Citation2019). Exploring design possibilities in the early design stages, including building geometry, is important. Building geometry and fenestration selections significantly impact energy uses, making them a key area of attention for performance enhancements to reach low or zero-net energy buildings (Konis, Gamas, and Kensek Citation2016). Building geometry determines the quality of light distribution (Egan and Olgyay Citation2002).
Earlier studies on building geometry commonly focused on thermal performance (Inanici and Nur Demirbilek Citation2000; Jiayu et al. Citation2022; Yang et al. Citation2021) and energy performance (Chen, Janssen, and Schlueter Citation2018; Mckeen and Fung Citation2014). Earlier investigations concerning daylight performance concentrated on fixed building geometries. The design variables of these studies included the window-to-wall ratio, window orientation, wall reflectance (Mangkuto, Rohmah, and Dian Asri Citation2016), window type, and window-to-wall ratio (Lartigue, Lasternas, and Loftness Citation2014).
Previous studies on daylight performance evaluation and building geometry have focused on buildings with skylights (Fang and Cho Citation2019), side window strategies (Lee, Boubekri, and Liang Citation2019), and shading (Maltais and Gosselin Citation2017; Sepúlveda et al. Citation2020) in non-tropical areas. Building geometry influences daylight performance differently for different climate zones (Fang and Cho Citation2019). Studies on building geometry concerning daylight performance in the tropics are limited, particularly those integrating HLP as a light transport system.
This study focuses on building aspect ratio, the ratio between the building length and width (Inanici and Nur Demirbilek Citation2000), as one of the design variables of building geometry. Building aspect ratio is one of the most important factors influencing daylight performance (Fang and Cho Citation2019; Kibert Citation2008). The study location is Surabaya (7°21` S, 112°36’ E), a city in the Tropics. This study evaluates the impact of the aspect ratio of buildings implementing HLP and shading systems on daylight performance in the tropics. The optimum aspect ratio of buildings implementing HLP and shading systems in the tropics with the highest daylight performance was also presented. The findings will provide information for architects in designing the aspect ratio of buildings integrating HLP and shading systems in the early design stages.
2. Sky condition of Surabaya
Surabaya, Indonesia, is one of the cities in the Tropics. The tropical sky is predominant with the intermediate sky, which means it is neither overcast nor clear (Lim and Heng Citation2016; Roshan and Salisu Citation2016). The following section focuses on the determination and classification of three sky conditions: overcast, intermediate, and clear sky in Surabaya, using the sunshine duration method (Rahim and Mulyadi Citation2004).
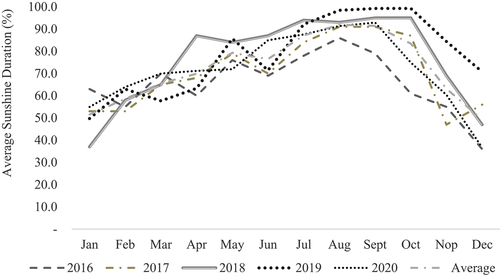
Sunshine duration data from 2016–2020 measured at the Tanjung Perak II Station of Indonesia’s Meteorological, Climatological, and Geophysical Agency in Surabaya were analyzed. shows Surabaya’s solar radiation data profile from 2016–2020. The profile indicates that the shortest average sunshine duration occurred in December, as high as 49.3%. The longest average sunshine duration was observed in August, as high as 92%. The average sunshine duration in Surabaya from 2016–2020 was 72.3%.
Figure 2. Average sunshine duration of Surabaya (CitationMeteorological, Climatological, and Geophysical Agency of Surabaya).
Relative sunshine duration is the ratio of the sunshine duration to the maximum possible duration in a certain period (Rahim and Mulyadi Citation2004). The monthly mean value of the relative sunshine duration (σm) is employed to estimate the probability of occurrence of the clear (Pcl), intermediate (Pin), and overcast sky (Poc). The equations for the monthly probabilities of the occurrence of clear, intermediate, and overcast skies are:
where:
Pcl (%) = monthly probability of occurrence of clear sky
Pin (%) = monthly probability of occurrence of intermediate sky
Poc (%) = monthly probability of occurrence of overcast sky
(%) = monthly mean value of relative sunshine duration
shows the average sunshine duration and the estimated probability of occurrence of clear, intermediate, and overcast sky conditions. The yearly relative frequency of occurrence of overcast (Poc), intermediate (Pin), and clear sky (Pcl), corresponding to the working period in Surabaya, were 11.9%, 72.1%, and 16.1%, respectively. The intermediate sky had the highest probability of occurrence of sky conditions in Surabaya. These results align with the previous study about sky conditions in the Tropics (Lim and Heng Citation2016).
Figure 3. The average sunshine duration and the estimated probability of occurrence of clear, intermediate, and overcast sky conditions.
3. Methodology
The method of the research was experimental, using simulation as a tool. Building performance simulation is a useful tool for evaluating design options and their environmental performance (Brembilla, Drosou, and Mardaljevic Citation2022). Integrated Environment Solution-Virtual Environment (IES-VE) daylight simulation was used to study the daylight performance of various aspect ratios of buildings implementing HLP and shading systems. The IES-VE is based on radiance, which uses a raytracing calculation method and considers surface transmission, reflection, and refraction values (Heng, Lim, and Remaz Ossen Citation2020; Lim and Heng Citation2016). Radiance has been extensively validated and is an unbiased daylight simulation tool (Ayoub Citation2020). IES-VE is stable, tested, and based on validated Building Performance Simulation results (Negendahl Citation2015). IES-VE is widely used worldwide and can simulate various daylighting systems and lighting design features.
IES-VE has been validated in previous research on HLP (Heng, Lim, and Remaz Ossen Citation2020), dynamic internal light shelves (Lim and Heng Citation2016), light shelves, anidolic systems, translucent materials, light shelves with external reflectors (Freewan and Al Dalala Citation2020), light shelves, external horizontal louvers, internal horizontal blinds (Reffat and Ahmad Citation2020), and anidolic daylighting system (Roshan and Salisu Citation2016). The correlation of the daylight factor and daylight ratio of IES-VE simulation results and physical scaled model 1:10 measurements results focusing on HLP, and dynamic internal light shelves were in the range of 0.92 to 0.95 (Heng, Lim, and Remaz Ossen Citation2020) and 0.83–0.99 (Lim and Heng Citation2016), sequentially. The root mean square error of real measurements and IES-VE simulation was less than 10% (Freewan and Al Dalala Citation2020). Validation studies showed that the IES-VE software is reliable for calculating daylight performance from various daylighting systems such as light pipes, light shelves, and anidolic daylighting systems in tropical areas using daylight ratio and daylight factor.
3.1. Experimental with simulation as a tool
Experimental with IES-VE simulation was employed to study the impact of geometry of building implementing HLP and shading system on daylight performance. The daylight performance of the base case, an office building implementing HLP and shading systems with an aspect ratio of 1:1, was compared with various aspect ratios of office buildings implementing HLP and shading systems. The evaluated daylight performance consisted of average daylight factor (DFav), uniformity daylight factor (UDF), and useful daylight illuminance (UDI).
The simulation employed the weather file of Juanda International Airport and used the radiance parameters, as displayed in .
Table 1. Radiance parameters in IES-VE simulations.
shows the office building configuration that implements HLP and shading systems. The base case was rectangular in the floor plan and had an area of 1.600 m2. The building length and leasing depth span were 40 m and 10 m, respectively, representing a typical office building with medium-depth space (Gero and Fay Citation1998). The floor-to-ceiling height was 2.7 m, based on the office floor-to-floor height consideration of Kohn and Katz (Kohn and Katz Citation2002). The office building had a single zone, a central core area of 400 m2, and an open-plan work area of 1200 m2. The office building was oriented to the north.
Figure 4. Configuration of the base-case office building implementing horizontal light pipe and shading systems.
A typical office building floor was divided into smaller rentable units for different tenants, consistent with previous research on high-rise offices (Lim and Ahmad Citation2013). The smallest office room had an area of 60 m2 and employed 10 workers with a minimum floor area per workstation of 6 m2 (Meel, Martens, and Jan Citation2010). The building core functions as a service and circulation area and was excluded from the daylight performance analysis.
There are three types of office rooms in terms of daylighting access: an office room with a side window, HLP, and shading systems; an office room with two side windows, HLP, and shading systems; and an office room with a side window and shading systems (). The office room with a side window, HLP, and shading systems facing the east or west, whereas the office room with two side windows and shading systems facing the north or south.
The side window in the office building had a window-to-wall ratio of 67%. The window glazing material was clear glass with a visible transmittance (VT) of 0.76. Shading systems consisting of two refective light shelves with 0.6 m in width and partial blinds () were integrated into office buildings as effective internal shading in the tropics (Lim, Hamdan Ahmad, and Remaz Ossen Citation2013). Following previous study results from Lim et al (Lim et al. Citation2012), modifying tinted glazing to clear glass VT 0.75, external shading devices, light shelves, and blinds can significantly increase the daylight quantity and quality in office buildings in the tropics.
Figure 5. The aperture of horizontal light pipe and shading systems.
HLP was integrated into the building with an aperture-oriented east or west, following its best orientation in the tropics (G-Hansen Citation2006). The width, length, and height of HLP were 2 m, 10 m, and 0.7 m, respectively. The aperture of HLP collects sunlight from the building façade () and transfers it through the pipe with a highly specular material on its inner surface. The aperture is equipped with reflectors to redirect the incoming sunlight to minimize inter-reflections within the pipe and to maximize the system efficiency (Canziani, Peron, and Rossi Citation2004; G-Hansen Citation2006). The opening distribution emits daylight through a transparent glass. No daylight is distributed through the HLP at a distance of 0 to 4.5 m from the side window to maximize its efficiency and daylight distribution within the space. The HLPs were placed every 6 m to uniformly illuminate the open-plan office space, in line with previous research by Beltran (Beltran, Lee, and Selkowitz Citation1997).
For the same building, core, and work area, the building aspect ratio varied from 1:1 to 2.1:1 (). The maximum aspect ratio was 2.1:1, considering the maximum lease span for office function without a single tenant group (Sev and Özgen Citation2009) and daylight attenuation by increasing HLP length with a static reflector (Roshan and Salisu Citation2016). Cases AR 1.1:1 to AR 2.1:1 were buildings with an increased aspect ratio along the east-west axis, whereas cases AR 1:1.1 to 1:2.04 were buildings with an increased aspect ratio along the north-south axis ().
Figure 6. Increasing building aspect ratio along specific axis.
Table 2. The configuration of base case and cases.
shows the location of sensor points in the building plan. The height of sensor points is 0.8 m above the floor (work plane) with a grid of 1 m × 1 m. UDI is based on work-plane illuminances (Nabil and Mardaljevic Citation2006) and considers daylight “useful” if all work-plane sensor points are simultaneously within the 100–2000 lx range (Nabil and Mardaljevic Citation2006). The occupancy hours used are 3650 for the period of 8:00–18:00 for the entire year.
Figure 7. Sensor points location in the building plan.
The materials and surface properties of the office room, side window, HLP, and shading systems are summarized in . The impact of the aspect ratio of building implementing HLP and shading system on daylight performance was then analyzed using regression analysis through SPSS software.
Table 3. Materials and surface properties in IES-VE simulation.
3.2. Daylight metrics
Three daylight metrics were evaluated to study the impact of the aspect ratio of buildings implementing HLP and shading systems. The daylight performance analysis included the average daylight factor (DFav), uniformity daylight factor (UDF), and useful daylight illuminance (UDI). DFav was used to evaluate the daylight quantity. Building aspect ratio, one of the building geometry parameters, impacts DF (Reinhart, Mardaljevic, and Rogers Citation2006). In an office building, the evaluation of daylight distribution, which has a strong relationship with visual comfort and describes daylight quality (Galatioto and Beccali Citation2016), is essential. The daylight distribution was assessed by using the uniformity of light. UDI, one of the dynamic daylight performance metrics, was then used to evaluate daylight sufficiency during occupied hours in the year.
The DF (EquationEquation (4)(4)
(4) ) is the ratio between indoor (Ei) and exterior illuminance (Eo) in an unshaded area under CIE standard overcast sky conditions (Reinhart and Weissman Citation2012). The average daylight factor (DFav) is the mean DF at all sensor points placed on the work plane height, 0.8 m above the floor. The recommended DF range for workspaces is 2–5% (British Council for Offices Guide in 6). Rooms with an average DF of less than 2% will look gloomy, and a room with a DF of more than 5% appear very bright (Mcmullan Citation2007).
The uniformity DF (EquationEquation (5)(5)
(5) ) shows the degree of homogeneity in the light distribution (Michael, Gregoriou, and Kalogirou Citation2018). UDF value is determined by dividing the minimum DF value (DF min) by the average DF value for the entire room (DFav). The UDF required for the working environment should be a minimum of 0.4 (BREEAM Citation2023).
Useful Daylight Illuminance (UDI)100-2000 lx is the percentage of occupied hours in the year with daylight illuminance within the range of 100-2000 l× (EquationEquation (6)(6)
(6) ) (Nabil and Mardaljevic Citation2006). UDI is a climate-based daylight analysis based on daylight due to multiple sky conditions in the occupied hours of the year in specific geographical locations (Mangkuto, Siregar, and Handina Citation2018).
where t is the duration of daylight illuminance (E) ranging from 100-2000 l×, and T is the total number of occupied hours in the year.
Daylight illuminances higher than 2000 l× (UDI exceed) tend to produce thermal or visual discomfort, whereas illuminances lower than 100 l× are considered insufficient as the only source of illumination (Boubekri Citation2014). Daylight illuminances in the range of 100-500 l× (UDI supplementary) and 500-2000 l× (UDI autonomous) are considered effective in complementing electric lighting and are sufficient as a main source of illumination, sequentially (Reinhart, Mardaljevic, and Rogers Citation2006). The minimum criteria of UDI100-2000 lx are 50% (Berardi and Anaraki Citation2015; Mangkuto, Rohmah, and Dian Asri Citation2016).
4. Results and discussion
4.1. Daylight performance results and analysis
4.1.1. Average daylight factor analysis
The simulation results showed that all cases had a DFav level of 3.14% to 3.74%. The base case, with a building aspect ratio of 1:1, exhibited the lowest average DF level of 3.14%. Office building AR 1:2.04 had the highest average DF level of 3.74% (). The average DF level of all cases was within the recommended DF range for workspaces of 2–5%.
Figure 8. Average daylight factor of office buildings with various building aspect ratio.
shows the percentage of the DFav improvement in the cases compared to the base case. The results showed that buildings implementing HLP and shading systems with higher aspect ratios had a higher DFav level. A higher building aspect ratio implies that the building perimeter form is extended, allowing daylight to reach most building spaces and increasing the total daylighting area. These results align with previous research (Fang and Cho Citation2019), showing that larger building aspect ratios have a higher daylight performance in a hot climate. Following a previous study (Roshan and Salisu Citation2016), the increase in the building aspect ratio also indicates a reduction in the HLP length in rooms oriented east and west, improving daylight levels within the space.
Figure 9. Percentages of average daylight factor improvement of office buildings with a different aspect ratio.
Increasing the aspect ratio of the building implementing HLP and shading systems along the north-south axis resulted in a more significant improvement in DFav than that along the east-west axis. The percentage of DFav improvement ranged from 5.73% to 18.47% in buildings elongated along the east-west axis and from 7.32% to 19.11% in buildings elongated along the north-south axis. Building AR 1:2.04, which was elongated along the north-south axis, significantly improved the DFav more than building AR 1.96:1, which was elongated along the east-west axis. The improvements in the DFav of buildings AR 1:2.04 and AR 1.96:1 were as high as 19.11% and 17.2%, respectively. With a similar building aspect ratio, building AR 1:2.04 has a higher perimeter area that receives daylight from the east and west and a higher HLP integrated into buildings than building AR 1.96:1.
summarizes the DF comparison between the base case and cases. Office building AR 2.1:1, which had an aspect ratio of 2.1:1, had the highest percentage of sensor points with a DF level of 2–5%, which reached as high as 50.3%. The lowest percentage of sensor points with a DF level of 2–5% was in the base case, which reached 31.34%.
Table 4. Daylight factor comparison between the base case and all cases.
The increase in the building aspect ratio along the east-west axis results in a slightly higher percentage of sensor points with a DF level of 2–5% than along the north-south axis. With a similar building aspect ratio, office building AR 1:2.04, which was elongated along the north-south axis, had a lower percentage of sensor points with a DF level of 2–5% than building AR 1.96:1, which was elongated along the east-west axis. The percentage of sensor points with a DF level of 2–5% for buildings AR 1:2.04 and AR 1.96:1 were 47.9% and 50.1%, respectively. With a similar building aspect ratio, building AR 1:1.96 has a higher perimeter area that receives daylight from the north and south than building AR 1:2.04.
4.1.2. Uniformity daylight factor analysis
shows the UDF values of office buildings with different aspect ratios. The results showed that the base case had a UDF value of 0.36, below the required UDF for the working environment, which should be at least 0.4. Only five buildings had UDF ≥ 0.4, ie, buildings AR 1.8:1, AR 1.96:1, AR 2.1:1, AR 1:1.89, and AR1:2.04.
Figure 10. Uniformity daylight factor of office buildings with different aspect ratio.
Buildings implementing HLP and shading systems with UDF ≥ 0.4 had a high building aspect ratio. A high building aspect ratio results in a higher daylight level (Lee, Boubekri, and Liang Citation2019). The contrast between the daylight level in the area far from the side window and the area near the side window decreased, reducing the visual problem.
Increasing the building aspect ratio along the east-west axis resulted in a more significant improvement in UDF than the north-south axis. The UDF improvement in buildings elongated along the east-west axis was 8.33% to 13.89% for buildings AR 1.4:1 to AR 2.1:1, respectively. The percentages of UDF improvement of buildings elongated along the north-south axis were 2.78% to 11.11% for buildings AR 1:1.47 to AR1:2.04, repectively. The building elongated along the east-west axis has a larger perimeter area that receives daylight from the north and south. Following previous research (Lim and Ahmad Citation2013), diffused illuminance was the primary daylight source for the north and south-facing side windows, resulting in a more uniform daylight distribution.
4.1.3. Useful daylight illuminance analysis
shows the UDI of office buildings extended along the east-west axis. shows the UDI of office buildings elongated along the north-south axis. All office buildings with different aspect ratios had a UDI100-2000 lx in the 83–95% range and were above the minimum criteria of UDI100-2000 lx. These results showed the reliability of HLP and shading systems in maintaining room lighting with UDI100-2000 lx for over 50% of occupied hours in a year. The simulation results also showed that all buildings had no percentages of UDI fell-short (<100 l×) of the working year.
Figure 11. Useful daylight illuminance of office buildings elongated to the east-west axis.
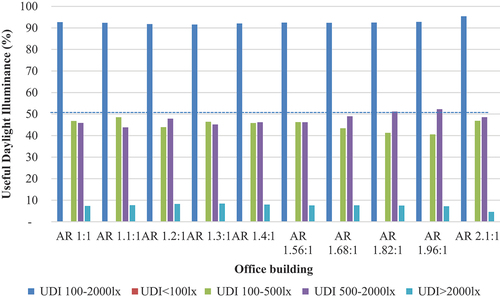
Figure 12. Useful daylight illuminance of office buildings elongated to the north-south axis.
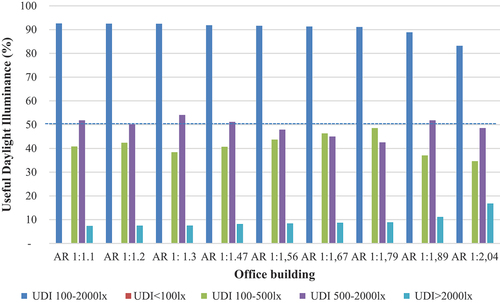
Office building AR 1: 2.04 elongated along the north-south axis had the lowest UDI100-2000 lx value, as high as 83% of the work year. Office building AR 2.1:1 elongated along the east-west axis had the highest UDI100-2000 lx value, which reached up to 95% of the working year. With a similar aspect ratio, office buildings elongated along the east-west axis had a higher UDI100-2000 lx value than those elongated along the north-south axis. The reason is that office building AR 1: 2.04, elongated along the north-south axis, had a larger opening area facing east and west than office building AR 2.1:1, elongated along the east-west axis.
With a similar building aspect ratio, office building AR 1:2.04 elongated along the north-south axis had a higher UDI exceed (>2000 l×) than office building AR 2.1:1 elongated along the east-west axis, as high as 16.8% and 4.6% of the working year, respectively. The office building elongated along the north-south axis had a larger opening area facing east and west than the office building AR 2.1:1, which elongated along the east-west axis.
Office buildings implementing HLP and shading systems had UDI100-500 lx in the range of 35–49% of the working year. At those times, daylight illuminance is considered adequate as the primary source of room illumination or in combination with electric lighting (Nabil and Mardaljevic Citation2006). Office building AR 1:2.04 elongated along the North-South axis had the lowest UDI100-500 lx, which reached up to 35% of the working year. Office building AR 1.1:1 and AR 1:1.79 had the highest UDI100-500 lx, as high as 49% of the work year.
Office buildings implementing HLP and shading systems had UDI autonomous (500-2000 l×) in 43–54% of the working year. These results indicated that daylight illuminance was perceived as desirable or at least tolerable at 43–54% of the occupied hours in a year. Office building AR 1:1.3 had the highest UDI500-2000 lx, which reached up to 54% of the work year. Office building AR 1:1.79 had the lowest UDI500-2000 lx, as high as 43% of the working year.
4.2. The impact of building aspect ratio on daylight performance
The impact of the building aspect ratio on DFav, UDF, and UDI100-2000 lx was analyzed using regression analysis. shows a regression analysis plot of the building aspect ratio and daylight performance. shows the DFav and UDF as a function of the building aspect ratio.
Figure 13. The relationship of building aspect ratio with average daylight factor and uniformity daylight factor.
The regression analysis of the building aspect ratio with the DFav shows that the building aspect ratio strongly influences the DFav, with the coefficient of determination as high as 0.9089 (). A linear relationship between the DFav and building aspect ratio can be obtained, as follows:
With every 0.1 increase in the building aspect ratio, the average DF is expected to increase by a linear difference of 2.82%. This equation is valid only in this case, a building that implements HLP and shading systems.
The analysis also indicated that the building aspect ratio strongly influences the UDF, with a coefficient of determination as high as 0.7973. A linear relationship between the uniformity DF and building aspect ratio can be obtained as follows:
With every 0.1 increase in the building aspect ratio, the uniformity DF is expected to increase by a linear difference of 0.28. This equation is valid only in this case, which is a building that implements HLP and shading systems.
As one may expect, the results indicated that the higher the building aspect ratio, the higher the DFav of the entire building (). The higher the building aspect ratio, the larger perimeter receives daylight. These results align with Lee et al (Lee, Boubekri, and Liang Citation2019). that the longer the building length compared to the building width, the higher the daylight availability. In office buildings with integrated HLP and shading systems, increasing the building aspect ratio from 1:1 to 2.1:1 will increase the average DF of the entire building by 18.47%.
The regression analysis also showed that the higher the aspect ratio of the building integrating HLP and shading systems, the higher the UDF value. Office building with an aspect ratio of 2.1:1 has a higher UDF than office building with an aspect ratio of 1:1. The UDF improvement of office buildings with an aspect ratio of 2.1:1 reached 17.2% compared to office buildings with an aspect ratio of 1:1.
The higher aspect ratio means the building becomes narrower in plan and reduces room depth. The increase in the UDF level as the building aspect ratio increases aligns with previous research by Lee et al (Lee, Boubekri, and Liang Citation2019), that the smaller the room depth, the more daylight intensity enters the room. A higher building aspect ratio results in a higher daylight level (Lee, Boubekri, and Liang Citation2019). The contrast between the daylight level in the area far from the side window and the area near the side window then decreased, resulting in a more uniform daylight distribution, which, in this research, is characterized by an increase in UDF value.
shows the UDI100-2000 lx as a function of the building aspect ratio. The regression analysis for the aspect ratio of the building elongated along the east-west axis () with UDI100-2000 lx shows that the building aspect ratio has a weak influence on the UDI100-2000 lx, with a coefficient of determination of 0.4052 (). A linear relationship between the building aspect ratio and UDI100-2000 lx can be obtained as follows:
Figure 14. The relationship of building aspect ratio elongated along (a) east-west axis and (b) north-south axis with UDI100-2000lx..
With every 0.1 increase in the building aspect ratio, UDI100-2000 lx is expected to increase by a linear difference of 90.01. This equation is valid only in this case, a building that implements HLP and shading systems.
The regression analysis for the aspect ratio of a building elongated along the north-south axis () with UDI100-2000 lx shows that the building aspect ratio moderately influences UDI100-2000 lx, with a coefficient of determination of 0.6373 (). A linear relationship between the building aspect ratio and UDI100-2000 lx is obtained as follows:
With every 0.1 increase in the building aspect ratio, UDI100-2000 lx is expected to decrease by a linear difference of 101.53. This equation is valid only in this case, buildings that implement HLP and shading systems.
Unlike the DF trends, improving the aspect ratio of buildings elongated along the north-south axis decreases the UDI100-2000 lx. The improvement in the aspect ratio of buildings elongated along the north-south axis increases the building area’s side window facing west, which causes an increase in the UDI exceed (>2000 l×) and a decrease in the UDI100-2000 lx. In contrast, improving the aspect ratio of buildings elongated along the east-west axis slightly improves UDI100-2000 lx, caused by the reduction of the building area’s side window facing west.
For daylight to be “useful,” UDI has lower and upper illuminance thresholds of 100lux and 2000lux (Reinhart and Weissman Citation2012). In this research, the UDI100-2000 lx trends are influenced more by the percentages of UDI>2000 lx, where all office buildings had no percentage of occupied hours in the year with daylight illuminance <100 l×. Area with an illuminance level of more than 2000 lx is located on office rooms facing West. In line with previous research (Boubekri and Lee Citation2017), a large portion of illuminance values of more than 2000 lx are excluded from the UDI100-2000 lx calculation and makes the building that has a larger façade area facing sunlight; in this research, the West has a lower UDI.
Using linear regression, the building aspect ratio has a relatively weak and moderate influence on UDI100-2000 lx. UDI100-2000 lx trends are influenced by the percentages of UDI>2000 lx, where daylight illuminances higher than 2000 lx tend to produce thermal or visual discomfort and closely correlate with the Daylight Glare Probability (Boubekri and Lee Citation2017). These results align with previous research using the Annual Glaring Index, which showed that building aspect ratios have a minor impact on glaring using linear regression (Maltais and Gosselin Citation2017).
In this research, the impact of building aspect ratio elongated East-West and North-South axes on UDI100-2000 lx is weak and moderate sequentially. The length of the shading systems in this study changes simultaneously with changes in side window length at different building aspect ratios. Unlike DF and UDF, which took only overcast sky conditions, UDI involves the (hourly) sun and sky conditions from annual climate datasets (Nabil and Mardaljevic Citation2006). Under different sky conditions, the role of light shelves and blinds as shading systems in reducing UDI>2000 lx appeared more, diminishing the impact of building aspect ratio on UDI100-2000 lx, which makes the correlation coefficient relatively low.
Determination of the optimum building aspect ratio involving DFav, UDF, and UDI100-2000 lx showed that the optimum building aspect ratio is AR 2.1:1, which has a narrow plan and is elongated to the East-West axis. The building is 58 m in length and 27.6 m in width. The building has DFav, UDF, and UDI100-2000 lx as high as 3.72 l×; 0.413 and 95% of the working year, sequentially. With a similar building aspect ratio, building AR1:2.04, elongated to the North-South axis, has a lower UDI100-2000 lx, as high as 83% of the working year. Building elongated along the North-South axis is not selected for the optimum building aspect ratio because although it has the highest DFav and UDF of 0.4, it has a lower UDI100-2000 l×. Considering the daylighting design in tropical climates emphasizes controlling solar radiation entering the buildings, building elongated to the East-West axis with a higher UDI100-2000 lx than the North-South axis is selected as the optimum building aspect ratio.
These results can give insight to building designers in designing the aspect ratio of buildings integrating HLP and shading systems for daylight performances in early design stages. Observing various daylight metrics in this research, DF, UDF, and UDI100-2000 lx, is important in the design phase. Observing various daylight metrics in the design phase is essential since they influence the design variables differently.
Consideration of other aspects, such as thermal and energy performances, should be elaborated in future studies. The relationship between building aspect ratio and design variables such as window-to-wall ratio and building orientation should be studied. User perceptions of buildings implementing HLP and shading systems can also be included, considering the importance of users’ psychological aspects.
5. Conclusion
The impact of the aspect ratio of buildings with HLP and shading systems on daylight performance was studied. The results indicated that office buildings integrating HLP and shading systems with an aspect ratio of 1.1:1 to 1:2.04 had an average daylight factor (DFav) in the range of 2–5% and UDI100-2000 lx of 83–95%. Only five office buildings had UDF ≥ 0.4, ie, buildings with an aspect ratio of 1.82:1, 1.96:1, 2.1:1, 1:1.89, and 1:2.04, sequentially.
The results indicated that improving the building aspect ratio increased the average daylight factor and uniformity daylight factor. Increasing the building aspect ratio along the north-south axis improved the DFav more than along the east-west axis. Increasing the building aspect ratio along the north-south axis reduced the UDI100-2000 lx, while increasing the building aspect ratio along the east-west axis improved the UDI100-2000 lx slightly. The optimum building aspect ratio involving DFav, UDF, and UDI100-2000 lx showed that the optimum building aspect ratio is AR 2.1:1, which has a narrow plan and is elongated to the east-west axis.
Future research can involve other design variables, such as building orientation and window-to-floor ratio. Future studies should also focus on the energy and thermal performance of buildings integrating HLP and shading systems. The daylight and energy optimization of buildings implementing HLP and shading systems can also be investigated. Considering the importance of users’ psychological aspects, user perceptions of buildings implementing HLP and shading systems can also be included.
Disclosure statement
No potential conflict of interest was reported by the authors.
Additional information
Funding
Notes on contributors
Feny Elsiana
Feny Elsiana received her master’s degree from the Department of Architecture, Institut Teknologi Sepuluh Nopember, in 2013. She is currently a Ph.D. candidate in the Department of Architecture, Institut Teknologi Sepuluh Nopember. Her research interest lies in daylighting design and technologies in architecture and environmental architecture.
Sri Nastiti N Ekasiwi
Sri Nastiti N Ekasiwi is an associate professor in the Department of Architecture, Institut Teknologi Sepuluh Nopember. She received her PhD from Kyoto University. Her research interest lies in the ventilation design in buildings and building science.
IGN Antaryama
IGN Antaryama is an associate professor at the Department of Architecture, Institut Teknologi Sepuluh Nopember, Indonesia. He received his Ph.D. from the University of Manchester, U.K. His expertise includes environmental architecture, thermal performance of buildings and architectural morphology.
References
- Alrubaih, M. S., M. F. M. Zain, M. A. Alghoul, N. L. N. Ibrahim, M. A. Shameri, and O. Elayeb. 2013. “Research and Development on Aspects of Daylighting Fundamentals.” Renewable and Sustainable Energy Reviews 21:494–505. https://doi.org/10.1016/j.rser.2012.12.057.
- Ander, G. D. 2003. Daylighting Performance and Design. 2nd ed. New Jersey: John Wiley & Sons, Inc.
- Ayoub, M. 2020. “A Review on Light Transport Algorithms and Simulation Tools to Model Daylighting Inside Buildings.” Solar Energy 198 (December 2019): 623–642. https://doi.org/10.1016/j.solener.2020.02.018.
- Beltran, L. O., E. S. Lee, and S. E. Selkowitz. 1997. “Advanced Optical Daylighting Systems: Light Shelves and Light Pipes.” Journal of the Illuminating Engineering Society 26 (2): 91–106. https://doi.org/10.1080/00994480.1997.10748194.
- Beltrán, L. O. & B. M. Mogo. 2007. Development of Optical Light Pipes for Office Spaces. PLEA 2007 - The 24th Conference on Passive and Low Energy Architecture, Singapore, 22-24 November.
- Berardi, U., and H. K. Anaraki. 2015. “Analysis of the Impacts of Light Shelves on the Useful Daylight Illuminance in Office Buildings in Toronto.” Energy Procedia 78:1793–1798. https://doi.org/10.1016/j.egypro.2015.11.310.
- Boubekri, M. 2008. Daylighting, Architecture and Health. Architectural Press. https://doi.org/10.1016/B978-0-7506-6724-1.00025-7.
- Boubekri, M. 2014. Daylighting Design: Planning Strategies and Best Practice Solutions. Basel: Birkhauser Verlag GmbH.
- Boubekri, M., and J. Lee. 2017. “A Comparison of Four Daylighting Metrics in Assessing the Daylighting Performance of Three Shading Systems.” Journal of Green Building 12 (3): 39–53. https://doi.org/10.3992/1943-4618.12.3.39.
- BREEAM. Health and Wellbeing - Hea 01 Visual comfort. Accessed January 3, 2023. https://www.breeam.com/BREEAM2011SchemeDocument/Content/05_health/hea01.htm.
- Brembilla, E., N. C. Drosou, and J. Mardaljevic. 2022. Assessing Daylight Performance in Use : A Comparison Between Long-Term Daylight Measurements and Simulations 111989. Energy & Buildings. Elsevier. https://doi.org/10.1016/j.enbuild.2022.111989.
- Canziani, R., F. Peron, and G. Rossi. 2004. “Daylight and Energy Performances of a New Type of Light Pipe.” Energy and Buildings 36 (11): 1163–1176. https://doi.org/10.1016/j.enbuild.2004.05.001.
- Chen, K. W., P. Janssen, and A. Schlueter. 2018. “Multi-Objective Optimisation of Building Form, Envelope and Cooling System for Improved Building Energy Performance.” Automation in Construction 94 (July): 449–457. https://doi.org/10.1016/j.autcon.2018.07.002.
- Chen, Y., J. Liu, J. Pei, X. Cao, Q. Chen, and Y. Jiang. 2014. “Experimental and Simulation Study on the Performance of Daylighting in an Industrial Building and Its Energy Saving Potential.” Energy and Buildings 73:184–191. https://doi.org/10.1016/j.enbuild.2014.01.030.
- Chi, D. A., D. Moreno, and J. Navarro. 2018. “Correlating Daylight Availability Metric with Lighting, Heating and Cooling Energy Consumptions.” Building & Environment 132 (September 2017): 170–180. https://doi.org/10.1016/j.buildenv.2018.01.048.
- Chirarattananon, S., S. Chedsiri, and L. Renshen. 2000. “Daylighting Through Light Pipes in the Tropics.” Solar Energy 69 (4): 331–341. https://doi.org/10.1016/S0038-092X(00)00081-5.
- Duc Hien, V., and S. Chirarattananon. 2009. “An Experimental Study of a Facade Mounted Light Pipe.” Lighting Research & Technology 41 (2): 123–142. https://doi.org/10.1177/1477153508096167.
- Egan, M. D., and V. W. Olgyay. 2002. Architectural Lighting, Second Ed. New York: McGraw-Hill Higher Education.
- Elsiana, F., S. Nastiti N Ekasiwi, and I. Gusti Ngurah Antaryama. 2021. “Integration of Horizontal Light Pipe and Shading Systems in Office Building in the Tropics.” Journal of Applied Science and Engineering 25 (1): 231–243.
- Elsiana, F., F. Soehartono, and L. Kristanto. 2020. “Daylight Performance of Horizontal Light Pipe with Egg-Crate Reflector in the Tropics.” IOP Conference Series: Earth and Environmental Science 490 (1). https://doi.org/10.1088/1755-1315/490/1/012006.
- Fang, Y., and S. Cho. 2019. “Design Optimization of Building Geometry and Fenestration for Daylighting and Energy Performance.” Solar Energy 191 (July): 7–18. https://doi.org/10.1016/j.solener.2019.08.039.
- Freewan, A. A. Y., and J. A. Al Dalala. 2020. “Assessment of Daylight Performance of Advanced Daylighting Strategies in Large University Classrooms; Case Study Classrooms at JUST.” Alexandria Engineering Journal 59 (2): 791–802. https://doi.org/10.1016/j.aej.2019.12.049.
- Friedrich, L., S. K. Wittkopf, and J. Louis Scartezzini. 2010. “Performance of Anidolic Daylighting Systems in Tropical Climates - Parametric Studies for Identification of Main Influencing Factors.” Solar Energy 84 (7): 1085–1094. https://doi.org/10.1016/j.solener.2010.01.014.
- Galatioto, A., and M. Beccali. 2016. “Aspects and Issues of Daylighting Assessment: A Review Study.” Renewable and Sustainable Energy Reviews. 66:852–860. Elsevier. https://doi.org/10.1016/j.rser.2016.08.018.
- Gero, J. S. D., and S. Fay. 1998. Artificial Intelligence in Design’98. Media: Springer Science+Business. https://doi.org/10.1007/978-94-011-5121-4.
- G-Hansen, V. R. 2006. Innovative Daylighting Systems for Deep-Plan Commercial Buildings. Faculty of Built Environment and Engineering, Queensland University. http://eprints.qut.edu.au/16709/.
- Gomes, M. G., A. J. Santos, and M. Calhau. 2022. “Experimental Study on the Impact of Double Tilted Venetian Blinds on Indoor Daylight Conditions.” Building and Environment 225 (April): 109675. https://doi.org/10.1016/j.buildenv.2022.109675.
- Hansen, G., and I. Edmonds. 2003. “Natural Illumination of Deep-plan Office Buildings: Light Pipe Strategies.” ISES Solar World Congress 2003, Göteborg, Sweden, 14–19 June 2003.
- Hashemi, A. 2014. “Daylighting and Solar Shading Performances of an Innovative Automated Reflective Louvre System.” Energy and Buildings 82:607–620. https://doi.org/10.1016/j.enbuild.2014.07.086.
- Heng, C. Y. S., Y.-W. Lim, and D. Remaz Ossen. 2020. “Horizontal Light Pipe Transporter for Deep Plan High-Rise Office Daylighting in Tropical Climate.” Building & Environment 171 (December 2019): 106645. https://doi.org/10.1016/j.buildenv.2020.106645.
- Inanici, M. N., and F. Nur Demirbilek. 2000. “Thermal Performance Optimization of Building Aspect Ratio and South Window Size in Five Cities Having Different Climatic Characteristics of Turkey.” Building and Environment 35 (1): 41–52. https://doi.org/10.1016/S0360-1323(99)00002-5.
- Jiayu, L., B. Zheng, K. Bernard Bedra, L. Zhe, and X. Chen. 2022. “Effects of Residential Building Height, Density, and Floor Area Ratios on Indoor Thermal Environment in Singapore.” Journal of Environmental Management 313 (March): 114976. https://doi.org/10.1016/j.jenvman.2022.114976.
- Kibert, C. J. 2008. Sustainable Construction: Green Building Design and Delivery. Second Edition. ed. New Jersey: John Wiley&Sons, Inc.
- Kim, M., S. Bok Leigh, T. Kim, and S. Cho. 2015. “A Study on External Shading Devices for Reducing Cooling Loads and Improving Daylighting in Office Buildings.” Journal of Asian Architecture and Building Engineering 14 (3): 687–694. https://doi.org/10.3130/jaabe.14.687.
- Kohn, A. E. D., and P. Katz. 2002. Building Type Basics for Office Buildings. New York: John Wiley & Sons, Inc.
- Konis, K., A. Gamas, and K. Kensek. 2016. “Passive Performance and Building Form: An Optimization Framework for Early-Stage Design Support.” Solar Energy 125:161–179. Elsevier Ltd. https://doi.org/10.1016/j.solener.2015.12.020.
- Kontadakis, A., A. Tsangrassoulis, and L. Doulos. 2018. “A Review of Light Shelf Designs for Daylit Environments.” Sustainability 10 (1): 71. https://doi.org/10.3390/su10010071.
- Kwok, C. M., and T. M. Chung. 2008. “Computer Simulation Study of a Horizontal Light Pipe Integrated with Laser Cut Panels in a Dense Urban Environment.” Lighting Research & Technology 40 (4): 287–305. https://doi.org/10.1177/1477153508094584.
- Lartigue, B., B. Lasternas, and V. Loftness. 2014. “Multi-Objective Optimization of Building Envelope for Energy Consumption and Daylight.” Indoor and Built Environment 23 (1): 70–80. https://doi.org/10.1177/1420326X13480224.
- Lee, J., M. Boubekri, and F. Liang. 2019. “Impact of Building Design Parameters on Daylighting Metrics Using an Analysis, Prediction, and Optimization Approach Based on Statistical Learning Technique.” Sustainability 11:5. https://doi.org/10.3390/su11051474.
- Li, D. H. W., and J. C. Lam. 2003. “An Investigation of Daylighting Performance and Energy Saving in a Daylit Corridor.” Energy and Buildings 35 (4): 365–373. https://doi.org/10.1016/S0378-7788(02)00107-X.
- Li, D. H. W., J. C. Lam, and S. L. Wong. 2005. “Daylighting and Its Effects on Peak Load Determination.” Energy 30 (10): 1817–1831. https://doi.org/10.1016/j.energy.2004.09.009.
- Lim, Y. W., and M. H. Ahmad. 2013. “Daylighting as a Sustainable Approach for High-Rise Office in Tropics.” International Journal of Real Estate Studies 8 (1): 30–42.
- Lim, Y. W., M. Hamdan Ahmad, and D. Remaz Ossen. 2013. “Internal Shading for Efficient Tropical Daylighting in Malaysian Contemporary High-Rise Open Plan Office.” Indoor and Built Environment 22 (6): 932–951. https://doi.org/10.1177/1420326X12463024.
- Lim, Y. W., and C. Y. S. Heng. 2016. “Dynamic Internal Light Shelf for Tropical Daylighting in High-Rise Office Buildings.” Building and Environment 106:155–166. https://doi.org/10.1016/j.buildenv.2016.06.030.
- Lim, Y.-W., M. Zin Kandar, M. Hamdan Ahmad, D. Remaz Ossen, and A. Megat Abdullah. 2012. “Building Façade Design for Daylighting Quality in Typical Government Office Building.” Building and Environment 57:194–204. https://doi.org/10.1016/j.buildenv.2012.04.015.
- Luca, F. D., A. Sepúlveda, and T. Varjas. 2022. “Multi-Performance Optimization of Static Shading Devices for Glare, Daylight, View and Energy Consideration.” Building & Environment 217 (January): 109110. https://doi.org/10.1016/j.buildenv.2022.109110.
- Maltais, L. G., and L. Gosselin. 2017. “Daylighting ‘Energy and Comfort’ Performance in Office Buildings: Sensitivity Analysis, Metamodel and Pareto Front.” Journal of Building Engineering 14 (February): 61–72. https://doi.org/10.1016/j.jobe.2017.09.012.
- Mangkuto, R. A., M. Rohmah, and A. Dian Asri. 2016. “Design Optimisation for Window Size, Orientation, and Wall Reflectance with Regard to Various Daylight Metrics and Lighting Energy Demand: A Case Study of Buildings in the Tropics.” Applied Energy 164:211–219. https://doi.org/10.1016/j.apenergy.2015.11.046.
- Mangkuto, R. A., M. A. A. Siregar, and A. Handina. 2018. “Determination of Appropriate Metrics for Indicating Indoor Daylight Availability and Lighting Energy Demand Using Genetic Algorithm.” Solar Energy 170 (April 2017): 1074–1086. https://doi.org/10.1016/j.solener.2018.06.025.
- Mayhoub, M. S. 2014. “Innovative Daylighting Systems’ Challenges: A Critical Study.” Energy and Buildings 80:394–405. https://doi.org/10.1016/j.enbuild.2014.04.019.
- Mckeen, P., and A. S. Fung. 2014. “The Effect of Building Aspect Ratio on Energy Efficiency.” Buildings 4:336–354. https://doi.org/10.3390/buildings4030336.
- Mcmullan, R. 2007. Environmental Science in Building. Sixth ed. New York: Palgrave Macmillan.
- Meel, J. V., Y. Martens, and V. R. H. Jan. 2010. Planning Office Spaces: A Practical Guide for Managers and Designers. London: Laurence King Publishing.
- Meteorological, Climatological, and Geophysical Agency of Surabaya
- Michael, A., S. Gregoriou, and S. A. Kalogirou. 2018. “Environmental Assessment of an Integrated Adaptive System for the Improvement of Indoor Visual Comfort of Existing Buildings.” Renewable Energy 115:620–633. https://doi.org/10.1016/j.renene.2017.07.079.
- Nabil, A., and J. Mardaljevic. 2006. “Useful Daylight Illuminances: A Replacement for Daylight Factors.” Energy and Buildings 38 (7): 905–913. https://doi.org/10.1016/j.enbuild.2006.03.013.
- Negendahl, K. 2015. “Building Performance Simulation in the Early Design Stage: An Introduction to Integrated Dynamic Models.” Automation in Construction 54:39–53. https://doi.org/10.1016/j.autcon.2015.03.002.
- Obradovic, B., and B. Matusiak. 2021. “A Customised Method for Estimating Light Transmission Efficiency of the Horizontal Light Pipe via a Temporal Parameter with an Example Application Using Laser-Cut Panels as a Collector.” MethodsX 8. Elsevier B.V.:101339. https://doi.org/10.1016/j.mex.2021.101339.
- Rahim, R., and R. Mulyadi. 2004. “Classification of Daylight and Radiation Data into Three Sky Conditions by Cloud Ratio and Sunshine Duration.” Energy and Buildings 36:660–666. https://doi.org/10.1016/j.enbuild.2004.01.012.
- Reffat, R. M., and R. M. Ahmad. 2020. “Determination of Optimal Energy-Efficient Integrated Daylighting Systems into Building Windows.” Solar Energy 209 (July): 258–277. https://doi.org/10.1016/j.solener.2020.08.086.
- Reinhart, C. F., J. Mardaljevic, and Z. Rogers. 2006. “Dynamic Daylight Performance Metrics for Sustainable Building Design.” LEUKOS - Journal of Illuminating Engineering Society of North America 3 (1): 7–31. https://doi.org/10.1582/LEUKOS.2006.03.01.001.
- Reinhart, C. F., and D. A. Weissman. 2012. “The Daylit Area - Correlating Architectural Student Assessments with Current and Emerging Daylight Availability Metrics.” Building and Environment 50:155–164. https://doi.org/10.1016/j.buildenv.2011.10.024.
- Roshan, M., and A. Salisu. 2016. “Assessing Anidolic Daylighting System for Efficient Daylight in Open Plan Office in the Tropics.” Journal of Building Engineering 8:58–69. https://doi.org/10.1016/j.jobe.2016.07.002.
- Sepúlveda, A., F. De Luca, M. Thalfeldt, and J. Kurnitski. 2020. “Analyzing the Fulfillment of Daylight and Overheating Requirements in Residential and Office Buildings in Estonia.” Building and Environment 180 (April): 107036. https://doi.org/10.1016/j.buildenv.2020.107036.
- Sev, A., and A. Özgen. 2009. “Space Efficiency in High-Rise Office Buildings.” METU Journal of the Faculty of Architecture 26 (2): 69–89. https://doi.org/10.4305/METU.JFA.2009.2.4.
- Turan, I., A. Chegut, D. Fink, and C. Reinhart. 2020. “The Value of Daylight in Office Spaces.” Building & Environment 168 (October 2019): 106503. https://doi.org/10.1016/j.buildenv.2019.106503.
- Turan, I., A. Chegut, D. Fink, and C. Reinhart. 2021. “Development of View Potential Metrics and the Financial Impact of Views on Office Rents.” Landscape and Urban Planning 215 (November): Elsevier:104193. https://doi.org/10.1016/J.LANDURBPLAN.2021.104193
- Urbano Gutiérrez, R., J. Du, N. Ferreira, A. Ferrero, and S. Sharples. 2019. “Daylight Control and Performance in Office Buildings Using a Novel Ceramic Louvre System.” Building & Environment 151 (October 2018): 54–74. https://doi.org/10.1016/j.buildenv.2019.01.030.
- Wong, I. L. 2017. “A Review of Daylighting Design and Implementation in Buildings.” Renewable and Sustainable Energy Reviews 74 (March): 959–968. https://doi.org/10.1016/j.rser.2017.03.061.
- Yang, J., Q. Shi, M. Menenti, M. Sing Wong, W. Zhifeng, Q. Zhao, S. Abbas, and X. Yong. 2021. “Observing the Impact of Urban Morphology and Building Geometry on Thermal Environment by High Spatial Resolution Thermal Images.” Urban Climate 39 (July): 100937. https://doi.org/10.1016/j.uclim.2021.100937.
- Zain-Ahmed, A., K. Sopian, Z. Zainol Abidin, and M. Y. H. Othman. 2002. “The Availability of Daylight from Tropical Skies — a Case Study of Malaysia.” Renewable Energy 25 (1): 21–30. https://doi.org/10.1016/S0960-1481(00)00209-3.