
ABSTRACT
This article is about the systematization and representation young children spontaneously use when they are working on a combinatorial task. In this article, documentations from 123 children working on the same task are analysed. The question asked is if there are any connections between the systematizations and representations used in the documentations and how the children solve the task. The results indicate that there are some connections between systematization and representations and that both prepossess children’s solutions. In this paper, we provide some possible reasons; however, we also state that more studies are needed to give deeper insights on these issues.
Introduction
This article is about the systematization and representation 123 six-year-old children spontaneously use when they are solving a (for them) challenging combinatorial task. The task was part of an educational design research study investigating the potential of teaching young children mathematics through problem-solving. Even though problem-solving in mathematics is emphasized in the syllabus in many countries (Lesh and Zawojewski Citation2007) few early childhood education programmes provide mathematical challenging activities (Cross, Woods, and Schweingruber Citation2009; Perry and Dockett Citation2008). This is why we wanted to investigate the potential of teaching young children mathematics through problem-solving. However, the main issue in this article will not be on problem-solving in mathematics but on analysing children’s documentations from one of the problem-solving tasks used in the study. Three questions will be elaborated on the following:
Are there any connections between the systematization of children’s documentations and how they solve the combinatorial task?
Are there any connections between the representations the children use and how they solve the combinatorial task?
Are there any connections between the systematization and representation used by the children?
The article is organized as follows: it starts with a presentation of the context of the study, followed by sections about combinatorics, systematization and representation. After that, the design of the study is presented followed by the analysis of the documentations. Finally, some discussions and conclusions.
The context of the study
The study was conducted in Swedish preschool class which is an optional year of schooling that children aged six can attend the year before formal schooling begins. Even though it is optional almost all Swedish six-year-olds attend preschool class (National Agency for Education Citation2014a). The aim of preschool class is to facilitate a smooth transition between preschool and school and prepare children for the next step of their education. To facilitate a smooth transition, preschool classes are to prepare children for the way of working in school but having their grounding in the traditions of play in preschool. Even though the preschool class was implemented in 1998, a national curriculum for preschool class was implemented first in 2017. Thus, when this study was conducted there were no national regulations regarding what mathematics content or how mathematics should be taught in preschool class. The majority of the preschool class teachers are educated as preschool teachers, but leisure time pedagogues and primary teachers are also working in preschool class (National Agency for Education Citation2014b).
There is a diversity (national and international) in both research and early childhood education regarding how early mathematics should be designed and what constitutes an appropriate content (Palmér and Björklund Citation2016). While some emphasize that the teaching of mathematics should include material, drama or pictures others have shown that such material can make it difficult for children to discern the intended mathematical objects and processes (Björklund Citation2014; Dowker Citation2005). Further, what qualifies as young children differ between countries and in several other countries children are much younger than the children in this study when they start formal schooling. However, the main issue in this article will not be on how, what or at what age children should be taught mathematics, but instead on exploring the systematization and representation young children spontaneously use when they first encounter a combinatorial task.
Young children and combinatorics
The question asked to the children and reported here was: In how many different ways can three toy bears sit on a sofa? The task was, therefore, an enumerative combinatorial task where the children were supposed to count the permutations for n = 3. Already in the late 1960s, Piaget and Inhelder investigated children working on combinatorial tasks. They described their findings in terms of cognitive development of children’s combinatorial and probabilistic thinking. According to them, 2 × 2 or 3 × 3 permutation problems were not suitable for young children (age 7–8) (Piaget and Inhelder Citation1969). However, English (Citation1991, Citation2005) showed that a proper and meaningful context makes it possible for children to work effectively in finding permutations in combinatorial situations. She identified four principles in combinatorics for which children need to develop understanding; the principle of systematic variation, the principle of constancy, the principle of exhaustion and the principle of completion (English Citation1996). The principle of systematic variation meant that a different combination will occur if at least one item is varied systematically while the principle of constancy means that a different combination will occur if at least one item is kept constant while at least one other is varied systematically. The principle of exhaustion means that a constant item is exhausted when it no longer generates new combinations when the other items are varied. Finally, the principle of completion means that when all constant items have been exhausted all possible combinations have been found.
Systematization
In this article, we will analyse systematization, which will imply how the children organize their documentations when solving the combinatorial task. Four such general stages in organizing documentations, including numerical or spatial elements, have been identified: pre-structural stage, emergent stage, partial structural stage and stage of structural development (Mulligan and Mitchelmore Citation2009).
However, the systematization analysed in this article is not general but a goal-directed operation employed to facilitate task performance which includes both problem solution and the acquisition of domain-specific knowledge of combinatory structure (English Citation1996). A variety of graphic representations can be used when solving combinatorics tasks, including lists, diagrams, sketches and tables. All these may be made systematic or not and the major difficulty for young children when solving combinatorial tasks has been shown to be listing items systematically (English Citation2005).
Solving a combinatorial task involves making a suitable mapping of the combinations. In a study from 1991 English identified six strategies used by young children when working with combinatorial tasks: trial-and-error selection of objects – with duplicates; trial-and-error selection of objects – with rejection of duplicates; emerging pattern for the choice of objects – with rejection of duplicates; consistent and complete patterned cyclical item selection – with rejection of duplicates; emerging odometer pattern in item selection with possible item rejection and finally complete odometer pattern. These strategies are hierarchical in that the later are more effective when it comes to finding all possible combinations. In another study from 1996 English further elaborated these strategies naming them as stages; the random stage, the transitional stage and the odometer stage. In the random stage children use trial and error and checking becomes important to succeed with a task. At the transition stage children start to adopt patterns in their documentations but the pattern is not kept all through the task, instead the children revert to the trial-and error approach. This stage indicates knowledge of the principle of systematic variation and the principle of constancy mentioned in the previous section. At the odometer stage the children use an organized structure for the selection of combinations where one item is held constant while the others are varied systematically. This stage indicates knowledge also of the principle of exhaustion and principle of completion mentioned in the previous section.
When analysing children’s documentations in this article we will use English notions of trial and error, transition and odometer combined with children making duplications or not.
Representations
In this article, we will also analyse the graphic representations the children use when solving the combinatorial task. Goldin and Shteingold (Citation2001) use the terms signs, characters and objects to describe representations. These signs ‘stand for (symbolize, depict, encode or represent) something other than itself’ (3). Children’s drawings are a first step towards using representations since they refer to objects, events, ideas and relationships beyond the surface of the drawing (Matthews Citation2006; Piaget and Inhelder Citation1969).
A diversity of words and classifications are used when describing children’s representations. Most previous studies on young children’s representations have been connected to quantity with few studies on young children’s use of representations when solving tasks within other mathematical areas. Symbols and signs are used by Piaget and Inhelder (Citation1969) to describe representations used by children. The difference between these two is that the symbols have some resemblance to the object they refer to. Symbols can be pictures or tally marks, invented by a child without conventions of society. Signs, on the other hand, do not resemble the objects represented but are spoken and written conventions of society, such as digits.
Children’s own representations have been investigated by several researchers. Hughes (Citation1986) focused on children’s marks when representing quantity. He distinguished between idiosyncratic, pictographic, iconic and symbolic representations. Irregular representations, not related to the number of objects represented were defined as idiosyncratic ones. Children’s pictures of the represented item were categorized as pictographic representations. Iconic representations are the ones based on a mark for each item whereas the standard forms like numerals or equal signs were defined as symbolic representations. Later, Carruthers and Worthington (Citation2006) identified similar types of representations by children but added dynamic and written representations in addition to the four representations defined by Hughes.
For Heddens (Citation1986) the connection between the concrete and abstract was of importance. Two levels were defined to describe representations used in between the concrete (objects) and the abstract (signs). At the semi-concrete level, pictures of real items, as a representation of the real situation, were considered. The semi-abstract level concerned a symbolic representation of the concrete items, with a constraint that the symbols would not look like the objects they represented.
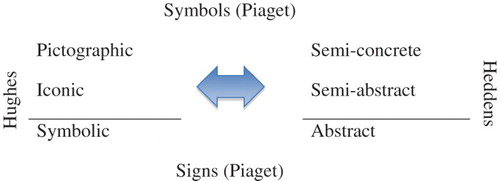
Piaget, Hughes and Heddens all address children’s representations but use different wordings. enlightens the similarities between for instance semi-concrete representations as described by Heddens and the pictographic representations as described by Hughes. Piaget’s term symbol covers Hughes’ pictographic and iconic as well as Heddens’ semi-concrete and semi-abstract. also shows that the symbolic (Heddens) and abstract (Hughes) representations can be compared with Piaget’s signs.
Figure 1. A composition of the various ways Piaget, Hughes and Heddens use to name and categorize representations (van Bommel and Palmér Citation2017).
When analysing children’s documentations in this article we will initially use Hughes (Citation1986) notions of pictographic and iconic representations. Then, when analysing connections between the systematization and representation used by the children, also the level of abstraction (Heddens Citation1986; Piaget and Inhelder Citation1969) will be focused on.
The study
The task presented in this article is part of an educational design research study (Anderson and Shattuck Citation2012) on mathematical problem-solving in preschool class. There are large variations in educational design research studies, both in direction and size, but what is common is the intent to create and study new forms of instruction and to develop theories that ‘guide, inform, and improve both practice and research’ (Anderson and Shattuck Citation2012, 16). Also common in educational design research is the qualitative iterative design and its orientation to be valid for practice (Prediger, Gravemeijer, and Confrey Citation2015).
Ten preschool classes with a total of 123 children were involved in the study. The results in this article are based on analysis of these children’s documentations from one of the problem-solving tasks used in the study. The children were verbally informed about the intervention and the interest of the researchers. The children’s guardians were given written information about the study and approved their children’s participation. In the written information, it was told that participation is voluntary, can be retrieved at any time, and the participants were guaranteed confidentiality. Thus, all requirements for information, approval, confidentiality and appliance advocated by the Swedish Research Council (Citation2011) were followed. In total, only 2 children from the 10 preschools were not part of the study; however, they did participate in the lessons. The only difference was that their documentation was not collected and analysed within the study. In six of these classes, the researchers acted as teachers, whereas the actual preschool class teachers conducted the lessons in the four remaining classes.
The problem-solving task focused on in this article task was carried out with approximately 12–14 children at a time. Three plastic bears were shown to the children when introducing the task, one red, one yellow and one green. The question asked to the children was in how many different ways these toy bears could sit in a sofa. The meaning of different was explored verbally with the children. It was negotiated that different implied a movement of the bears between the three places on the sofa, not sitting behind the sofa or on its backrest, etc. Paper and colour pencils were provided, but the children did not get any instructions on how or what to document. For some time, each child worked individually on the task. When finished their individual documentation the children worked in pairs comparing their documentation to identify differences and similarities. Finally, the documentations were discussed in the whole group with a focus on how the bears had been represented, the visible systematizations and other characteristics of the documentation. Further, a discussion on the different permutations was held, where the six different combinations were displayed in a joint effort, using the plastic bears. After the whole group discussion, the children individually evaluated the difficulty of the task as well as their feelings towards the problem-solving task. This evaluation showed that the majority of the children found the task to be hard but accessible and that they had enjoyed working with it. The documentations that will be analysed in this article are the ones from the children’s individual work on the task.
Analysing the data
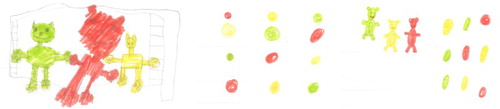
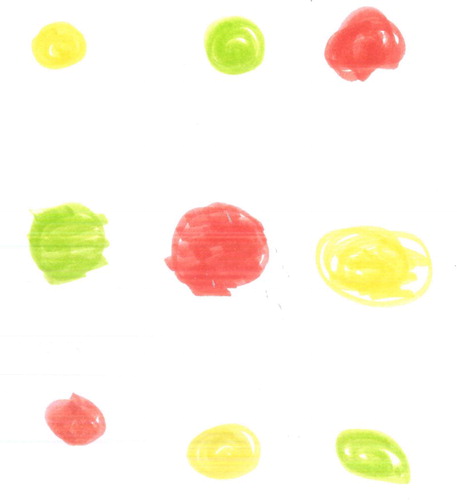
In line with educational design research, the analysis was qualitative with the aim to enable impact and transfer of research into school practice by building theories. The first step in the analysis was to see if there were any differences in children’ documentations that could be connected to the teacher of each lesson but no such patterns could be found. When analysing the documentations, we first used Hughes’ (Citation1986) pictographic and iconic representations. We found it necessary to add a category that included both these representations, as some children had used both types. shows examples of a pictographic and an iconic representation as well as an example of documentation with both representations.
Figure 2. Examples of different representations, the first pictographic, the second iconic and the third both pictographic and iconic.
After this, the documentations were categorized once more based on systematization. Could we see any systematizing when we looked at the permutations in each documentation? Could we, for example, see that one item had been kept invariant, that one item had been varied or did the permutations seemed to occur randomly? Thus, the analysis of systematizing in the documentations was made from an observer perspective and it is possible that children had systematizations not visible to us.
Results and analysis
Nine documentations were not possible to categorize regarding systematization as they included only one permutation or a picture of more than three bears. shows an overview of the categorization of the remaining 114 documentations. Examples of documentations are presented in the analysis.
Table 1. Categorization of documentations based on representation and systematization.
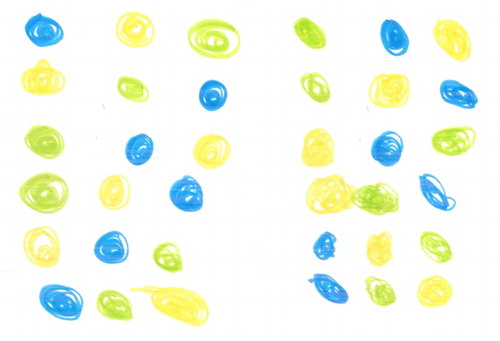
Only four of 114 children found 6 unique permutations when they worked individually with the task. Thus, this was a challenging task for the children. The four children who found six unique permutations used iconic representations; two with a trial-and-error approach (, left) and two with an odometer approach (, right). The two children who used a trial-and-error approach did not indicate knowledge of the principles of exhaustion or completion as the two children who used an odometer approach did (English Citation1996). Instead, the two children who used a trial-and-error approach had to check each of their new permutations with all their previous ones to figure out if each drawn permutation was new or not.
Figure 3. Examples of documentations with six duplications: the left with a trial-and-error approach, the right with an odometer approach where one item is held constant while the others are varied systematically.
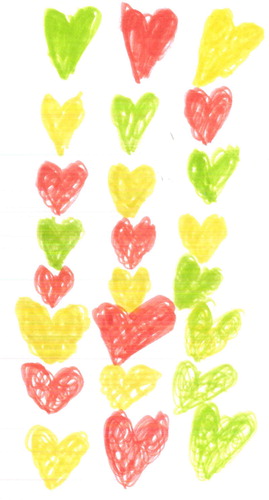
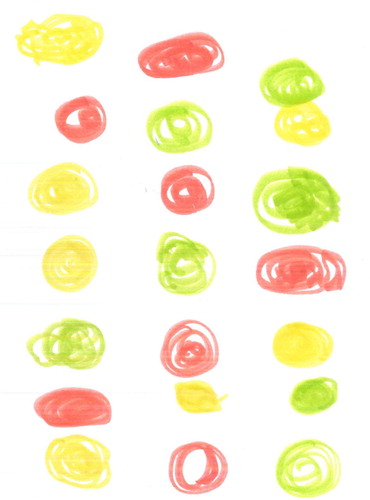
A total of 35 children used pictographic representations and 71 children used iconic representations. Eight children used both pictographic and iconic representations. Both the pictographic and iconic representations used by the children have a resemblance to the objects they represent (Hughes Citation1986). The pictographic representations are drawings of the plastic bears in the three colours. The iconic representations are drawings of different kinds but always in the colours of the toy bears. Most of the children drew dots or lines, but a few also replaced the toy bears with hearts ().
Figure 4. Example of documentation with iconic representation replacing the toy bears with hearts.
Thus, all children used symbols (Piaget and Inhelder Citation1969) in their documentations. The majority of the children (71 of 114) spontaneously used an iconic representation. In studies where children document quantity, the use of symbols (pictographic and iconic representations) is often considered to represent a lower level of development than the use of signs (numerals) (Sinclair, Siegrist, and Sinclair Citation1983). However, in a combinatorial task, it is important to pay attention to each object per se, as well as to the relation between the objects. Therefore, iconic and pictographic representations are appropriate to use when working on combinatorial tasks.
Duplication of permutations was one difficulty noticed in the children’s documentations ().
Figure 5. Example of documentation with duplications.
Of the documentations using a trial-and-error approach or a transition approach, 30 of the iconic documentations, 3 of the combined documentations, and 9 of the pictographic documentations included duplications. However, 19 of the 28 pictographic documentations using a trial-and-error approach or a transition approach consisted of unique combinations. Thus, when using a trial-and-error approach or a transition approach there was less duplication in documentations with pictographic representations (19 out of 28) than with other representations (33 out of 60) (this difference is significant on a 5% level χ² = 3.9979; df = 1; p < .05). According to Heddens (Citation1986), iconic representation is more abstract (semi-abstract) than a pictographic representation (semi-concrete). Thus, one could expect that iconic representation would imply a higher degree of success with the task and not the opposite. Time might be an important factor here. First of all, it takes a considerably longer time to draw a toy bear than to draw an iconic representation. Thus, drawing pictorial representations implies more time to think and might diminish the number of duplications. In fact, none of the documentations with pictographic representation had a solution with more than five permutations. Thus, we could conclude that children using pictographic representations made fewer permutations which, in turn, reduced the risk for duplications.
Drawing iconic representations might also lead to more duplications as the problem is not given time to be internalized, and therefore the problem ‘in how many different ways can three bears sit on a sofa’ may have changed into ‘drawing three coloured dots on a paper’. Drawing toy bears can be experienced as more real, closer to the original problem. Some of the children could be heard saying things like ‘Now it is your turn to sit in the middle’ and ‘He has already been in the middle’. The problem seemed to be internalized and more seldom resulted in duplications. This is in line with Devlin (Citation2000), who states that different solutions to the ‘same’ mathematical task can be related to individual’s perception of the task, depending on the description of the task and what it pertains to.
As mentioned, based on the iconic representation being more abstract than the pictographic representation, one could expect that iconic representation would imply a higher degree of success with the task. And, a transition approach was visible more often in iconic (18 out of 71) than in pictographic (2 out of 35) documentations (this difference is significant on a 5% level:χ² = 5.906; df = 1; p < .05). Further, concerning only the odometer level, there were more iconic (16 out of 26) than combined or pictographic (3, respectively, 7 out of 26) representations. This may indicate some connections between the development of systematization and the use of abstract representation.
All but one documentation in the category ‘odometer – not all solutions’ consisted of exactly three combinations, each bear sitting one time at each place ().
Figure 6. Example of documentation ‘odometer – not all solutions’ with each bear sitting one time at each place.
According to English (Citation1996), repeated selection, as in a systematic combinatorial task, goes against the wording ‘different combinations’. This is especially true for young children who often interpret ‘different’ as different in all aspects. Thus, they do not think that keeping one item constant and changing the others constitutes a ‘different combination’; instead, when each bear has been sitting one time at each place, they think of the problem as solved.
Discussion and conclusions
In this final section we will focus on the three questions raised in the introduction to the article:
Are there any connections between the representations the children use and how they solve the combinatorial task?
Are there any connections between the systematization of children’s documentations and how they solve the combinatorial task?
Are there any connections between the systematization and representation used by the children?
As many as 20 of the 22 children using a transition approach (with or without duplications) and an ‘odometer – all solutions’ approach used iconic representation. There were, however, many children who used pictographic representations on the ‘odometer – not all solutions’ level. This would not be in line with the hypothesis of the development of representations and systematizations as somehow synchronized. However, the ‘odometer – not all solutions’ category was the one where all but one child drew exactly three permutations with each bear sitting one time at each place, which indicates an interpretation of ‘different’ as different in all aspects. Thus, these children may not think that keeping one item constant and changing the others ends up as a ‘different combination’. Such an interpretation was visible in a previous study in other Swedish preschool classes: children were to act physically as cars when figuring out ‘all different combinations’ three cars could park in a garage, and when each car had been at each place once, the children were satisfied with their solution (Palmér and Ebbelind Citation2013).
Finally, what do the results from this study have for possible implications for policy and/or practice? As mentioned, one aim with educational design research is to enable impact and transfer of research into school practice (Anderson and Shattuck Citation2012). The mathematical content in the problem-solving task is fairly unusual in early mathematics and when working with tasks where the mathematical content is new and challenging for the children, communication and reasoning become important elements in the lessons. Even though only four of 114 children found the six unique permutations when they worked individually with the task, all children were engaged in the whole group discussion and the children individually evaluated the task as hard but accessible and they enjoyed working with it. The results support an education based on joint reflections on experiences and documentations from working on tasks instead of an education where children beforehand are taught systematization and which representation to use. Systematization appeared to be the core when analysing children’s documentation and the results indicate that the development of representations and systematizations are somehow related: children using the transition or odometer approach used iconic representations over combined or pictographic representations. Also, systematization seems to be influenced by children’s interpretation of what the task is really about (e.g. a realistic situation with toy bears or ‘drawing three coloured dots on a paper’). To investigate further if iconic representations and systematization are two expressions of a child’s development towards abstract thinking, we have developed a digital version of the task (van Bommel and Palmér Citation2017). This digital version offers semi-concrete pictorial representations together with a systematic way of saving each permutation. Thus it takes into account what seems to have led to success on the part of the study presented here. It remains to be seen, however, if such an experience in any way will influence children’s representation and systematization when working on a combinatorial task.
Disclosure statement
No potential conflict of interest was reported by the authors.
References
- Anderson, T., and J. Shattuck. 2012. “Design-Based Research: A Decade of Progress in Education Research?” Educational Researcher 41 (1): 16–25. doi: 10.3102/0013189X11428813
- Björklund, C. 2014. “Less Is More – Mathematical Manipulatives in Early Childhood Education.” Early Child Development and Care 184 (3): 469–485. doi: 10.1080/03004430.2013.799154
- Carruthers, E., and M. Worthington. 2006. Children’s Mathematics. Making Marks, Making Meaning. 2nd ed.London: Sage.
- Cross, C. T., T. A. Woods, and H. Schweingruber. 2009. Mathematics Learning in Early Childhood. Paths Toward Excellence and Equity. Washington, DC: The National Academies Press.
- Devlin, K. 2000. The Math Gene: How Mathematical Thinking Evolved and Why Numbers Are Like Gossip. New York: Basic Books.
- Dowker, A. 2005. Individual Differences in Arithmetic. Implications for Psychology, Neuroscience and Education. New York: Psychology Press.
- English, L. D. 1991. “Young Children’s Combinatoric Strategies.” Educational Studies in Mathematics 22 (5): 451–474. doi: 10.1007/BF00367908
- English, L. D. 1996. “Children’s Construction of Knowledge in Solving Novel Isomorphic Problems in Concrete and Written Form.” Journal of Mathematical Behavior 15: 81–112. doi: 10.1016/S0732-3123(96)90042-5
- English, L. D. 2005. “Combinatorics and the Development of Children’s Combinatorial Reasoning.” In Exploring Probability in School: Challenges for Teaching and Learning, edited by G. A. Jones, 121–141. New York: Springer.
- Goldin, G., and N. Shteingold. 2001. “Systems of Representations and the Development of Mathematical Concepts.” In The Roles of Representation in School Mathematics: Yearbook, edited by A. A. Cuoco and F. R. Curcio, 1–23. Reston, VA: National Council of Teachers of Mathematics.
- Heddens, J. W. 1986. “Bridging the Gap Between the Concrete and the Abstract.” The Arithmetic Teacher 33 (6): 14–17.
- Hughes, M. 1986. Children and Number: Difficulties in Learning Mathematics. Oxford: Blackwell.
- Lesh, R., and J. Zawojewski. 2007. “Problem Solving and Modeling.” In Second Handbook of Research on Mathematics Teaching and Learning, edited by I. F. K. Lester (Red.), 763–799. Charlotte: National Council of Teachers of Mathematics & Information Age.
- Matthews, J. 2006. “Foreword.” In Children’s Mathematics: Making Marks, Making Meaning, 2nd ed., edited by E. Carruthers and M. Worthington. London: Sage.
- Mulligan, J., and M. Mitchelmore. 2009. “Awareness of Pattern and Structure in Early Mathematical Development.” Mathematics Education Research Journal 21 (2): 33–49. doi: 10.1007/BF03217544
- National Agency for Education. 2014a. Descriptive Data 2013 Pre-School, School and Adult Education. Report 399.
- National Agency for Education. 2014b. Preschool Class: Assignment, Content and Quality. Stockholm: Swedish National Agency for Education.
- Palmér, H., and C. Björklund. 2016. “Different Perspectives on Possible – Desirable – Plausible Mathematics Learning in Preschool.” Nordic Studies in Mathematics Education 21 (4): 177–191.
- Palmér, H., and A. Ebbelind. 2013. “What Is Possible to Learn? Using IPads in Teaching Mathematics in Preschool.” In Proceedings of the 37th Conference of the International Group for the Psychology of Mathematics Education. Mathematics Learning Across the Life Span, edited by A. M. Lindmeier and A. Heinze, 425–432. Kiel: PME.
- Palmér, H., and van Bommel, J. (2017). Exploring the Role of Representations When Young Children Solve a Combinatorial Task. In ICT in Mathematics Education: The Future and the Realities: Proceedings of MADIF 10 The Tenth Research Seminar of the Swedish Society for Research in Mathematics Education, edited by J. Häggström, E. Norén, J. van Bommel, J. Sayers, O. Helenius, and Y. Liljekvist, January 26–27, 2016. Karlstad: Svensk förening för MatematikDidaktisk Forskning – SMDF.
- Perry, B., and S. Dockett. 2008. “Young Children’s Access to Powerful Mathematical Ideas.” In Handbook of International Research in Mathematics Education, edited by I. L. D. English, M. B. Bussi, G. A. Jones, R. A. Lesh, B. Sriraman, and D. Tirosh (Red.), 75–108. London: Routhledge.
- Piaget, J., and B. Inhelder. 1969. The Psychology of the Child. New York: Basic Books.
- Prediger, S., K. Gravemeijer, and J. Confrey. 2015. “Design Research with a Focus on Learning Processes: An Overview on Achievements and Challenges.” ZDM Mathematics Education 47: 877–891. doi: 10.1007/s11858-015-0722-3
- Sinclair, A., F. Siegrist, and H. Sinclair. 1983. “Young Children’s Ideas About the Written Number System.” In The Acquisition of Symbolic Skills, edited by D. R. Rogers and J. A. Sloboda, 535–542. New York: Plenum Press.
- Swedish Research Council. 2011. God Forskningssed [Good Custom in Research].Stockholm: Vetenskapsrådet.
- van Bommel, J., and H. Palmér. 2017. “ Slow Down You Move Too Fast.” Poster presented at CERME10, Dublin, Ireland.