ABSTRACT
Mental health problems are highly prevalent in primary care. Validated tools to detect mental disorders in general practice are needed. The Four-Dimensional Symptom Questionnaire (4DSQ) was designed to help GPs differentiating between psychological distress and psychopathological conditions (depression, anxiety, somatization). The aim of the current study was to examine psychometric properties of the 4DSQ in a mental health setting. Reliability, factorial, construct, and criterion validity of the English translation of the 4DSQ were analyzed in an American sample of 159 patients attending a psychotherapy outpatient clinic. Measurement equivalence across languages was determined by analyzing differential item functioning (DIF) and differential test functioning (DTF) in the American sample and a Dutch mental health sample, matched by age and sex. A confirmatory factor analysis confirmed all 4DSQ subscales to be unidimensional. All 4DSQ subscales revealed excellent reliability (Cronbach’s alpha and McDonald omega ≥.90) and high correlations with a symptom distress subscale of an instrument that is commonly used to monitor psychotherapy progress, the Outcome Questionnaire-45. Eight items were flagged with DIF. The Depression subscale was free of DIF. DTF analyses showed an impact of DIF on scale level for the lower cutoff score of the Distress scale. The 4DSQ Distress score was the best predictor of a mood disorder diagnosis and the Anxiety score outperformed other 4DSQ scales to predict an anxiety disorder. In conclusion, the 4DSQ demonstrates excellent reliability and validity in a mental health setting. Further research is needed to determine reliable cutoff values on 4DSQ subscales to predict psychiatric diagnoses.
Introduction
Mental health problems are common in the primary care setting. The World Health Organization estimates that 24% of patients seen by general practitioners (GPs) have a mental disorder (Uestuen & Sartorius, Citation1995). Most common conditions seem to be major depressive disorder, anxiety disorders, somatic symptom disorders and alcohol abuse/dependence (Ansseau et al., Citation2004; Roca et al., Citation2009). Evidence shows that mental disorders are under-recognized in primary care. For example, depression is estimated to be correctly detected by GPs in 47% of true cases (Mitchell et al., Citation2009). Different types of anxiety disorders are diagnosed correctly only in 33% to 64% of affected patients (Weiller et al., Citation1998).
Consequently, tools that help GPs to recognize mental health problems are very important. The Four-Dimensional Symptom Questionnaire (4DSQ) is an instrument that is especially designed for this purpose. Its 50 items are assigned to four subscales that help GPs to distinguish between psychosocial distress and psychopathological conditions (Terluin et al., Citation2008). Whereas the distress dimension addresses less complicated, stress-related disorders, the remaining three dimensions are supposed to capture symptoms of psychiatric diagnoses. The 4DSQ Depression subscale measures depressive cognitions, suicidal thoughts, and anhedonia symptoms. The Anxiety subscale captures symptoms of different kinds of anxiety disorders (e.g. free-floating anxiety, panic attacks, phobic anxieties, avoidance behaviors). The Somatization subscale lists physical symptoms that are indicative of somatic symptom disorders or illness anxiety disorder.
Psychometric properties of the 4DSQ have been validated in different, mostly clinical settings. The four-dimensional structure of this instrument has been proven in primary care settings (e.g. Terluin et al., Citation2006) or in a working population (e.g. Terluin et al., Citation2004). The factorial structure of the 4DSQ was also tested but could not be completely replicated in a general population sample (Terluin et al., Citation2016). The Depression scale proved to be unidimensional. The other scales however were best represented as bifactor models. Evidence of construct validity was provided by showing that the 4DSQ subscales are associated with measures of job strain and stress, coping behavior (Terluin et al., Citation2004), other symptom scales assessing depression, anxiety, or somatization, or with measures of social functioning, stress, and personality traits (Terluin et al., Citation2006). Measurement equivalence of the 4DSQ could be demonstrated only in some specific clinical settings. For example, differential item functioning (DIF) analyses showed that the 4DSQ measures the same variables in orthopedic shoulder patients compared to primary care patients (Koorevaar et al., Citation2016). However, pregnant or postpartum women responded differently to items of three 4DSQ subscales compared to women in general practices (Tebbe et al., Citation2016). Internal consistency of the 4DSQ subdimensions has passed the critical Cronbach’s alpha of 0.70 across different samples (e.g. Terluin et al., Citation2004).
The 4DSQ was translated into different languages, such as Polish, French, German, English, or Turkish. DIF analyses showed measurement equivalence between most of these translated versions of the 4DSQ and the original Dutch questionnaire (Chambe et al., Citation2015; Czachowski et al., Citation2012; Exner et al., Citation2018; Terluin, Smits et al., Citation2014).
In previous research, the 4DSQ and its subscales was repeatedly investigated as screening tool to predict psychosocial outcomes, such as work absence in working population (Den Boeft, Twisk, Terluin et al., Citation2016; Roelen et al., Citation2014; Terluin et al., Citation2011; Van Hoffen et al., Citation2015), disability (Den Boeft, Twisk, Hoekstra et al., Citation2016; Van der Leeuw et al., Citation2015) or health-care utilization in primary care patients (Den Boeft, Twisk, Terluin et al., Citation2016). The 4DSQ and its subscale scores were demonstrated to accurately detect mental disorders in primary care settings, in particular, major depression, different kinds of anxiety disorders or somatoform disorders (Langerak et al., Citation2012; Terluin, Oosterbaan et al., Citation2014; Terluin et al., Citation2006; De Vroege et al., Citation2015).
In summary, the psychometric properties of the 4DSQ have been extensively examined in primary care settings. Previous research confirms the 4DSQ as a reliable and valid assessment tool for GPs to detect mental health problems in their patients. However, only one study has investigated the 4DSQ in a mental health setting so far (Terluin & Verbraak, Citation2014). Terluin and Verbraak (Citation2014) showed that the 4DSQ measures the same constructs in patients in a mental health-care setting compared to primary care patients. The central aim of the current study is to examine further aspects of the psychometric quality of the 4DSQ in patients utilizing mental health care. We chose the English translation of the 4DSQ because of its applicability across all English-language countries and because it has been evaluated only in one study (Terluin, Smits et al., Citation2014) so far. We wanted to explore if the dimensional structure of the 4DSQ scales can be replicated in a mental health setting. We assumed that the 4DSQ shows appropriate levels of internal consistency (above the critical value of alpha = .70) in individuals using mental health-care services. We examined measurement equivalence between the English translation and the original Dutch version of the 4DSQ in patients who attend mental health services. Convergent and discriminant validity was investigated by correlations between the 4DSQ subscale scores and a measure commonly applied in therapy progress monitoring (Outcome Questionaire-45, OQ-45; Lambert et al., Citation2013). We assumed that the 4DSQ subscale scores are highly correlated with the OQ-45 Symptom Distress scale, but only moderately correlated with the other OQ-45 subscale scores. We investigated the criterion validity of the 4DSQ Depression and Anxiety scale to detect clinical routine diagnoses of a mood and an anxiety disorder, respectively.
Methods
Study design and participants
The English-language sample (US sample) consisted of 159 adult patients (age: ≥18 years) attending the Brigham Young University (BYU) Comprehensive Clinic at (Provo, Utah, USA), an outpatient clinic that offers psychological interventions and counseling services to individuals, couples, and families in Utah County between 2014 and 2016. The study was introduced to each consecutive patient during the clinical intake interview and written informed consent was gained from those patients who agreed to participate. Measures were provided at the first therapy session.
The Dutch reference data were selected from the CentERdata LISS panel (LISS: Longitudinal Internet Study in the Social Sciences), a web-based register providing a representative sample of Dutch-speaking persons living in the Netherlands (Scherpenzeel, Citation2011). The panel contains people from about 5,000 households randomly chosen from all registered Dutch residents. Persons without internet access were provided with all necessary equipment especially developed for elderly people having no experience with computers. Monthly, registered individuals are asked to complete online questionnaires on various topics. Participants are remunerated with 7.50 Euro (8.00 USD) per 30 minutes of completing questionnaires. In the context of another study, Terluin, Marchand, De Vet, and Brouwers (Citation2015) presented the 4DSQ in July 2013 to all persons registered aged 16 and older. To ensure comparability to the English sample, only Dutch participants aged at least 18 years and who had at least one appointment with a psychiatrist, psychologist, or psychotherapist during the past year (N = 343) were considered.
For every American participant, one Dutch participant was randomly chosen under consideration of matching both samples for gender and age (5-year groups). This matching procedure should avoid confounding effects of between-group differences in demographic variables on detected DIF.
Measures
Items of the Four-Dimensional Symptom Questionnaire (4DSQ) are answered on a 5-point Likert scale reaching from ‘no’ to ‘very often or constantly’ that is transformed to a 3-point scale (no = 0, sometimes = 1, remaining categories = 2). Two validated cutoff points per scale define normal, moderate and severe values (Distress: ≥11 and ≥21, Depression: ≥3 and ≥6, Anxiety: ≥4 and ≥10, Somatization: ≥11 and ≥21) (Terluin, Oosterbaan et al., Citation2014; Terluin et al., Citation2008). In this study, we used the original Dutch version (Terluin et al., Citation2009) and the English translation of the 4DSQ (Terluin, Smits et al., Citation2014) (freely available for non-commercial use at http://www.emgo.nl/researchtools/4dsq.asp).
The Outcome Questionnaire 45 (OQ-45) is a 45-item, self-report measure that is supposed to be repeatedly administered throughout the course and at the termination of a psychological treatment with adult patients (Lambert et al., Citation2013). Each item is answered on a 5-point Likert scale (0 = almost always, 4 = never). The OQ-45 captures three domains of patients’ functioning: symptom distress (particularly anxiety and depression), interpersonal problems, and social role functioning. The OQ-45 has been proven to be a psychometrically sound instrument, with strong internal consistency (Lambert et al., Citation2013).
Statistical analyses
For initial analyses, we used the response function (RF) method (Van Ginkel & Van Der Ark, Citation2005) for imputing missing item scores. Group differences in gender and age were compared using Chi-square test and t-test, respectively. The Mann–Whitney U test was used for testing differences in mean scores of each 4DSQ scale across language groups.
As a measure of reliability ordinal Cronbach’s alpha (Cronbach, Citation1951) and McDonald’s omega (McDonald, Citation1999), both with its 95% CI were calculated. Ordinal Cronbach’s alpha and McDonald omega were calculated, using R-package ‘userfriendlyscience’.
We evaluated the dimensional structure of the 4DSQ scales by confirmatory factor analysis (CFA) across the American and the Dutch samples using the ‘lavaan’ package as implemented in R (Rosseel, Citation2012). For each scale, a one-factor model was fitted allowing correlations between residual variances sharing specific content. Item scores were treated as ordered categories to account for their ordinal character. Comparative fit index (CFI) >0.95, Tucker–Lewis index (TLI) >0.95, and root-mean-square error of approximation (RMSEA) <0.06 were used as indicators of adequate model fit (Hu & Bentler, Citation1999). In case a model did not converge, we used the R package mctest (Imdad & Aslam, Citation2018; Imdadullah et al., Citation2016) applying Klein’s rule (Klein, Citation1962) to check for multicollinearity between items.
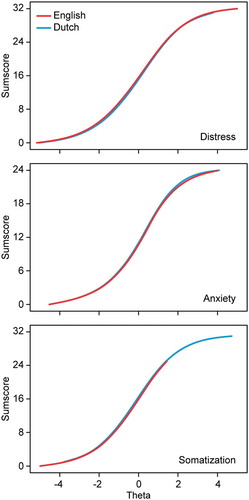
To determine measurement equivalence, we used a two-stage method for DIF testing to examine differential item functioning (DIF) (Hambleton, Citation2006): the non-parametric Mantel–Haenszel (M-H) method, detecting primarily uniform DIF (Teresi, Citation2006), and the parametric hybrid ordinal logistic regression (HOLR), detecting uniform as well as non-uniform DIF (Teresi, Citation2006). jMetrik 3.1.2 software package (Meyer, Citation2014) was used to run the M-H method and the R package ‘lordif’ to do the HOLR (Choi et al., Citation2011). DIF was identified when the absolute standardized mean item difference was >0.1 and p was <0.001 (M-H method) or when the increase in explained variance (ΔR2) was >2% and p was <0.001 (HOLR method) (Choi et al., Citation2011). We applied Rasch analysis, as implemented in jMetrik 3.1.2 (Meyer, Citation2014), to examine differential test functioning (DTF), i.e. the impact of DIF on scale level. Theta scores (estimated scores of the DIF-free underlying latent trait of each scale) were calculated for each group. Raw sum scores (containing items with and without DIF) for each scale were plotted against DIF-free theta values. The impact of DIF on the scale scores was defined as the vertical distance between group specific curves at the cutoff points. Details of our statistical analysis are provided in the supplementary Appendix A.
Convergent and discriminant validity are analyzed by using Pearson product–moment correlations between the 4DSQ and OQ-45 subscale scores. According to Cohen (Citation1992), correlation coefficients ≥.10 indicate low, ≥.30 a medium, and ≥.50 a large association. Additionally, we performed linear, multivariate regression analyses for each OQ-45 subscale as dependent variable and the 4DSQ subscale scores as independent variables to partial out incremental variance of the dependent variable explained by each 4DSQ subscale. Correlational and regression analyses were conducted using IBM SPSS Statistics 25.
To examine criterion validity, we compared the 4DSQ Depression and Anxiety scores with DSM-IV diagnoses of mood or anxiety disorders (American Psychiatric Association, Citation2000) provided as part of the clinical routine by the patient’s therapist. Differences in 4DSQ scores between the diagnostic groups (e.g. major depression vs. no major depression) were examined using one-way ANOVA. To investigate differences in the 4DSQ subscale’s performance in detecting a psychiatric diagnosis, we calculated ROC curves. Differences in areas under the ROC-curve (AUCs) and their 95% CI are reported. Overlapping 95% CI indicate no differences between the AUCs of the 4DSQ subscales. We determined the optimal threshold point on a ROC with determining the minimum distance d between the point (0,1) and the ROC (d = √[(1 – sn)2 + (1 – sp)2] with sn = sensitivity and sp = specificity). We performed also logistic regression analysis with the psychiatric diagnosis as dependent variable and 4DSQ scores as independent variables to determine incremental variance of the 4DSQ subscales. We obtained a parsimonious model by stepwise backward elimination of non-significant predictors (p > 0.05). All analyses related to criterion validity were performed with IBM SPSS Statistics 25.
Results
Descriptive statistics and reliability
In the Dutch sample (N = 159), no missing value was identified. In the US sample (N = 159) all participants completed the 4DSQ. The entire OQ-45 is missing in nine American participants. In the US sample 0.31% of the 4DSQ single item scores were imputed and 0.25% of the OQ-45 item scores.
Demographic variables, mean item scores, Cronbach’s alpha, and McDonald omega values of the 4DSQ subscales are summarized in (). The Dutch sample showed significantly increased values on the 4DSQ Somatization scale. The range of Cronbach’s alpha for the subscales indicated high reliability in both samples as did McDonald omega.
Table 1. Demographic variables, mean 4DSQ scores, and reliability (Cronbach’s alpha and McDonald’s omega) of the US sample (N = 159) and the Dutch sample (N = 159)
Factorial validity
The multi-group CFA confirmed unidimensionality for all four subscales of the 4DSQ (). The optimization of the model fit was performed by incrementally removing restrictions of residual covariances for item pairs with the related content (see ). The CFA for the Anxiety subscale first resulted in a non-converging model. Further testing of this subscale showed collinearity between item 18 and item 21 in the American sample. Removing either item (in turn) from the model resulted in two converging models with 11 items. () presents the fit indices suggesting adequately fitting unidimensional models for all subscales. For the Anxiety subscale the means of the fit indices of both converging models are presented.
Table 2. Goodness of fit indices of the multi-group CFA for one-factor models fitted to the data of each scale depending on residual correlations allowed
Measurement equivalence
Differential item functioning
There were eight items flagged with DIF, four by the M-H method, all eight by the HOLR (). Items 6, 15, 22, and 24 were detected by both methods. The Distress scale contained one, the Anxiety scale four, and the Somatization scale three DIF items, while the Depression scale was free of DIF. Seven items were identified with (mainly) uniform, one with (mainly) non-uniform DIF. An analysis of the item response functions of the uniform DIF items shows that for the US participants three items were easier to reply (and indicated less severity) and four items were more difficult to reply (or indicated more severity) compared to the Dutch sample (see ).
Table 3. Items identified with significant differential item functioning (DIF)
Differential test functioning
(and graphs in the supplementary Appendix B) showed the impact of DIF on scale level for both validated cutoff points. An underlying latent trait was estimated for each scale score and for both groups separately. All absolute differences, except for the first cutoff point of the Distress scale showed to be less than .05 and are therefore negligible. The Dutch cutoff value of 11.00 of the Distress scale corresponded to a value of 11.57 in the US sample.
Table 4. Differences in cutoff points according to differential test functioning (DTF)
Convergent and discriminant validity
A large positive correlation (r> .78) was found between the 4DSQ Distress score and the OQ-45 Symptom Distress subscale. Large correlation coefficients (.56 ≥ r≥ .66) were also found between 4DSQ Depression/Anxiety/Somatization subscales and OQ-45 Symptom Distress subscale. Between the 4DSQ subscale scores and OQ-45 Interpersonal Relationship score (.35 ≥ r≥ .52) as well as the OQ-45 Social Role score (.36 ≥ r≥ .55) mainly moderate correlations were observed. The regression analyses showed that the 4DSQ Distress score, compared to the other 4DSQ subscores, explained incremental variance of the OQ-45 subscales at most. Results of the correlational and regression analyses are summarized in .
Table 5. Pearson product–moment correlation coefficients and beta coefficients (linear multivariate regression analysis) indicating relationships between 4DSQ and OQ-45 total score and subscale scores (n = 150)
Criterion validity
In the US sample 79 participants (49.7%) did not receive a diagnosis of a mental disorder, 18 (11.3%) were diagnosed with an DSM-IV anxiety disorder (anxiety disorder not otherwise specified: n = 7, generalized anxiety disorder: n = 8, posttraumatic stress disorder: n = 1, adjustment disorder with anxiety: n = 1, obsessive-compulsive disorder: n = 1), 18 (11.3%) with a DSM-IV mood disorder (major depressive disorder: n = 16, dysthymic disorder: n = 2) and 44 (27.7%) with another mental disorder.
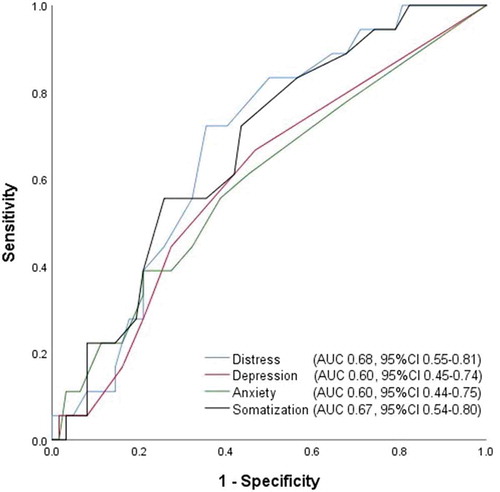
Participants with mood disorders significantly differed from participants with other mental disorders (including anxiety disorders) only in their Distress scores (). ROC analyses of the prediction of a mood disorder revealed no differences in AUCs between the 4DSQ subscale scores. However, ROC curves indicated a significant AUC only for the Distress score (.679, p= 0.022) and Somatization score (.671, p= 0.028) (). The Distress score, using a cutoff of ≥13.5, had a sensitivity of .722 and a specificity of .645 of detecting a mood disorder. The Somatization score, using a cutoff of ≥9.5, had a sensitivity of .556 and a specificity .742 of detecting mood disorder. The final model of the regression analysis identified the Distress score as contributing most to the prediction of a mood disorder ().
Table 6. Differences in 4DSQ between patients diagnosed with a depressive disorder or anxiety disorder and another mental health condition
Table 7. Logistic regression analysis with mood disorder or anxiety disorder as dependent variable and 4DSQ scores as independent variables (n = 60)
Figure 1. Receiver operating characteristic (ROC) curves of 4DSQ scales with respect to detecting a mood disorder diagnosis in an outpatient psychotherapy sample (n = 60). AUC=area under the curve, 95%CI=95% confidence interval
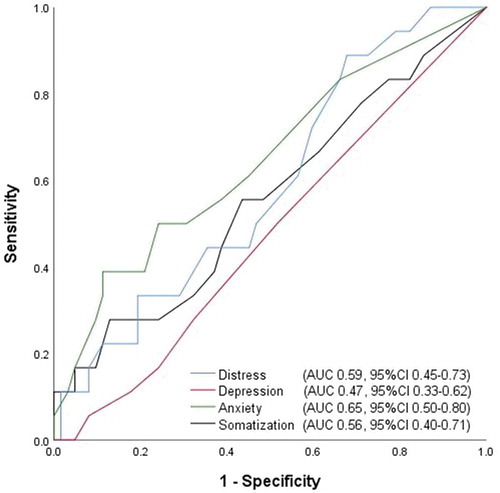
Participants with a diagnosed anxiety disorder differed from participants with other mental health conditions (including mood disorders) only on the Anxiety score (). ROC analyses with the diagnosis of an anxiety disorder as dependent variable revealed no differences between the AUCs of the 4DSQ subscales. The largest AUC was gained for the Anxiety score (.647), however, slightly failed to become significant (p = 0.059) (). The Anxiety score, using a cutoff of ≥4.50, had a sensitivity of .500 and a specificity of .758 of detecting an anxiety disorder. The final model of the regression analysis identified the Anxiety score to contribute most to the prediction of an anxiety disorder (see ).
Figure 2. Receiver operating characteristic (ROC) curves of 4DSQ scales with respect to detecting an anxiety disorder diagnosis in an outpatient psychotherapy sample (n = 60). AUC=area under the curve, 95%CI=95% confidence interval
Discussion
The aim of this study was to evaluate psychometric properties of the 4DSQ in a mental health setting. First, we demonstrated high levels of reliability of the 4DSQ subscales in an American as well as a Dutch sample of individuals who were in a psychotherapeutic or psychiatric treatment over the past year. Our reliability values are comparable to those that were found in settings other than mental health services (Czachowski et al., Citation2012; Langerak et al., Citation2012; Terluin et al., Citation2016; Terluin, Smits et al., Citation2014; Terluin et al., Citation2004).
Second, in accordance with previous studies, we demonstrated unidimensionality of all subscales of the 4DSQ (Chambe et al., Citation2015; Terluin et al., Citation2006, Citation2004). The item pairs with related content for which we removed restrictions of residual covariances overlapped substantially with item pairs for which residual covariances had to be allowed in previous studies of different translations of the 4DSQ, for example, the French (Chambe et al., Citation2015) and the Canadian translation of the 4DSQ (Terluin, Smits et al., Citation2014).
Third, differential item functioning (DIF) was detected in 8 out of 50 items. A previous evaluation of the English translation of the 4DSQ revealed seven items with DIF (Terluin, Smits et al., Citation2014) that overlap with only two of our DIF items: item 22 (lack of energy) and 27 (frightened). Although both studies included native English speakers, participants came from different countries (North America versus Canada) and were recruited in different treatment settings (mental health-care population versus family practice sample). DTF analyses showed an effect of DIF on scale level for the first cutoff score of the Distress subscale of the 4DSQ. The Dutch Distress cutoff value of 11.00 corresponded to an US value of 11.57. Differences in the setting between the American sample (frequent psychotherapy sessions at outpatient clinic) and Dutch sample (minimum of one mental health service appointment within the past years) should be considered to interpret the results of the DTF analyses. Mean values confirm slightly increased Distress scores in the US compared to the Dutch sample.
Fourth, according to our hypotheses, the 4DSQ subscale scores correlated most with and explained most of the variance of a symptom distress subscale of a measure that is commonly used to monitor psychological symptoms (OQ-42). In a previous study that was conducted in different primary care settings the 4DSQ Distress score, compared to the other 4DSQ subscales, also explained most of the variance in general distress scales (Terluin et al., Citation2006).
Fifth, in the current study, the 4DSQ Distress score was the strongest predictor of a diagnosed mood disorder whereas the Depression score was a relatively weak predictor. Depression items in the 4DSQ focus on thoughts of hopelessness and suicidal ideas. They are intended to and have been demonstrated to be superior to identify moderate-severe MDD (Terluin et al., Citation2009). In the contrary, the Distress subscale covers a broader spectrum of criteria of a mood disorder that are defined in DSM-IV, encompassing depressive mood complaints and depressive disorder. Geraghty et al. (Citation2015) demonstrated that the 4DSQ Distress subscale corresponds highly to the conceptualization of depression according to other common measures of depression, such as the Hospital Anxiety and Depression Scale or the Patient Health Questionnaire-9. The US patients who attended frequently an outpatient psychotherapy had lower mean values on the Depression scale but higher Distress scores compared to the Dutch sample. A cutoff score of ≥13.5 on the Distress subscale with acceptable sensitivity and specificity values was identified. The 4DSQ Somatization subscale was the second best predictor of a mood disorder in the current study. Other previous studies showed strong relationships between the 4DSQ Somatization subscale and depressive disorders (Bekhuis et al., Citation2016, Citation2015; Dijkstra-Kersten et al., Citation2017).
In accordance with results of previous studies (e.g. Terluin et al., Citation2006), we demonstrated that the Anxiety score outperforms other 4DSQ scales in predicting an anxiety disorder. We identified a substantially lower cutoff of ≥4.50 compared to a study by Terluin et al. (Citation2006). However, the sensitivity of this cutoff score (=.500) gained in our study was not acceptable. Cutoff scores to predict anxiety disorders seem to vary substantially between different types of anxiety disorders (Terluin et al., Citation2009). In general, 4DSQ cutoff scores to predict psychiatric diagnoses seem to vary substantially between studies (e.g. Langerak et al., Citation2012; Terluin et al., Citation2009, Citation2006). These deviations could be caused by differences in the study settings. For example in a previous study, clinical interviews were done by trained lay interviewers with no expertise in psychiatry or psychology (Terluin et al., Citation2009). Diagnoses were made for study purposes only. In the current study trained clinical psychologists diagnosed patients, however, as part of their clinical routine.
Several limitations of the current study have to be considered. First, the representativeness of the Dutch sample as mental health sample is critical and its comparability with the American sample is limited. The Dutch sample was recruited from households nationwide in the Netherlands and participants who were included in the current analyses needed a minimum of one appointment with a mental health professional over the past year. On the contrary, the American sample included patients from an outpatient psychotherapy clinic. These differences between the samples could explain DIF. Second, it is critical to generalize the results gained from our American sample to other psychotherapy clinic patients. Only 50% of our participants were diagnosed with a mental disorder. Many patients attend services of the BYU Comprehensive Clinic for reasons other than a psychiatric diagnosis. Relationship problems, for example, are a common reason for referral. Moreover we have to consider a general problem of routine diagnoses given in a clinical compared to a research setting. Clinical diagnoses serve a clinical goal, reflecting the main focus of clinical action, but they do not necessarily list all disorders present, as standardized diagnostic procedures do. Each participant received only one diagnosis. This is in contradiction with the notorious but ubiquitous phenomenon of comorbidity. It means that probably several participants were not recorded having disorders when another diagnosis took precedence. This also means that, when comparing for example mood disorder patients to patients without a recorded disorder, an unknown proportion of persons in the comparison group can be assumed to have a mood disorder thereby attenuating the contrast between both groups. This might explain the relatively low AUC values in the ROC analyses. Finally, the ROC analyses of the criterion validity would require a bigger sample size.
In conclusion, we showed that the 4DSQ demonstrates high psychometric quality in a mental health setting, in terms of reliability and construct validity. The dimensional structure of the 4DSQ that was demonstrated in primary care settings could be replicated in patients attending mental health-care services. Further research is needed with larger samples to determine reliable cutoff values to predict psychiatric diagnoses.
Acknowledgments
In this paper, we make use of data of the LISS (Longitudinal Internet Studies for the Social sciences) panel administered by CentERdata (Tilburg University, The Netherlands).
Disclosure statement
BT is the copyright owner of the 4DSQ and receives copyright fees from companies that use the 4DSQ on a commercial basis (the 4DSQ is freely available for noncommercial use in health care and research). BT received fees from various institutions for workshops on the application of the 4DSQ in primary care settings. The other authors reported no potential conflict of interest.
Additional information
Funding
References
- American Psychiatric Association. (2000). Diagnostic and statistical manual for mental disorders. Fourth edition, text revision. American Psychiatric Press.
- Ansseau, M., Dierick, M., Buntinkx, F., Cnockaert, P., De Smedt, J., Van Den Haute, M., & Vander Mijnsbrugge, D. (2004). High prevalence of mental disorders in primary care. Journal of Affective Disorders, 78(1), 49–55. https://doi.org/10.1016/S0165-0327(02)00219-7
- Bekhuis, E., Boschloo, L., Rosmalen, J. G., de Boer, M. K., & Schoevers, R. A. (2016). The impact of somatic symptoms on the course of major depressive disorder. Journal of Affective Disorders, 205, 112–118. https://doi.org/10.1016/j.jad.2016.06.030
- Bekhuis, E., Boschloo, L., Rosmalen, J. G., & Schoevers, R. A. (2015). Differential associations of specific depressive and anxiety disorders with somatic symptoms. Journal of Psychosomatic Research, 78(2), 116–122. https://doi.org/10.1016/j.jpsychores.2014.11.007
- Bond, T., & Fox, C.M.(2015). Applying the Rasch model: Fundamental measurement in the human sciences London, UK: Routledge.
- Chambe, J., Le Reste, J. Y., Maisonneuve, H., Sanselme, A. E., Oho-Mpondo, J., Nabbe, P., & Terluin, B. (2015). Evaluating the validity of the French version of the Four-Dimensional Symptom Questionnaire with differential item functioning analysis. Family Practice, 32(4), 474–479. https://doi.org/10.1093/fampra/cmv025
- Choi, S. W., Gibbons, L. E., & Crane, P. K. (2011). lordif: An R package for detecting differential item functioning using iterative hybrid ordinal logistic regression/item response theory and Monte Carlo simulations. Journal of Statistical Software, 39(8), 1–30. https://doi.org/10.18637/jss.v039.i08
- Cohen, J. (1992). A power primer. Psychological Bulletin, 112(1), 155–159. https://doi.org/10.1037/0033-2909.112.1.155
- Crane, P.K., Gibbons, L.E., Jolley, L., & Belle, G.V.(2006). Differential item functioning analysis with ordinal logistic regression techniques. Medical Care, 44(11 Suppl.3), pp. 115–123. doi:10.1097/01.mlr.0000245183.28384.ed
- Cronbach, L. J. (1951). Coefficient alpha and the internal structure of tests. Psychometrika, 16(3), 297–334. https://doi.org/10.1007/BF02310555
- Czachowski, S., Terluin, B., Izdebski, A., & Izdebski, P. (2012). Evaluating the cross-cultural validity of the Polish version of the Four-Dimensional Symptom Questionnaire (4DSQ) using differential item functioning (DIF) analysis. Family Practice, 29(5), 609–615. https://doi.org/10.1093/fampra/cms016
- de Vroege, L., Emons, W. H., Sijtsma, K., Hoedeman, R., & van der Feltz-cornelis, C. M. (2015). Validation of the 4DSQ somatization subscale in the occupational health care setting as a screener. Journal of Occupational Rehabilitation, 25(1), 105–115. https://doi.org/10.1007/s10926-014-9529-2
- den Boeft, M., Twisk, J. W., Hoekstra, T., Terluin, B., Penninx, B. W., van der Wouden, J. C., … van der Horst, H. E. (2016). Medically unexplained physical symptoms and work functioning over 2 years: Their association and the influence of depressive and anxiety disorders and job characteristics. BMC Family Practice, 17(1), 46. https://doi.org/10.1186/s12875-016-0443-x
- den Boeft, M., Twisk, J. W., Terluin, B., Penninx, B. W., van Marwijk, H. W., Numans, M. E., … van der Horst, H. E. (2016). The association between medically unexplained physical symptoms and health care use over two years and the influence of depressive and anxiety disorders and personality traits: A longitudinal study. BMC Health Services Research, 16(1), 100. https://doi.org/10.1186/s12913-016-1332-7
- Dijkstra-Kersten, S. M. A., Sitnikova, K., Terluin, B., Penninx, B., Twisk, J. W. R., van Marwijk, H. W. J., … van der Wouden, J. C. (2017). Longitudinal associations of multiple physical symptoms with recurrence of depressive and anxiety disorders. Journal of Psychosomatic Research, 97, 96–101. https://doi.org/10.1016/j.jpsychores.2017.04.015
- Dorans, N.J., Schmitt, A. P., & Bleistein, C.A. (1992). The standardization approach to assessing comprehensive differential item functioning. Journal of Educational Measurement, 29(4), pp. 309–319. doi:10.1111/j.1745–3984.1992.tb00379.x
- Exner, A., Kleinstäuber, M., Maier, W., Fuchs, A., Petersen, J. J., Schäfer, I., … Terluin, B. (2018). Cross-cultural validation of the Four-Dimensional Symptom Questionnaire (4DSQ) in multimorbid elderly people. [Brief Communication]. Quality of Life Research, 27(10), 2691–2697. https://doi.org/10.1007/s11136-018-1924-2
- Geraghty, A. W., Stuart, B., Terluin, B., Kendrick, T., Little, P., & Moore, M. (2015). Distinguishing between emotional distress and psychiatric disorder in primary care attenders: A cross sectional study of the four-dimensional symptom questionnaire (4DSQ). Journal of Affective Disorders, 184, 198–204. https://doi.org/10.1016/j.jad.2015.05.064
- Hambleton, R. K. (2006). Good practices for identifying differential item functioning. Medical Care, 44(11), 182–188. https://doi.org/10.1097/01.mlr.0000245443.86671.c4
- Holland, P.W., & Thayer, D.T.(1988). Differential item performance and the Mantel-Haenszel procedure. In H.Wainer & H.Brown (Eds.), Test validity (pp. 129–145). Hillsdale, NJ: Lawrence Erlbaum Associates Publishers.
- Hu, L.-t., & Bentler, P. M. (1999). Cutoff criteria for fit indexes in covariance structure analysis: Conventional criteria versus new alternatives. Structural Equation Modeling: A Multidisciplinary Journal, 6(1), 1–55. https://doi.org/10.1080/10705519909540118
- Imdad, M. U., & Aslam, M. (2018). mctest: Multicollinearity Diagnostic Measures. R package version 1.2. Retrieved from https://CRAN.R-project.org/package=mctest,
- Imdadullah, M., Aslam, M., & Altaf, S. (2016). mctest: An R Package for detection of collinearity among regressors. The R Journal, 8 (2), 499–509. Retrieved from. https://journal.r-project.org/archive/2016/RJ-2016-062/index.html.
- Klein, L. R. (1962). An introduction to econometrics. Prentice-Hall.
- Koorevaar, R. C., Terluin, B., van ‘T Riet, E., Madden, K., & Bulstra, S. K. (2016). Validation of the four-dimensional symptom questionnaire (4DSQ) and prevalence of psychological symptoms in orthopedic shoulder patients. Journal of Orthopaedic Research, 34(4), 683–691. https://doi.org/10.1002/jor.23051
- Kristjansson, E.(2005). Acomparison of four methods for detecting differential item functioning in ordered response items. Educational and Psychological Measurement, 65(6), pp. 935–953. doi:10.1177/0013164405275668
- Lambert, M. J., Kahler, M., Harmon, C., Burlingame, G. M., Shimokawa, K., & White, M. M. (2013). Administration and scoring manual: Outcome Questionnaire OQ®-45.2. OQMeasures.
- Langerak, W., Langeland, W., van Balkom, A., Draisma, S., Terluin, B., & Draijer, N. (2012). A validation study of the Four-Dimensional Symptom Questionnaire (4DSQ) in insurance medicine. Work-a Journal of Prevention Assessment & Rehabilitation, 43(3), 369–380. https://doi.org/10.3233/WOR-2012-1393
- McDonald, R. P. (1999). Test theory: A unified treatment. awrence Erlbaum Associates.
- Meyer, J. P. (2014). Applied measurement with jMetrik London, UK: Routledge.
- Michaelides, M.P.(2008). An illustration of aMantel-Haenszel procedure to flag misbehaving common items in test equating. Practical Assessment, Research & Evaluation, 13(7), pp. 1–16.
- Mitchell, A. J., Vaze, A., & Rao, S. (2009). Clinical diagnosis of depression in primary care: A meta-analysis. Lancet, 374(9690), 609–619. https://doi.org/10.1016/S0140-6736(09)60879-5
- Roca, M., Gili, M., Garcia-Garcia, M., Salva, J., Vives, M., Garcia Campayo, J., & Comas, A. (2009). Prevalence and comorbidity of common mental disorders in primary care. Journal of Affective Disorders, 119(1–3), 52–58. https://doi.org/10.1016/j.jad.2009.03.014
- Roelen, C. A., Hoedeman, R., van Rhenen, W., Groothoff, J. W., van der Klink, J. J., & Bultmann, U. (2014). Mental health symptoms as prognostic risk markers of all-cause and psychiatric sickness absence in office workers. European Journal of Public Health, 24(1), 101–105. https://doi.org/10.1093/eurpub/ckt034
- Rosseel, Y. (2012). lavaan: An R package for structural equation modeling. Journal of Statistical Software, 48(2), 1–36. https://doi.org/10.18637/jss.v048.i02
- Scherpenzeel, A. (2011). Data collection in a probability-based Internet panel: How the LISS Panel was built and how it can be used. Bulletin de Méthodologie Sociologique, 109(1), 56–61. https://doi.org/10.1177/0759106310387713
- Swaminathan, H., & Rogers, H.J.(1990). Detecting differential item functioning using logistic regression procedures. Journal of Educational Measurement, 27(4), pp. 361–370. doi:10.1111/j.1745–3984.1990.tb00754.x
- Tebbe, B. B., Terluin, B., & van Poppel, M. N. (2016). Measuring maternal mental health using the Dutch Four-Dimensional Symptom Questionnaire (4DSQ): Pregnancy-related item bias across the perinatal period. Midwifery, 40, 192–199. https://doi.org/10.1016/j.midw.2016.06.017
- Teresi, J. A. (2006). Different approaches to differential item functioning in health applications: Advantages, disadvantages and some neglected topics. Medical Care, 44(11Suppl. 3), 152–170. https://doi.org/10.2307/41219515
- Terluin, B., Brouwers, E. P., van Marwijk, H. W., Verhaak, P., & van der Horst, H. E. (2009). Detecting depressive and anxiety disorders in distressed patients in primary care; comparative diagnostic accuracy of the Four-Dimensional Symptom Questionnaire (4DSQ) and the Hospital Anxiety and Depression Scale (HADS). BMC Family Practice, 10(1), 58. https://doi.org/10.1186/1471-2296-10-58
- Terluin, B., Marchand, M., de Vet, H., & Brouwers, E. (2015). Impact of verb tense on response to the Four-Dimensional Symptom Questionnaire. European Journal of Psychological Assessment, 31(3), 202–210. https://doi.org/10.1027/1015-5759/a000226
- Terluin, B., Oosterbaan, D. B., Brouwers, E. P., van Straten, A., van de Ven, P. M., Langerak, W., & van Marwijk, H. W. (2014). To what extent does the anxiety scale of the Four-Dimensional Symptom Questionnaire (4DSQ) detect specific types of anxiety disorder in primary care? A psychometric study. BMC Psychiatry, 14(1), 121. https://doi.org/10.1186/1471-244X-14-121
- Terluin, B., Smits, N., Brouwers, E. P., & de Vet, H. C. (2016). The Four-Dimensional Symptom Questionnaire (4DSQ) in the general population: Scale structure, reliability, measurement invariance and normative data: A cross-sectional survey. Health and Quality of Life Outcomes, 14(1), 130. https://doi.org/10.1186/s12955-016-0533-4
- Terluin, B., Smits, N., & Miedema, B. (2014). The English version of the four-dimensional symptom questionnaire (4DSQ) measures the same as the original Dutch questionnaire: A validation study. European Journal of General Practice, 20(4), 320–326. https://doi.org/10.3109/13814788.2014.905826
- Terluin, B., Terluin, M., Prince, K., & Van Marwijk, H. W. J. (2008). The Four-Dimensional Symptom Questionnaire (4DSQ) detects psychological problems (English translation) [De Vierdimensionale Klachtenlijst (4DKL) spoort psychische problemen op]. Huisarts Wet, 51(5), 251–255. https://doi.org/10.1007/BF03086756
- Terluin, B., van Marwijk, H. W. J., Ader, H. J., de Vet, H. C. W., Penninx, B. W. J. H., Hermens, M. L. M., … Stalman, W. A. B. (2006). The Four-Dimensional Symptom Questionnaire (4DSQ): A validation study of a multidimensional self-report questionnaire to assess distress, depression, anxiety and somatization. BMC Psychiatry, 6, 34. https://doi.org/10.1186/1471-244x-6-34
- Terluin, B., van Rhenen, W., Anema, J. R., & Taris, T. W. (2011). Psychological symptoms and subsequent sickness absence. International Archives of Occupational and Environmental Health, 84(7), 825–837. https://doi.org/10.1007/s00420-011-0637-4
- Terluin, B., Van Rhenen, W., Schaufeli, W. B., & De Haan, M. (2004). The Four-Dimensional Symptom Questionnaire (4DSQ): Measuring distress and other mental health problems in a working population. Work and Stress, 18(3), 187–207. https://doi.org/10.1080/0267837042000297535
- Terluin, B., & Verbraak, M. (2014). Validity of the Four-Dimensional Symptom Questionnaire (4DSQ) in outpatient mental health care [Validiteit van de Vierdimensionale Klachtenlijst (4DKL) in de ambulante geestelijke gezondheidszorg]. Tijdschrift Klinische Psychologie, 44(3), 198–211.
- Uestuen, T. B., & Sartorius, N. (1995). Mental illness in general health care. John Wiley and Sons.
- van der Leeuw, G., Gerrits, M. J., Terluin, B., Numans, M. E., van der Feltz-cornelis, C. M., van der Horst, H. E., … van Marwijk, H. W. (2015). The association between somatization and disability in primary care patients. Journal of Psychosomatic Research, 79(2), 117–122. https://doi.org/10.1016/j.jpsychores.2015.03.001
- Van Ginkel, J. R., & Van Der Ark, L. A. (2005). SPSS syntax for missing value imputation in test and questionnaire data. Applied Psychological Measurement,29(2), 152–153.https://doi.org/10.1177/0146621603260688
- van Hoffen, M. F., Joling, C. I., Heymans, M. W., Twisk, J. W., & Roelen, C. A. (2015). Mental health symptoms identify workers at risk of long-term sickness absence due to mental disorders: Prospective cohort study with 2-year follow-up. BMC Public Health, 15(1), 1235. https://doi.org/10.1186/s12889-015-2580-x
- Weiller, E., Bisserbe, J. C., Maier, W., & Lecrubier, Y. (1998). Prevalence and recognition of anxiety syndromes in five European primary care settings. A report from the WHO study on Psychological Problems in General Health Care. British Journal of Psychiatry Supplement, 173 (34), 18–23. Retrieved from. https://www.ncbi.nlm.nih.gov/pubmed/9829012
- Zumbo, B.D., & Wild, W.R.(1999). AHandbook on the theory and methods of differential item functioning (DIF) Ottawa, ON: National Defense Headquarters.
Appendix A.
Details about statistical analyses
Differential item functioning. There are various methods analyzing differential item functioning, without one of them being globally superior over the others. Hambleton (Citation2006) recommended the use of multiple methodologically different two-stage methods for DIF testing. Two-stage testing is based on the calculation of a group specific matching variable. Items holding DIF are detected by analyzing differences in this variable and iteratively removed from the matching variable in a process of purification. Afterward, the analysis is repeated for each DIF item using the unbiased matching variable.
Another classification of algorithms detecting DIF is based on their ability to discover different types of DIF, mainly distinguishing between uniform and non-uniform DIF. Uniform DIF represents a higher global probability of endorsing an item for one language group compared to the other and leads to a different item difficulty. Regarding regression analysis, uniform DIF is present if the item score is not solely predicted by the latent trait, but also by group membership. In contrast, nonuniform DIF is present, if there is a group difference in the probability of endorsing an item only for certain levels of the latent trait or, in the worst case, the direction of this difference varies for specific levels of the latent trait. In a regression model, an interaction between group membership and latent trait significantly affecting the item score would indicate nonuniform DIF.
All these considerations led to the selection of the nonparametric Mantel–Haenszel (M-H) method, detecting mainly uniform DIF (e.g. Kristjansson, 2005; Teresi, Citation2006), and the parametric hybrid ordinal logistic regression (HOLR), detecting uniform as well as nonuniform DIF (Teresi, Citation2006).
The M-H method uses a matching variable defined as the sum score of all items belonging to a scale. For every level of this variable, mean item scores of the Dutch and the German sample are compared, resulting in an effect size (ES) represented by a standardized mean difference (SMD) in item score between the groups (Holland and Thayer, 1988; Michaelides, 2008). A statistical significance, with p < 0.001 because of multiple testing, and an ES of 5% of the item score range, leading to a critical SMD of 0.1 (Dorans, Schmitt, & Bleistein, 1992), were defined as criteria for DIF. The method iteratively purified the matching variable from DIF by identifying the item with the most severe DIF, removing it from the matching variable and recalculating DIF for all items by using the purified variable. This process is performed until no further items are flagged with DIF. Item response functions were plotted separately for Dutch and German patients to identify the direction of DIF. The M-H method was used as implemented in the jMetrik 3.1.2 software package (Meyer, Citation2014).
Logistic regression as a model-based approach, first applied to DIF analysis by Swaminathan and Rogers (1990), calculates DIF by comparing three different regression models (Choi et al., Citation2011; Crane, Gibbons, Jolley, & Belle, 2006; Zumbo and Wild, 1999). The characteristic of the hybrid regression is the use of a theta score, an estimated true latent trait of the corresponding scale, as a matching variable. The three models vary in the predictors used. The first model utilizes only the matching variable as a predictor, model 2 adds the predictor group membership, and the last model uses the matching variable, group membership, and additionally the interaction between matching variable and group membership. As previously described, in the absence of DIF the item response is predicted by the latent trait only. If group membership causes a significant improvement of the regression model, uniform DIF is present. A significant interaction between matching variable and group membership indicates the presence of nonuniform DIF. If DIF is detected, the matching variable is purified by calculating group-specific item parameters for the DIF laden items. This process is repeated until no further DIF items are detected. The analysis was performed by using the R package ‘lordif’ (Choi et al., Citation2011). Presence of DIF (uniform and non-uniform) was identified by a significant increase (p < 0.001) of the explained variance (ΔR2) by a minimum of 2% (Choi et al., Citation2011).
Differential test functioning. The presence of DIF alone, even though it might be significant in various items, does not indicate a different functioning of the corresponding scale. To examine the presence of DTF, the impact of DIF on scale scores needs to be analyzed. Using Rasch analysis as implemented in jMetrik 3.1.2 (Meyer, Citation2014), theta scores (estimated scores of the underlying latent trait of each scale) were calculated for each group. It builds an item response theory (IRT) model for the items of each scale by using DIF-free items for both groups and DIF-laden items for each group separately (Bond and Fox, 2015). Raw sum scores (containing items with and without DIF) for each scale were plotted against theta values. The impact of DIF on the scale scores was defined as the vertical distance between group-specific curves. Cutoff points are most important for clinical decision-making. Thus, theta values for each Dutch cutoff point were identified. Corresponding German scale scores holding an equal latent trait were calculated via linear interpolation between adjacent points.
Appendix B.
Impact of DIF on scale scores. For each scale, an estimation of the underlying latent trait calculated by Rasch analysis is plotted against the raw sum score (calculated from DIF free and DIF laden items).