
ABSTRACT
Hot cracking during laser welding of advanced high-strength steels is reported to be a serious problem by automotive manufacturers. In this work, hot cracking susceptibilities of transformation-induced plasticity (TRIP) and dual-phase (DP) steels are studied based on a multi-scale modelling approach. Transient temperatures measured from welding experiments are used to validate a finite element (FE) model. The temperature, thermal gradient and cooling rate in the weld fusion zone are extracted from the FE model and pre-defined as boundary conditions to a phase field model. The welding-induced microstructural evolution is simulated considering thermodynamic and mobility data. Results show that, compared to the DP steel, the TRIP steel has a broader solidification range, a greater pressure drop at the inter-dendritic regions, and an increased phosphorus segregation at the grain boundaries; all these make this steel more susceptible for hot cracking.
Introduction
Advanced high-strength steels (AHSS) have been used increasingly in the automotive industry over the past 10 years. Compared with conventional steels, AHSS can reduce the weight of a car using high-strength thinner gauge steel sheet, and this, in turn, reduces the fuel consumption [Citation1,Citation2]. Transformation-induced plasticity (TRIP) and dual-phase (DP) steels belong to the category of AHSS providing high-strength and formability/ductility [Citation3]. Both TRIP and DP steels comprise multi-phase microstructures, which are produced by alloying and specific processing routes. However, increases in alloying content can render these steels susceptible to hot cracking [Citation4]. Hot cracking during laser welding at the edges of steel flanges is frequently reported by the automotive manufactures [Citation5].
Hot cracking during weld solidification is a dynamic process covering multi-physics at different timescales and length scales [Citation6], which makes modelling of hot cracking phenomena very challenging. Finite element (FE) models are widely used to simulate welding processes including the physics of heat transfer and solid mechanics. Temperature and strain evolution in and near the weld fusion zone can be obtained. On a macroscale level, Prokhorov and Shirshov [Citation7], Clyne et al. [Citation8] and Won et al. [Citation9] proposed hot cracking criteria during solidification based on a critical strain and/or strain rate. On a microscale level, Rappaz et al. [Citation10] and Kou [Citation11] derived hot cracking criteria during solidification including microstructural effects. A mass balance was evaluated over the liquid and solid phases, which accounts for the tensile deformation of the solid skeleton perpendicular to the growing dendrites and for induced inter-dendritic liquid feeding. A phase field model, coupling a thermodynamic and kinematic data, can be used to simulate the microstructural evolution in the weld fusion zone. However, multi-scale models, which are able to bridge the length scales and can comprehensively explain the occurrence of hot cracking, are rarely reported. Wang et al. [Citation12] presented a study on the mechanism of solidification crack formation on a macroscale and microscale. However, the microstructural analysis is still continuum based without considering the phase evolution and element diffusion.
In this study, TRIP and DP steels were laser-welded with the same heat input and under the same constraining conditions. A multi-scale modelling approach was used to couple the features of the marco-welding process with microstructural evolution. An FE model was constructed to simulate the thermal field during welding. The predicted transient temperature was compared and validated with measured data. The transient temperature profiles in the weld fusion zone were extracted and applied as boundary conditions to a phase field model. The phase evolution and elemental partitioning of the TRIP and DP steels during weld solidification were obtained. The pressure drop at the inter-dendritic regions during solidification is evaluated and discussed. Element concentration at the grain boundary was also examined. The multi-scale models applied in this study provide an enhanced understanding of hot cracking in TRIP and DP steels during weld solidification.
Materials and properties
Two types of AHSS, a TRIP and a DP steel, were examined. The chemical compositions of these two steels are given in Table .
Table 1. Chemical compositions of TRIP and DP steels (in wt-%, with Fe balance).
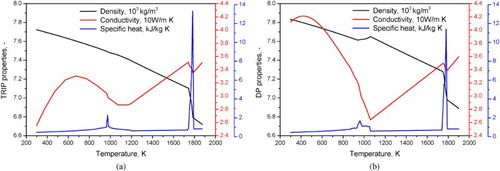
The temperature-dependent thermal properties, i.e. density, conductivity and specific heat capacity, were calculated using the JMatPro® software. Properties of TRIP and DP steels based on the chemical composition given in Table are shown in Figure . The DP steel has a consistently higher density than the TRIP steel. The heat conductivity of the DP steels is larger than that of the TRIP steel below 1000 K, and becomes similar above 1000 K. The specific heat capacity of these two steels is similar until the solidus temperature. The TRIP steel shows a slightly higher specific heat capacity due to the latent heat during the solid–liquid phase transformation.
Figure 1. Temperature-dependent thermal properties of (a) the TRIP and (b) the DP steel with chemical compositions defined in Table .
Welding of TRIP and DP steels
Bead-on-plate welding experiments were performed using a 3 kW Nd:YAG laser with a power of 1100 W and welding speed of 10 mm s−1. Rectangular TRIP and DP steel sheets, with a dimension of 90 × 45 mm2 and a thickness of 1.25 mm, were used. The laser beam was in focus on the sample top surface with a spot diameter of 0.6 mm. One edge of the sheet was fixed by clamps. The distance of the laser beam from the free edge was set to 9 mm. Transient temperature was measured by spot-welded K-type thermocouples at three positions in the heat-affected zone on both sides of the weld. Detailed information for welding set-up can be found elsewhere [Citation13]. For each of the steels, five experiments were repeated. After welding, optical microscopy analysis was carried out.
FE model
A 3D FE model was constructed [Citation14,Citation15] using a commercial software COMSOL™. The heat balance during welding was simulated including the heat input, heat transfer and heat loss. The heat input was applied as a volumetric conical heat source with a Gaussian distribution. The heat transfer in the sheet was governed by the temperature-dependent thermal properties. The latent heats due to phase transformations were included in the specific heat capacity. The heat loss was modelled by means of a surface film boundary condition. Room temperature was considered as a reference temperature. The governing equations for the FE model are given below
(1)
(2)
where
,
,
,
,
and
are the density, specific heat capacity, thermal conductivity, input heat flux, output heat flux and heat transfer coefficient.
Phase field model
A phase field modelling approach was applied in this study to simulate the microstructural evolution during solidification. The software MICRESS® is based on the phase field concept for multi-phase systems [Citation16], which is coupled to the thermodynamic database TCFE6 to obtain the equilibrium phase boundaries, and to the mobility database MOB2 to obtain the diffusion coefficients [Citation17]. The solidification microstructures were simulated while cooling the liquid phases of the TRIP and DP steels with the compositions mentioned in Table . Simulations were carried out on a two-dimensional 400 × 200 grid with a grid spacing of 0.5 µm. The energy parameters for the phase interaction [Citation18] used in this simulation are listed in Table . As this study focused on the evolution of the weld mushy zone (semi-solid region), only liquid and δ-ferrite were considered.
Table 2. Energy parameters for liquid-to-δ-ferrite phase interaction.
The initial concentration of the components was set to be the equilibrium in the liquid phase. Six nuclei of δ-ferrite with a radius of 0.5 µm were equally placed at the bottom edge of the computational domain. During solidification, the system underwent a liquid-to-solid reaction based on the local thermodynamic and chemical conditions.
For the boundary conditions, transient temperature profiles at the fusion boundaries from the FE model were applied to the bottom edge of the domain. A thermal gradient was defined according to the temperature difference between the fusion and the weld centre line. No latent heat was assumed here as the FE model has already considered this aspect through incorporation in the specific heat capacity. The initial temperature at the bottom edge was given as the liquidus temperature. The boundary conditions for the phase and concentration were set to be symmetrical. The interface thickness was assumed to be 3 µm. The time evolution is calculated by a set of phase field equations deduced by the minimisation of the free energy functional
(3)
(4)
where
is a phase field parameter,
is the interface thickness,
is the mobility of the interface as a function of the interface orientation, described by the normal vector
.
is the anisotropic surface stiffness,
is related to the local curvature of the interface,
is the thermodynamic driving force as a function of temperature
and local chemical composition
.
Results
TRIP and DP steels were laser-welded with the same heat input and under the same constraining conditions. Samples were cut from the welded sheets and evaluated by optical microscopy. Figure (a,b) shows the top surfaces of these samples etched with 5% nital. The crack was observed along the weld centre line in all TRIP samples, whereas for the DP samples, no cracks were detected. As the laser beam provides a highly concentrated heat flux and locally applied at the weld centre, a high thermal gradient is expected in transverse direction, and directional solidification is observed for the TRIP and DP steels. A magnified microstructure on the top surface of the DP steel is shown in Figure (c). The primary dendrite arm spacing is between 15 and 20 µm using a line intercept method.
Figure 2. Microstructures on the top surfaces of (a) the TRIP, (b) the DP steel and (c) magnified microstructure of the DP steel after laser welding.
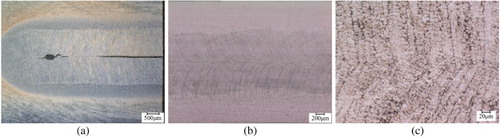
Figure (a) shows the temperature distribution predicted from the FE model when the heat source has progressed to the middle of the DP steel sheet. As the laser flux is locally applied travelling along the weld centre line, a double ellipsoid shape of the weld fusion zone is generated. Figure (b) shows the time–temperature profiles during welding of the DP steel, i.e. at 1.5 and 4 mm from the weld centre line on the free edge side, and at 2.5 mm from the weld centre line on the fixed edge side. The dotted lines show the experimental measurements, whereas the solid lines show the numerical predictions. Overall, a very good agreement has been achieved between the experiment and simulation in the heating and cooling stages at these three locations. The maximum temperature deviation is below 4%. Temperature validation for welding of TRIP steel has also been achieved within 3% maximum temperature deviation.
Figure 3. (a) Temperature (K) distribution in the DP steel predicted from the FE model, (b) transient temperature validation at three locations on both sides of the weld (B: on the free edge side, T: on the fixed edge side).
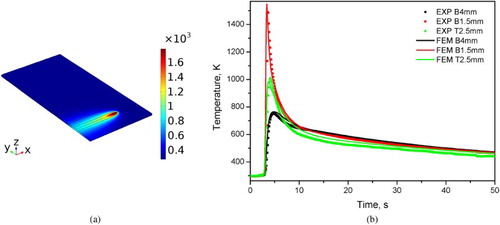
Figure (a) shows the simulated time–temperature profiles of the TRIP and DP steels at the weld centre line. The solid lines represent the TRIP steel, whereas the dotted lines represent the DP steel. As the same welding parameters and similar high temperature thermal properties of these two materials were applied, the time–temperature profiles almost coincide with each other. The phase field model was constructed to simulate transverse solidification perpendicular to the weld fusion boundary towards the weld centre line, as shown schematically in Figure (b). The boundary conditions applied were extracted from the FE model, i.e. temperature, thermal gradient and cooling rate. The temperature at the bottom edge of the computational domain is pre-defined to be 1780 K with a thermal gradient of 140 K mm−1 to the top edge. The cooling rate at the bottom edge is set to be 800 K s−1. The cooling time for the system is set to be 0.5 s, and the thermal gradient eventually reduces to 35 K mm−1.
Figure 4. (a) Simulated time–temperature profiles of the TRIP and the DP steel at the weld centre line, (b) schematic of the phase field region modelled.
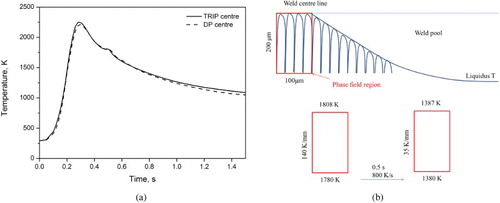
Figure shows the phase evolution of the DP steel during solidification up to 0.13 s. Red represents the liquid phase, blue represents the grain boundary and yellow represents the δ-ferrite phase. Six nuclei of δ-ferrite were pre-defined at the bottom edge of the domain to simulate the experimental welding conditions. After 0.05 s, primary dendritic arms are growing towards the top edge, and secondary dendritic arms are formed in the horizontal direction. At 0.1 s, the solid–liquid interface reaches two-thirds of the domain. The dendrites remain parallel with each other, while the inter-dendritic spacing has reduced. At 0.13 s, the dendritic tips reach the top edge, which represents the weld centre line.
Figure 5. Phase evolution of the DP steel during solidification up to 0.13 s (red: liquid, blue: grain boundary and yellow: δ-ferrite).
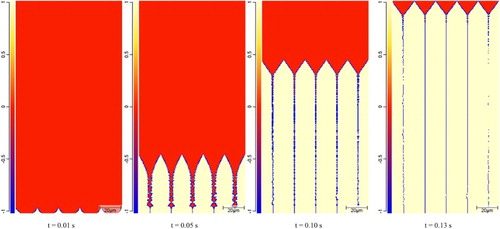
Figure shows the simulated microstructure when the dendritic tips reach the weld centre line of the TRIP and the DP steel. After the integration of the solid phases over the domain, the TRIP steel reaches a solid fraction of 93.7%, while the DP steel reaches a solid fraction of 96.3%. A lower solid fraction present in the TRIP steel implies that the TRIP steel has a broader solidification range than the DP steel. The solid–liquid interface velocities are calculated to be 1.428 and 1.538 mm s−1 for the TRIP and DP steels, respectively.
Figure 6. Phase distributions in the TRIP and the DP steel when the dendritic tips reach the weld centre line.
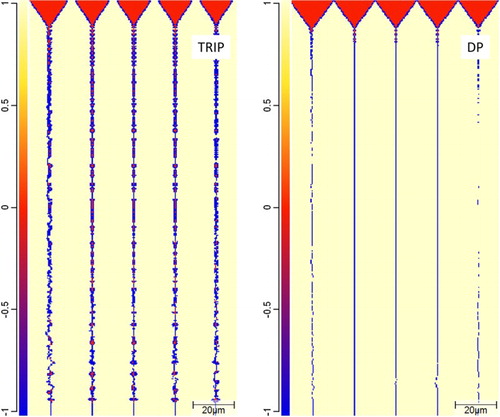
Figure shows the phase distributions along a vertical grain boundary of the TRIP and DP steels. Compared with the DP steel, the TRIP steel has more liquid pockets due to coalescence of the secondary dendrite arms . Liquid will be enriched during solidification due to element partitioning. The liquid channel length of the TRIP and DP steels are 194 and 20 µm, respectively. It should be mentioned that the temperature difference between the root and the tip of the dendrite for the TRIP steel is 28 K, which is much greater than that of the DP steel (2 K).
Figure 7. Phase distributions along a vertical grain boundary for the TRIP and the DP steel (number ‘0’, ‘1’, ‘−1’ represent liquid, δ-ferrite and grain boundary).
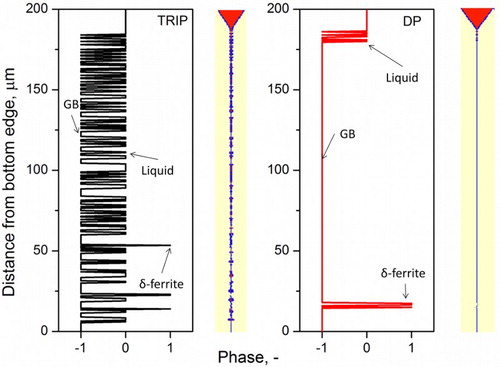
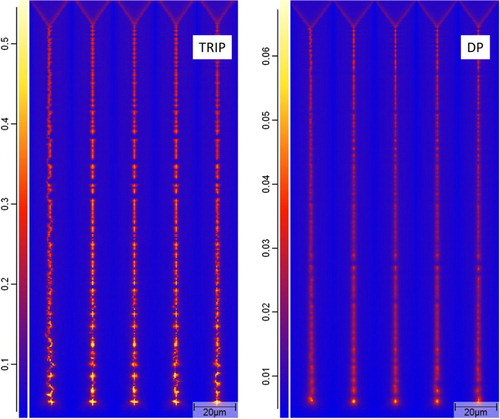
Figure shows the distribution of phosphorus (P) when the dendritic tips reach the weld centre line. The TRIP steel shows a much higher concentration of phosphorus at the grain boundaries, up to 0.55 wt-%, while its original composition in the base material is 0.089 wt-%. Phosphorus concentration in the DP steel grain boundary peaks at 0.06 wt-%, which is much lower than that in the TRIP steel.
Figure 8. Distribution of phosphorus (wt-%) in the TRIP and the DP steel when the dendritic tips reach the weld centre line.
Discussion
Results show that the TRIP steel is cracking during laser welding, while no cracks are found in the DP steel with the same heat input and under the same constraining conditions. The reasons are discussed as follows.
Solidification range
In order to achieve required mechanical properties, the TRIP and DP steels contain alloying elements. Table shows that carbon, manganese and silicon contents are similar for these two steels. However, the TRIP steel has a higher content of phosphorus (9 times) and aluminium (36 times) than the DP steel. Phosphorus is added to increase the amount of austenite retained at room temperature. Aluminium is insoluble in cementite and is added to retard its formation. This increased amount of phosphorus and aluminium in the TRIP steel leads to a broader solidification range than the DP steel. Figure shows the liquid fraction as a function of temperature for these two steels.
Figure 9. Liquid fraction as a function of temperature for the TRIP and the DP steel.
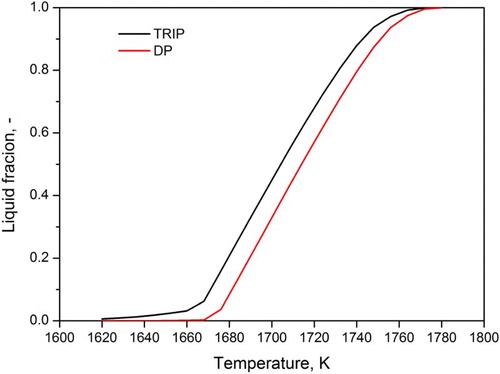
Compared with the DP steel, the TRIP steel shows a slower solid–liquid interface velocity under identical welding conditions. Enrichment at the interface leads to solute drag and subsequently results in difference in interface velocities. According to Figure , the liquid is undercooled to lower temperatures in the TRIP steel than in the DP steel. This undercooling leads to the increased partitioning of alloying elements, resulting in sluggish interface migration.
Pressure drop
The Rappaz Drezet Gremaud (RDG) criterion [Citation19] for hot cracking in metallic alloys is based upon a mass balance performed over the liquid and solid phases, which accounts for the tensile deformation of the solid skeleton perpendicular to the growing dendrites and for the induced inter-dendritic liquid feeding.
Under the assumption that a steady state is reached in the weld mushy zone, the liquid pressure drop along a weld mushy zone consists of two contributions: due to the solidification shrinkage and
due to deformation. The two contributions can be written as
(5)
(6)
where
is the dendrite arm spacing,
is the viscosity,
is the interface velocity,
is the shrinkage factor,
is the strain rate,
is the solid fraction and
is the thermal gradient, which is the temperature difference from the dendritic root to tip (
and
) over the liquid channel length
.
As the solid dendrites grow from both sides of the weld, a closed semi-solid region is formed when the dendritic tips coalesce at the weld centre line. A pressure drop from the dendritic tip to the root is generated in the absence of extra liquid feeding the channels.
The coalescence temperatures of the TRIP and DP steels are 1668 and 1696 K, respectively. The interface velocity, dendrite arm spacing and channel length are derived from the phase field results. The shrinkage factor is calculated based on the density difference of the solid and liquid (4.3%), whereas the viscosity of liquid steel (0.005 Pa s) is taken from the literature [Citation20]. The pressure drop due to solidification shrinkage is 121.7 kPa for the TRIP and 6.7 kPa for the DP steels. A larger pressure drop is associated with a higher susceptibility for hot cracking.
The thermal expansion coefficient above the solidus temperature is assumed to be 3 × 10⁻⁵ K−1 [Citation13]. In combination with the cooling rate, a strain rate based on thermal contraction can be determined. The pressure drop due to deformation is 819.5 kPa for the TRIP and 3.5 kPa for the DP steels. Combining the shrinkage and deformation terms, the pressure drop for the TRIP and DP steels is 941.2 kPa and 10.2 kPa, respectively, indicating that the TRIP steel is more susceptible to hot cracking, which is also experimentally confirmed as shown in Figure .
Phosphorus segregation
The phosphorus concentrations are predicted at grain boundary up to 0.55 wt-% for the TRIP steel and 0.06 wt-% for the DP steel, as shown in Figure . Both of them are approximately six times higher than their nominal concentrations. Phosphorus segregation at the grain boundaries can lead to a steel embrittlement [Citation21–23]. During welding, a steep thermal gradient can be generated due to a localised heat source, which leads to considerable tensile stresses (up to the yield stress) in the weld fusion zone [Citation24]. This tensile loading at the brittle grain boundaries will increase the susceptibility for hot cracking.
The aim of this study is to link the thermal field during welding obtained from the FE models to the development of the microstructures and the chemical composition of the phase field models. In the FE model, only the heat transfer was simulated and the transient temperature profiles were validated with experimental measurements, while the physics of solid mechanics was not included. However, welding numerical models can be de-coupled, which implies that the stress/strain field has limited back-influence on the temperature field. Therefore, the thermal field predicted from the FE model should be a valid input for the phase field model. In the phase field model, only the thermal boundary conditions were defined, without applying any mechanical constraints. When calculating the pressure drop in the inter-dendritic regions, the shrinkage term, which results from density difference (related to temperature or phase fraction), should be reliable. However, for the deformation term, the strain rate was based only on the thermal contraction. It is recommended for further research to first validate the transient strain using an FE model, and apply this as a mechanical boundary condition to a phase field model. In summary, this study bridges the macroscale thermal field with microscale structural evolution, and shows the morphology during weld solidification. The resultant pressure drop derived in the inter-dendritic regions and phosphorus segregation at the grain boundaries explain the occurrence of hot cracking.
Conclusion
In this study, laser welding was performed on the TRIP and DP steels. Under the same heat input and mechanical constraints, the TRIP steel has a higher hot cracking susceptibility to the DP steel.
The thermal field in the weld fusion zone from a validated FE model was applied as a boundary condition to a phase field model coupling with a thermodynamic and mobility database. Microstructural evolution during weld solidification was obtained, i.e. inter-dendritic arm spacing and element segregation, which provides an enhanced understanding of the occurrence of hot cracking.
The TRIP steel has a broader solidification range than the DP steel. When the dendritic tips coalesce with the weld centre line, the TRIP steel shows a higher pressure drop for the solidification shrinkage and deformation contribution, which explains why the TRIP steel is more susceptible to hot cracking than the DP steel when solidification is nearly complete.
The phosphorus concentration is predicted at grain boundary up to 0.55% for the TRIP steel, which is six times higher than the concentration in the base material. Segregation of phosphorus can lead to brittle structures at the grain boundary, which increases the hot cracking susceptibility during solidification as a result of thermally induced tensile stress.
Disclosure statement
No potential conflict of interest was reported by the authors.
ORCID
H. Gao http://orcid.org/0000-0003-2111-4341
G. Agarwal http://orcid.org/0000-0003-4669-7037
M. Amirthalingam http://orcid.org/0000-0001-9976-8922
M. J. M. Hermans http://orcid.org/0000-0002-6204-5285
Additional information
Funding
References
- Chung K, Noh W, Yang X, et al. Practical failure analysis of resistance spot welded advanced high-strength steel sheets. Int J Plasticity. 2017;94:122–147. doi: 10.1016/j.ijplas.2016.10.010
- Rossini M, Spena PR, Cortese L, et al. Investigation on dissimilar laser welding of advanced high strength steel sheets for the automotive industry. Mater Sci Eng A Struct. 2015;628:288–296. doi: 10.1016/j.msea.2015.01.037
- Kuziak R, Kawalla R, Waengler S, et al. Advanced high strength steels for automotive industry: a review. Arch Civ Mech Eng. 2008;8(2):103–117. doi: 10.1016/S1644-9665(12)60197-6
- Curtze S, Kuokkala VT, Hokka M, et al. Deformation behavior of TRIP and DP steels in tension at different temperatures over a wide range of strain rates. Mater Sci Eng A Struct. 2009;507(1–2):124–131. doi: 10.1016/j.msea.2008.11.050
- Bang KS, Pak SH, Ahn SK, et al. Evaluation of weld metal hot cracking susceptibility in superaustenitic stainless steel. Metal Mater Int. 2013;19(6):1267–1273. doi: 10.1007/s12540-013-6019-6
- Yan F, Liu S, Hu C, et al. Liquation cracking behavior and control in the heat affected zone of GH909 alloy during Nd: YAG laser welding. J Mater Proc Technol. 2017;244:44–50. doi: 10.1016/j.jmatprotec.2017.01.018
- Prokhorov NN, Shirshov YV. Effect of welding conditions on character of crack-propagation and load carrying capacity of a welded joint during brittle-fracture of weld metal. Weld Prod. 1974;21(6):1–5.
- Clyne TW, Wolf M, Kurz W, et al. The effect of melt composition on solidification cracking of steel, with particular reference to continuous-casting. Metall Trans B. 1982;13(2):259–266. doi: 10.1007/BF02664583
- Won YM, Yeo TJ, Seol DJ, et al. A new criterion for internal crack formation in continuously cast steels. Metall Mater Trans B. 2000;31(4):779–794. doi: 10.1007/s11663-000-0115-y
- Rappaz M, Drezet JM, Gremaud M, et al. A new hot-tearing criterion. Metall Mater Trans A. 1999;30(2):449–455. doi: 10.1007/s11661-999-0334-z
- Kou S. A criterion for cracking during solidification. Acta Mater. 2015;88:366–374. doi: 10.1016/j.actamat.2015.01.034
- Wang XJ, Lu FG, Wang H-P, et al. Micro-scale model based study of solidification cracking formation mechanism in Al fiber laser welds. J Mater Proc Technol. 2016;231:18–26. doi: 10.1016/j.jmatprotec.2015.12.006
- Agarwal G, Gao H, Amirthalingam M, et al. In situ strain investigation during laser welding using digital image correlation and finite-element-based numerical simulation. Sci Technol Weld Join. 2017;57:1–6. doi: 10.1080/13621718.2017.1344373
- Gao H, Hermans MJM, Richardson IM, et al. Simulation of transient force and strain during thermal mechanical testing relevant to the HAZ in multi-pass welds. Sci Technol Weld Join. 2013;18(6):525–531. doi: 10.1179/1362171813Y.0000000133
- Nishikawa H, Oda I, Shibahara M, et al., editors. Three-dimensional thermal-elastic-plastic FEM analysis for predicting residual stress and deformation under multi-pass welding. Int Society Offshore Polar Eng. 2004;126–132.
- Bottger B, Apel M, Santillana B, et al. Phase-field modelling of microstructure formation during the solidification of continuously cast low carbon and HSLA steels. IOP Conf Ser: Mater Sci Eng. 2012;33. p. 012107. doi: 10.1088/1757-899X/33/1/012107.
- Böttger B, Grafe U, Ma D, et al. Simulation of microsegregation and microstructural evolution in directionally solidified superalloys. Mater Sci Technol. 2000;16(11–12):1425–1428. doi: 10.1179/026708300101507398
- Amirthalingam M, van der Aa EM, Kwakernaak C, et al. Elemental segregation during resistance spot welding of boron containing advanced high strength steels. Weld World. 2015;59(5):743–755. doi: 10.1007/s40194-015-0250-3
- Drezet J-M, Allehaux D. Application of the rappaz-drezet-gremaud hot tearing criterion to welding of aluminium alloys. In: Böllinghaus T, Herold H, Cross CE, Lippold JC, editors. Hot cracking phenomena in welds II. Berlin: Springer; 2008. p. 27–45.
- Hildebrand JH, Lamoreaux RH. Viscosity of liquid metals: an interpretation. Proc Natl Acad Sci USA. 1976;73(4):988–989. doi: 10.1073/pnas.73.4.988
- Nikolaeva AV, Nikolaev YA, Kevorkyan YR. Grain-boundary segregation of phosphorus in low-alloy steel. Atomic Energy. 2001;91(1):534–542. doi: 10.1023/A:1012482419952
- Song SH, Zhao Y, Cui Y, et al. Effect of grain boundary character distribution and grain boundary phosphorus segregation on the brittleness of an interstitial-free steel. Mater Lett. 2016;182:328–331. doi: 10.1016/j.matlet.2016.07.023
- Zorc B, Bernetič J, Nagode A. Effects of welding residual stresses and phosphorus segregation on cleavage delamination fracture in thick S355 J2 G3 + N steel plate. Eng Fail Anal. 2014;40:8–14. doi: 10.1016/j.engfailanal.2014.02.014
- Gao H, Dutta RK, Huizenga RM, et al. Stress relaxation due to ultrasonic impact treatment on multi-pass welds. Sci Technol Weld Join. 2014;19(6):505–513. doi: 10.1179/1362171814Y.0000000219