
 ?Mathematical formulae have been encoded as MathML and are displayed in this HTML version using MathJax in order to improve their display. Uncheck the box to turn MathJax off. This feature requires Javascript. Click on a formula to zoom.
Abstract
Objectives
Pricing, affordability, and access are important deliberations around infectious disease interventions. Determining a fair price that not only incentivizes development but ensures value and access for patients is critical given the increasing global health crisis. Using Ebola virus disease (EVD) as an exemplar, we aim to elucidate the estimation of a jurisdiction-specific value-based price (VBP) for a vaccine package and to consider how prices compare across selected countries that have experienced EVD outbreaks.
Methods
Using a dynamic transmission model, we assessed the cost-effectiveness of a vaccine package – composed of the vaccine, storage, maintenance, and administration – for vaccination toward herd immunity in 4 countries affected with EVD (Democratic Republic of Congo, Liberia, Sierra Leone, Uganda). Based on the cost-effectiveness metrics and using willingness-to-pay thresholds equal to varying percentages of the Gross Domestic Product (GDP), we demonstrated how a VBP is calculated using a cost-effectiveness-based approach.
Results
The VBP for the vaccine is directly proportional to effectiveness (DALYs prevented), cost-effectiveness (ICER) and GDP per capita. Higher effectiveness, greater cost-effectiveness, and higher GDP per capita resulted in higher price ceilings compared to lower cost-effectiveness and lower GDP.
Conclusion
Despite the concerns with the cost-effectiveness-based approach, we illustrated that it is an easily comprehensible method for determining the VBP of a vaccine using cost-effectiveness analysis. Choice of data, population characteristics, and disease dynamics are among the factors that need to be considered when comparisons are made across countries.
PLAIN LANGUAGE SUMMARY
In infectious diseases, issues related to pricing, affordability and access to interventions are very important; particularly in low-income countries (LIC) because of the scarcity of resources coupled with several competing priorities. Pricing interventions fairly in LICs facilitates the prevention and management of infectious diseases, promotes innovation, and ensures patient access to valuable interventions. We were interested in determining a fair price of an intervention for an infectious disease (here, vaccination against Ebola virus disease) based on the cost-effectiveness (or value) of vaccination in four African countries.
Using data from EVD outbreaks in Liberia, the Democratic Republic of Congo, Uganda, and Sierra Leone, we estimated the number of susceptible people who were exposed to the virus, became infected, recovered, or died. We did this for two scenarios: not vaccinating versus vaccinating to achieve herd immunity. We determined how many disability-adjusted life years (DALY; loss of the equivalent of a year of full health) would be prevented by vaccination; setting this as our value metric. Using this value metric and percentages of the gross domestic product (GDP) per capita as the willingness-to-pay (WTP) threshold (the price a payer might be prepared to pay for the intervention) we demonstrate how to calculate the maximum price for the vaccine package.
The combination of greater effectiveness (DALYs averted), greater cost-effectiveness (value) and higher GDP per capita (WTP) resulted in different price ceilings in the four countries. The method proposed here is easy to understand and requires minimum data to determine a price for an intervention’s price based on its value.
Introduction
Infectious diseases continue to afflict public health the world over; with corona virus disease (COVID-19), Ebola virus disease (EVD), and measles outbreaks erupting in various parts of the world. The public health, economic, and societal impacts of these outbreaks are immense, and efforts being made to mitigate these are barely able to control themCitation1. A lot of research, as well as fiscal resources, are invested into control measures for infectious diseases such as treatments and vaccines. While the initial focus of infectious disease interventions, especially in outbreak situations, is centered on efficacy, safety, logistics and access, there is increasing interest in the economic aspects of pricing, affordability, and allocationCitation2.
An ongoing discussion about how to price, value, and reward innovation, and balance these three elements has generated many proposed methods for pricing pharmaceuticalsCitation3. Cost-based, competition-based, and value-based pricing are used in industrial markets, with value-based pricing considered the gold standardCitation4. While cost-based pricing bases the price of a product on the costs of research and development and manufacturing, as well as the costs associated with regulation, compliance, overhead and operation, competition-based pricing, uses the price of similar products to derive a benchmark for negotiating the price of a productCitation5. From an economic perspective, value-based pricing (VBP) is about setting a price of an intervention that reflects its value to the consumerCitation5 where value also implies an opportunity cost to free up resources for use on their next best alternative. VBP takes into account disease burden and health effects that are important to society and works towards efficient use of health system resources, subsequently improving health outcomesCitation6.
There are several methods of generating information for calculating value-based prices, many of which are from cost-effectiveness analyses (CEAs). While the use of CEA for VBP calculations is ridden with challenges related to addressing uncertainties, reflecting social values and lifetime gains, as well as including additional elements of value, CEAs are still considered an important methodology for VBPCitation7. Pearson and colleagues put forward 4 basic approaches of calculating VBP using CEA. The first approach uses a sliding scale for the incremental cost-effectiveness ratios (ICERs) related to the product to estimate the VBP. A second approach disallows full credit for cost offsets and offers an alternative in cases where prices exceed a commonly used cost-effectiveness threshold. The third method, referred to as the “QALY-cap” approach credits the intervention with its full value in terms of the health benefits, but has been criticized by some as an approach that undervalues interventions that help reduce healthcare costs. Lastly, the “shared saving” approach advocates for sharing the rewards of intervention between the innovator and the health systemCitation8.
We describe how a value-based price of a vaccine package, for a single individual, made up of the vaccine, storage, maintenance, and administration, is determined using an approach based on a CEA of a vaccination program that targets herd immunity. We apply this to Ebola virus disease vaccination programs in selected affected countries in Africa and discuss how the value of the program compares in these countries based on their distinct characteristics.
Application of value-based pricing
Ebola virus disease (EVD) is a severe, often fatal, hemorrhagic infection caused by several species of the Ebolavirus, the most common of which is Zaire EbolavirusCitation9. The disease is spread by contact with body fluids from infected patients and symptoms develop typically within an incubation period of 1–21 daysCitation9. Symptoms range from fever, nausea, vomiting, diarrhea, and bleeding; to more extensive multiple organ damage such as gastrointestinal injury and bleeding, hepatic damage, and renal failure; resulting ultimately in deathCitation8. Most EVD outbreaks have occurred in Africa with the countries like Democratic Republic of Congo (DRC), Liberia, Sierra Leone, and Uganda being hit the hardest from outbreaks over the yearsCitation10.
Presently, management is focused on supportive care and infection control with other therapies being developed for EVD treatment. A multi-drug clinical trial evaluated the safety and effectiveness of azithromycin, a combination of sunitinib and erlotinib, a combination of atorvastatin and irbesartan, and intravenous fluids in the management of EVDCitation11. Two monoclonal antibodies, (Inmazeb, Regeneron, Tarrytown, NY) and Ebanga (Ridgeback, Miami, FL), have been approved for treating EBOV infections. While the Ervebo (Merck, Kenilworth, NJ) vaccine has been approved by the US Food and Drug Administration and prequalified by WHO for protection against EBOV, the Zabdeno-Mvabea (Janssen Global Services, LLC) vaccine has been granted marketing authorization by the European Medicines Agency for individuals a year and olderCitation11. EVD vaccines are currently paid for by the International Coordinating Group (ICG) on Vaccine Provision, which includes the World Health Organization (WHO), UNICEF, the International Federation of Red Cross, and Red Crescent Societies (IFRC), and Médecins Sans Frontières (MSF), with financial support from Gavi, the Vaccine AllianceCitation12. To ensure value for money and return on investments for such payers, it is important that an appropriate price be set for EVD vaccines to reflect their value while also rewarding innovation by manufacturers.
Method
Cost-effectiveness analysis
The CEAs performed for this comparative value-based pricing study used a recent dynamic transmission model (DTM) analysis of the cost-effectiveness of EVD vaccination for the Democratic Republic of Congo (DRC) as the reference methodologyCitation13. In the DRC study, the cost-effectiveness of vaccinating a proportion of the hypothetical population (hereafter, referred to as population) was compared to a base scenario of no vaccination for a population of 1,000 individuals. In the present analysis, we replicated this methodology for Liberia, Sierra Leone, and Uganda and integrated the results along with the prior DRC results. We applied epidemiological data related to the 2014–2016 EVD outbreaks in these four countries.
We modeled the disease over a one-year period and determined effectiveness in terms of disability-adjusted life years (DALYs) averted from the payer perspective. To set a clinically warranted target, we modeled vaccinating a proportion of the population equivalent to the herd immunity threshold using the formula:
where
refers to the basic reproductive number, the number of secondary cases generated by an index case in the absence of control interventionsCitation14.
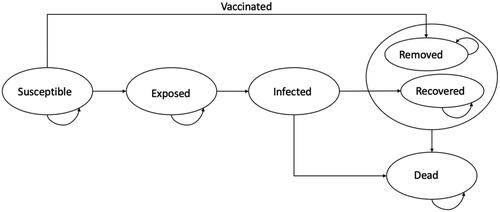
A modified SEIR model (including death), in which the participants move from susceptible, to exposed, infected, recovered, and dead at various rates was specified (). Applying compartmental modeling conceptsCitation14, we used the following differential equations to move participants from one compartment to another:
where N is the population, S is the number of this population susceptible to infection, E is the number exposed to the virus, I is the number infected, R is the number who recover from the infection, and D is the number who die from the infection. We assumed an initial population size of 1,000 with 1 infected patient. Susceptible persons become exposed at a rate of βI/N where β is the transmission rate and I/N represents the probability of contact with an infected person. Assuming an incubation period of 1/ξ days, exposed persons move into the infected compartment at a rate of ξ per day. Infected persons either recover at a rate of δ or die at a rate of µ per day. Given that the mean duration of the epidemic was 200 daysCitation14, and no evidence supporting the lasting immunity or otherwise of the vaccine, we allowed the model to run over a period of 1 year or 365 days to populate the states of the model.
Figure 1. Schematic view of the dynamic transmission model.
To assess the cost-effectiveness of the program in terms of DALYs averted, we obtained disability weights from the Global Burden of Disease Study 2015Citation15 and subsequently computed DALYs as the sum of years of life lost (YLL) and years of life lived with disability (YLDs) using the formula stipulated by Emerson et al.Citation16:
Citation17,Citation18
Citation19
Citation17
where K is the age weighting modulation factor (0 if no age weighting modulation factor is used); YLL_L is the life expectancy at age of death; s is the average age at premature death due to disease minus average age at disease onset; and D is the disability weight.
Costs of treatment, screening, and vaccination were obtained from published literatureCitation20–23. The cost of the vaccine package comprised the price of the vaccine as well as the composite cost of administration. All costs were converted to 2021 USD using the US Consumer Price Index for Medical CareCitation19. ICERs were calculated as follows:
Value-Based pricing
To estimate a value-based price for the vaccine package, we adapted the method by Pearson et al., which determined the VBP using an approach based on a cost-effectiveness analysisCitation8. For our analysis, the value of the package was reflected in the estimated DALYs averted and willingness-to-pay or cost-effectiveness thresholds were set at varying percentages of each country’s gross domestic product (GDP) per capita. Following Pearson and colleaguesCitation8, we calculated the VBP as:
A flow chart of the step-by-step calculation of VBP is provided in . All analyses were conducted in a bespoke Microsoft Excel. Input parameters for the model and analyses are provided in and .
Figure 2. Flow chart for calculating VBP. Abbreviations. VBP, value based price; GDP, gross domestic product per capita; DRC, Democratic Republic of Congo; DALY, disability adjusted life year; EVD, ebola virus disease. The total cost of EVD without vaccination refers to the cost of EVD in the base case scenario in which the population received no vaccination. Non-vaccination component of the program refers to the cost of EVD (other than those related to the vaccine) in the scenario in which a proportion of the population received the vaccination.
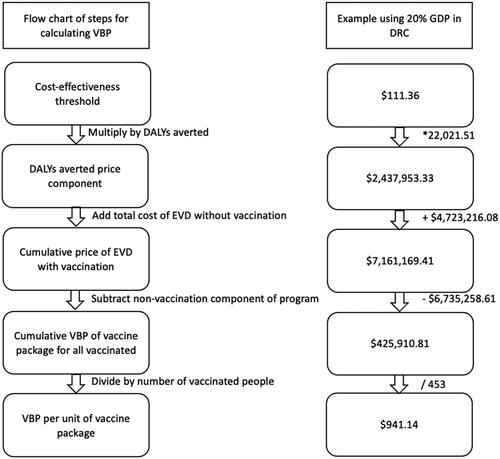
Table 1. Country-specific inputs for analyses.
Table 2. General model inputs for analyses.
Sensitivity analyses
To assess the robustness of our model, we conducted probabilistic sensitivity analyses (PSA). Using simultaneous random sampling from the estimated probability distributions of parameters, we ran 10,000 Monte Carlo simulations and presented these visually using a cost-effectiveness plane and cost-effectiveness acceptability curves (CEAC). Input parameters were varied using 95% CIs or standard errors, where available, or per expert opinion, ±10% of the point estimates. We used gamma distribution for the cost parameters, gamma distribution for utility, beta distribution for probability parameters, and lognormal distribution for the vaccination proportion parameter.
According to the WHO guide for standardization of economic evaluation of immunization programs, in the absence of WTP values for a given country, it is recommended that cost-effectiveness results be presented for a range of WTP valuesCitation25. Given no WTP thresholds for an Ebola vaccine in the countries investigated, we estimated the cost-effectiveness as well as VBP of the vaccine package over a range of WTP values equivalent to varying percentages of the GDP per capita. We determined the value-based price of the vaccine package when the cost-effectiveness threshold is set at percentages of the GDP per capita increasing by 10%.
Results
In all the included countries, vaccination resulted in increased total costs while decreasing DALYs. Averting a DALY was estimated to cost $73.43, $94.33, $101.63, and $666.38 in Uganda, DRC, Liberia, and Sierra Leone, respectively ().
Table 3. Base-case cost-effectiveness analysis for DRC, Liberia, Sierra Leone, and Uganda.
The results of the PSAs are presented in and . shows the clustering of simulations in the northeast quadrant of the plane indicating higher effectiveness, along with the higher cost of the vaccine package in the countries investigated. For Liberia and Sierra Leone, simulations can be seen to cluster at the lower ends of the plane signifying lower incremental outcomes at lower incremental costs compared to those of Uganda and DRC, where the vaccination program yields higher incremental outcomes at higher incremental costs, thus clustering in the upper parts of the quadrant. The limited dispersion of the scatter plots for each country signifies the acceptable robustness of the model. The PSAs also confirm the findings of the base-case analysis that the vaccine produces the highest decremental DALYs in DRC, followed by Uganda, Liberia, and Sierra Leone, but at incremental costs in a similar declining pattern across these countries.
Figure 3. Incremental cost-effectiveness ratio plane for EVD vaccination in Democratic Republic of Congo, Liberia, Sierra Leone, and Uganda. Abbreviations. DALY, disability adjusted life year; WTP, willingness-to-pay threshold.
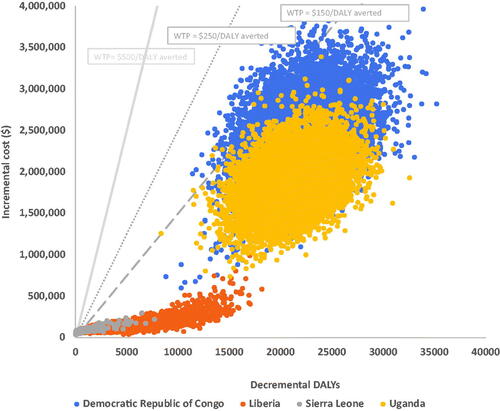
Figure 4. Cost-effectiveness acceptability curves for the EVD vaccine in the Democratic Republic of Congo, Liberia, Sierra Leone, and Uganda.
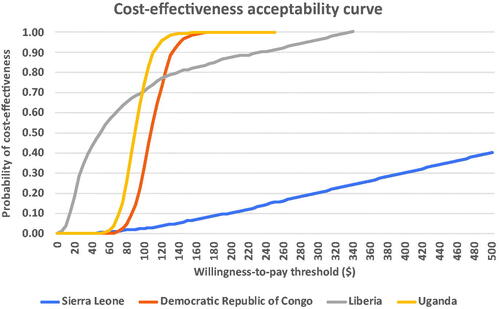
The CEAC () shows the probability of the vaccine package being cost-effective at varying willingness-to-pay (WTP) thresholds. In Uganda and DRC, the vaccine package has a 99.99% probability of cost-effectiveness at WTP thresholds of approximately $175 and $185, respectively. At WTP thresholds below $75, the probability of cost-effectiveness was highest in Liberia compared to the other countries evaluated. In contrast, this probability of cost-effectiveness falls below those of DRC and Uganda when the WTP threshold exceeds $75. Of the countries evaluated, the probability of cost-effectiveness is lowest in Sierra Leone where even at the WTP threshold of $500, the probability of cost-effectiveness is only about 40%. The highest prices a vaccine package can assume at WTP thresholds corresponding to percentages of each country’s GDP per capita are shown in . From the table, the vaccine package can be most highly priced in Uganda, followed in declining order by DRC, Liberia, and Sierra Leone. Appendices A-D illustrate the calculation of the VBP for the EVD vaccine package in the various countries.
Table 4. Value-based price of vaccine package across countries ($).
Discussion
In this technical note, we described value-based pricing that is based on the results of a CEA and illustrated this for an EVD vaccine program that targets, in a given population, vaccination to herd immunity. Secondary to this, we described how this price compares across different countries and the factors that should be considered in generalizing value-based prices across jurisdictions. Our results showed the vaccine package to be most cost-effective in Uganda (ICER $73.43/DALY averted), followed by DRC ($94.44/DALY averted), Liberia ($101.63/DALY averted), and Sierra Leone ($666.38/DALY averted). The price ceiling of the vaccine package based on the DALYs averted was determined to be lowest in Sierra Leone where the program was least cost-effective and GDP per capita was lowest and highest in Uganda where the program was most cost-effective and GDP per capita was highest.
Value-based pricing of the vaccine package is important because it reflects both the clinical and economic benefits of the interventionCitation5. The method used to estimate the VBP of the vaccine package translates the lifetime gains of intervention into its costsCitation8. While arguments have been about the potential of this approach to price interventions at costs that appear much higher than policymakers may be ready to payCitation8, it is also important to note that VBP allows the payer’s willingness-to-pay threshold to act as a control on price, within the intervention’s cost offsets as well as its incremental effectivenessCitation26.
The choice of using percentages of a country’s GDP per capita as cost-effectiveness thresholds was based on several yet disparate recommendations on appropriate cost-effectiveness thresholds especially in lower-income settingsCitation22,Citation27–30. While the WHO recommends cost-effectiveness thresholds between 1 and 3 times GDPCitation22, Daroudi et al. propound thresholds less than 1*GDP in LMICsCitation27. Jit, in assessing global cost-effectiveness thresholds for human papillomavirus vaccine introductions, found that thresholds between 30% to 40% of GDP were optimal in LMICsCitation28. Also, in re-evaluating the cost-effectiveness of rotavirus vaccination in 73 Gavi countries, most of which are LMICs, Debellut and colleagues found cost-effectiveness thresholds between 50% and 100% GDP per capita to be optimalCitation29. In addition to these, Lomas et al.Citation30 also proffer a flexible evaluation framework that provides estimates of evaluation parameters to inform decision-makers in a transparent manner. Given no consensus on appropriate thresholds in LMICs and the recommendation by WHO to present cost-effectiveness over a range of WTP thresholdsCitation25, we varied these percentages to give an overview of the VBP of the vaccine package for better elucidation. Thresholds that incorporate GDP per capita, a measure of wealth in individual countries, take into account fiscal differences in these countries and attempt to price interventions in proportion to each country’s economyCitation31. Thus, the price of intervention in countries with lower GDPs would be lower than in countries with higher GDPs as illustrated by our analysis.
To better understand the findings, it is important to view them in light of each country’s characteristics. Briefly, the included countries were similar in terms of median age and general life expectancy. All countries had relatively young populations, with median ages ranging from 16 to about 19 years and general life expectancy at birth from 54 years to 63 years. In terms of GDP per capita, DRC, Liberia and Sierra Leone were within similar ranges of about $500 while Uganda was at $817. Further, it is essential to consider the epidemiology of EVD in the countries assessed. While the transmission rate, one of the important drivers of infectious diseases, was lowest in Sierra LeoneCitation32, it was highest in Uganda. The basic reproductive number, the number of secondary infections expected from one case of infectious disease, was highest in Uganda resulting in a higher herd immunity threshold and subsequently a higher proportion requiring vaccination, and lowest in Sierra Leone.
From our analyses, we found vaccination programs to be more cost-effective where transmission rates are higher compared to settings with lower transmission rates. This is reflective of the clinical value of vaccination in limiting transmission since persons who would have been susceptible receive protection against the infectionCitation32,Citation33. Thus, with higher transmission rates, the effect of a vaccination program is more pronounced: more infections and infection-related outcomes such as the DALYs used in this analysis are prevented leading to higher returns in effectiveness and thus greater cost-effectiveness. Given that the R0 is proportional to the transmission dynamics of diseaseCitation34, it is understandable that countries with higher transmission rates had a higher R0, which in turn makes vaccination programs more cost-effective than countries with lower transmission rates. One could think of this as follows: vaccination is essential, but it will be more clinically as well as cost-effective when transmission rates are high and there are more disease and disease-related outcomes, in our case DALYs, to be prevented.
As previously mentioned, VBP based on DALYs averted integrates value in terms of both cost and outcomesCitation7,Citation31. In Uganda, the country with the highest GDP per capita in our analyses, and were consequently the program was the most cost-effective, the VBP for the vaccine package can be set the highest compared to the other countries where GDP per capita is lower and the program is less cost-effective. For instance, in Sierra Leone where GDP per capita was the lowest and the vaccination program the least cost-effective, the VBP was the lowest. This reflects lower demand for vaccines in situations where less transmissible diseases break out. This translates into lower cost-effectiveness, lower value of vaccination programs and lower ceilings for prices for vaccine packages compared to countries where more transmissible diseases break out.
Several considerations need to be made when attempting to compare or generalize the results of such analyses across countries or jurisdictions. These are more pronounced in infectious disease evaluations. Infectious diseases are dynamic, with rates changing constantly. Thus, input parameters for modeling are likely to be unknown, often “guesstimated” based on available data, or worse, inaccurately measuredCitation35. Also, given different population characteristics, contact patterns, along with other infectious disease complexities across countries, such comparisons must be conducted and interpreted cautiously.
Types of data are also an important element requiring attention. According to recommendations in the ISPOR Task Force Report on the transferability of economic evaluations across jurisdictions, some parameters may have to be jurisdiction-specific, requiring that they are based on data from the population under studyCitation36. While it may be more, it may not be feasible in all situations due to the unavailability of data. In the absence of relevant data for a country, the exchangeability of data should be justified by jurisdictions being sufficiently similar to allow comparability or transferability for the purposes of the economic evaluationCitation37. For this, the sources of data need to be as comparable as possible. Clinical trials and epidemiological studies that serve as sources for these studies need to be based on similar participant profiles while the choice between hard clinical outcomes, surrogates, as well as more generic outcomes need to be sufficiently similar to facilitate comparison across countriesCitation5.
While efforts were made to ensure accuracy and robustness, our analyses have a few limitations while also providing directions for future research. Some data required for modeling were unavailable in certain countries, leading to the use of more general data for the analyses. Like most models, ours assumed homogenous target populations across the countries in terms of composition and characteristics. While these limitations may have changed the results of the analyses, they did not affect the methods described and the concepts we wished to introduce. Data permitting, future research should focus on examining the effect of wealth inequality and other microeconomic aspects on the value of vaccines as well as subpopulation analyses to examine the effect of heterogeneity.
Conclusion
In this technical note, and using vaccination against EVD as an exemplar, we demonstrated a parsimonious, yet effective approach to estimating the VBP of an intervention based on cost-effectiveness analysis and capped at a predetermined willingness-to-pay threshold. While this serves as a theoretical model, it can also be used by country-level decision makers to guide the process of estimating their own technology prices based on various conditions, being mindful of the associated uncertainties. Such an approach is efficient in pricing technologies as part of emergency preparedness planning. This approach is easily comprehensible and allows for the incorporation of both costs and benefits of the intervention. We also demonstrated the advantage of cost-effectiveness thresholds based on GDP per capita in terms of their reflection of national wealth and subsequent indirect incorporation of affordability within specific countries. Finally, the exercise of comparing cost-effectiveness and VBP prices in the included countries highlighted important considerations for cross-jurisdiction comparisons of economic evaluations of infectious diseases such as disease dynamics, population characteristics, data types and sources.
Transparency
Declaration of funding
This study received no funding.
Declaration of financial/other interests
IA holds equity in Matrix45, LLC, which provides research and consulting services to, among others, the pharmaceutical industry. By company policy, associates of Matrix45, LLC cannot provide services to nor receive compensation independently from sponsor organizations. IA has no other disclosures related to the work reported herein. All other authors have no disclosures related to the work reported herein.
Author contributions
MOK contributed to study design, collection, analyses and interpretation of data, revision, and final approval of the manuscript. DR and BE contributed to revision and final approval of the manuscript. IA contributed to study design, revision, and final approval of the manuscript.
Acknowledgements
No assistance in the preparation of this article is to be declared
Reviewer disclosures
Peer reviewers on this manuscript have no relevant financial or other relationships to disclose.
Previous presentations
This study was never presented previously.
Supplemental Material
Download MS Word (28.8 KB)References
- World Health Organization (WHO). A strategic framework for emergency preparedness. [cited 2021 August 10]. Available from: https://www.who.int/publications-detail-redirect/a-strategic-framework-for-emergency-preparedness.
- Quinn SC, Kumar S. Health inequalities and infectious disease epidemics: a challenge for global health security. Biosecur Bioterror. 2014;12(5):263–273.
- Claxton K, Briggs A, Buxton MJ, et al. Value-based pricing for NHS drugs: an opportunity not to be missed? BMJ. 2008;336(7638):251–254.
- Liozu SM. Value-based pricing special issue: editorial. J Revenue Pricing Manag. 2017;16(1):1–3.
- WHO guideline on country pharmaceutical pricing policies. [cited 2022. Apr 17]. Available from: https://www.who.int/publications/i/item/9789240011878.
- Prieto-Pinto L, Garzón-Orjuela N, Lasalvia P, et al. International experience in therapeutic value and value-based pricing: a rapid review of the literature. Value Health Reg Issues. 2020;23:37–48.
- Garrison LP, Towse A. Value-Based pricing and reimbursement in personalised healthcare: introduction to the basic health economics. JPM. 2017;7(3):10.
- Pearson SD, Ollendorf DA, Chapman RH. New cost-effectiveness methods to determine value-based prices for potential cures: what are the options? Value Health. 2019;22(6):656–660.
- Zheng H, Yin C, Hoang T, et al. Ebolavirus classification based on natural vectors. DNA Cell Biol. 2015;34(6):418–428.
- Beeching NJ, Fenech M, Houlihan CF. Ebola virus disease. BMJ. 2014;349:g7348.
- Weyer J, Grobbelaar A, Blumberg L. Ebola virus disease: history, epidemiology and outbreaks. Curr Infect Dis Rep. 2015;17(5):480.
- World Health Organization. Ebola virus disease. [cited 2021 October 12]. Available from: https://www.who.int/news-room/fact-sheets/detail/ebola-virus-disease.
- UNICEF, WHO, IFRC and MSF announce the establishment of a global Ebola vaccine stockpile. [cited 2021 October 16]. Available from: https://www.who.int/news/item/12-01-2021-unicef-who-ifrc-and-msf-announce-the-establishment-of-a-global-ebola-vaccine-stockpile.
- Obeng-Kusi M, Habila MA, Roe DJ, et al. Economic evaluation using dynamic transition modeling of Ebola virus vaccination in lower-and-middle-income countries. J Med Econ. 2021;24(sup1):1–13.
- Chowell G, Hengartner NW, Castillo-Chavez C, et al. The basic reproductive number of Ebola and the effects of public health measures: the cases of Congo and Uganda. J Theor Biol. 2004;229(1):119–126.
- Emerson J, Kim DD. Global Health CEA – DALY calculator. Center for the evaluation of value and risk in health, Tufts Medical Center, Boston, MA.; 2018. [cited 2021 Aug 9]. Available from: http://ghcearegistry.org/orchard/daly-calculator.
- Rivers CM, Lofgren ET, Marathe M, et al. Modeling the impact of interventions on an epidemic of Ebola in Sierra Leone and Liberia. PLOS Curr. 2014;6. DOI:10.1371/currents.outbreaks.4d41fe5d6c05e9df30ddce33c66d084c.
- Legrand J, Grais RF, Boelle PY, et al. Understanding the dynamics of Ebola epidemics. Epidemiol Infect. 2007;135(4):610–621.
- US consumer price index: medical care. [cited 2021 September 11]. Available from: https://ycharts.com/indicators/us_consumer_price_index_medical_care.
- Vogel G. Rapid test for Ebola now available. Science AAAS. 2015 [cited 2021 Aug 11]. Available from: https://www.sciencemag.org/news/2015/02/rapid-test-ebola-now-available.
- GEVIT_guidance_AppendixK.pdf. [cited 2021 August 6]. Available from: https://www.who.int/csr/resources/publications/ebola/GEVIT_guidance_AppendixK.pdf?ua=1.
- Ebola-vaccines-prices-11012021.pdf. [cited 2021 August 6]. Available from: https://www.unicef.org/supply/media/6956/file/Ebola-vaccines-prices-11012021.pdf.
- Bartsch SM, Gorham K, Lee BY. The cost of an Ebola case. Pathog Glob Health. 2015;109(1):4–9.
- Vos T, Allen C, Arora M, et al. Global, regional, and national incidence, prevalence, and years lived with disability for 310 diseases and injuries, 1990–2015: a systematic analysis for the global burden of disease study 2015. Lancet. 2016;388(10053):1545–1602.
- WHO guide for standardization of economic evaluations of immunization programmes. [cited 2022 Apr 30]. Available from: https://apps.who.int/iris/bitstream/handle/10665/329389/WHO-IVB-19.10-eng.pdf.
- Danzon P, Towse A, Mestre-Ferrandiz J. Value-based differential pricing: efficient prices for drugs in a global context. Health Econ. 2015;24(3):294–301.
- Daroudi R, Akbari Sari A, Nahvijou A, et al. Cost per DALY averted in low, middle- and high-income countries: evidence from the global burden of disease study to estimate the cost-effectiveness thresholds. Cost Eff Resour Alloc. 2021;19(1):7.
- Jit M. Informing global cost-effectiveness thresholds using country investment decisions: human papillomavirus vaccine introductions in 2006-2018. Value Health. 2021;24(1):61–66.
- Debellut F, Clark A, Pecenka C, et al. Re-evaluating the potential impact and cost-effectiveness of rotavirus vaccination in 73 Gavi countries: a modelling study. Lancet Global Health. 2019;7(12):e1664–e1674.
- Lomas J, Claxton K, Ochalek J. Accounting for country- and time-specific values in the economic evaluation of health-related projects relevant to low- and middle-income countries. Health Policy Plan. 2022;37(1):45–54.
- Dranitsaris G, Truter I, Lubbe MS, et al. The application of pharmacoeconomic modelling to estimate a value-based price for new cancer drugs. J Eval Clin Pract. 2012;18(2):343–351.
- Kaslow DC. Force of infection: a determinant of vaccine efficacy? NPJ Vaccines. 2021;6(1):1–7.
- Luyten J, Beutels P. The social value of vaccination programs: beyond cost-effectiveness. Health Aff. 2016;35(2):212–218.
- Delamater PL, Street EJ, Leslie TF, et al. Complexity of the basic reproduction number (R0) – volume 25, number. Emerg Infect Dis. 2019;25(1):1–4.
- Roberts M, Heesterbeek H. Bluff your way in epidemic models. Trends Microbiol. 1993;1(9):343–348.
- Drummond M, Barbieri M, Cook J, et al. Transferability of economic evaluations across jurisdictions: ISPOR good research practices task force report. Value Health. 2009;12(4):409–418.
- Obeng-Kusi M, Abraham I. Melanoma epidemiology: pivoting to low- and middle-income countries. JAMA Dermatol. 2022;158(5):489–491.