
ABSTRACT
This article explores the consequences of public and private spending on education at all levels, looking at skills and income inequality. We use data for 22 affluent democracies from 1960 or 1995 (depending on data availability) to 2017. High levels of public education spending consistently lower income inequality, both measured as wage dispersion and as the education premium. In contrast, higher levels of private education spending are associated with both higher wage dispersion and a higher education premium.
We show that this effect works in part through differential skills acquisition. Public education spending raises the math scores of 15-years old students at the mean and at the 25th percentile, but private education spending has no effect on skills at these levels. We find the same pattern among skills of adults; public education spending raises skills at the 25th percentile and the mean; private spending has no effect. Finally, we also show that higher levels of adult skills indeed depress the education premium.
Advanced post-industrial societies are leading the way in the transition to the knowledge economy, and the repercussions of this transition are felt in the developing world as well. That transition has economic and social consequences, some of which are contributing to enhanced human welfare, while others are not. Potentially beneficial consequences are enhanced productivity and economic growth. However, the realization of these benefits depends on an adequate supply of skills in the society to fill the new types of jobs. Moreover, even where the aggregate supply of skills is sufficient to generate economic growth, the transition is accompanied by undesirable effects in the form of increasing inequality and poverty due to unequal integration of individuals into the new labor market and due to changes in labor market institutions.
The problem of growing inequality has attracted much academic and political attention, and it has begun to direct more of this attention to comparative educational systems and education policy, an area traditionally neglected in welfare state research and in political science more generally (Gift & Wibbels, Citation2014). Most quantitative research in this area has looked at determinants of education expenditures, whereas comparative small-N studies have looked at dynamics of school reform and governance and at the relationship between skills formation and Varieties of Capitalism (Busemeyer & Trampusch, Citation2011; Gift & Wibbels, Citation2014). What has received less attention are the sources of education funding and the ways in which education funding is spent. In particular, the relative contribution of public and private sources to total education spending at different levels has not received much attention. The impact of different funding sources is important to understand because, to the extent that countries address the need for more skills by relying on private sources of funding, they may exacerbate inequality rather than reducing it.
Income inequality is shaped by many factors. It is in part a result of unequal integration into the labor market due to a mis-match between the demand for and the supply of skills. At the level of society, the greater this mismatch, the greater the education premium and therefore inequality in incomes (Card & Lemieux, Citation2001; Goldin & Katz, Citation2008). At the individual level, people with low skills have seen their job prospects and earnings potential shrink (Nickell, Citation2004). Thus, one might assume that higher levels of spending on education in a society will result in overall better skills and thus lower inequality because it will increase the supply of employees with high skills. However, it is well established that factors other than skills also shape market income distribution. Specifically, labor market institutions and politics have been shown to be powerful determinants of wage dispersion (Pontusson, Rueda, & Way, Citation2002; Rueda & Pontusson, Citation2000; Wallerstein, Citation1999). We intend to show that educational institutions also shape earnings inequality.
We aim to explain the role of public and private education funding in shaping aggregate educational achievements and skill levels, the returns to education, and their impact on income inequality. We shall proceed in two steps: First we show that public education expenditure is indeed associated with lower wage dispersion, whereas private education expenditure shows the opposite pattern – an association with greater wage dispersion. Then we attempt to demonstrate the mechanisms that mediate this relationship by focusing on the relationship between funding sources and educational outcomes in the form of skills, and on the impact of different skill levels and of different education funding sources on the education premium. For the first step, we can rely on sufficient data of good quality to carry out pooled cross-section analyses. For the second step we face major data constraints and in part have to rely on simple cross-sectional analyses.
Literature and hypotheses
The education requirements for personal and for societal success in the knowledge economy and the implications of educational efforts for inequality have become central themes in the policy literature at least since the publication of Goldin and Katz’s The Race Between Education and Technology (Citation2008). Much of the early quantitative literature on educational systems focused on educational expenditure, treating it as an indicator of societal commitment and as a tool to improve human capital (Castles, Citation1989). At the same time, the development of endogenous growth theory argued that investments in human capital increased economic growth. The early quantitative studies operationalized human capital with average years of education in the adult population drawing on the Barro-Lee data on education levels across time in almost every country in the world (Barro & Lee, Citation1997, Citation2001). At the same time, scholars began analyzing the limited data available on test scores as measures of actual skills (Barro Citation2001). Hanushek and Kimko (Citation2000) found that adding test scores to models with average years of education greatly increased the variation explained in subsequent economic growth. Hanushek and Woessmann (Citation2008), in an analysis of data for 50 countries over the period 1960–2000 found that quantity of schooling was significantly associated with economic growth in models without measures of cognitive skills but lost significance once cognitive skills were included in the model, and the adjusted R2 increased from .25 to .73, indicating a much stronger impact of the stock of human capital on economic growth than earlier quantitative studies.
Ideally, then, if we are interested in the consequences of educational expenditures, we should focus on how they shape the level and the distribution of skills in a society. It is no secret that education can be of highly differential quality, and access to educational institutions of different quality can be selective, which might result in a highly uneven distribution of skills. In addition, there are determinants of earnings capacity other than skills. Professional success and earnings capacity also depend heavily on conditions of access to well paying positions, and such access in turn is channeled through social networks that often have their roots in educational institutions. Thus, a succession of access to selective educational institutions, to social networks, and to well paying positions in the labor market may shape earnings inequality irrespective of skill distributions.
We would expect exclusively or predominantly public funding of schools to result in a more even distribution of funding per student, a more even student body social class composition, and thus a more evenly distributed quality of education than the coexistence of public and private funding. Parents who are willing to pay for private schooling demand (pay for) higher quality education, but studies question the differential effectiveness of private versus public education, once social composition is controlled for (Dronkers & Robert, Citation2008). What parents do get is a more socio-economically homogeneous student body and thus an avenue to social class reproduction (Dronkers & Avram, Citation2010). This is due to the fact that private funding entails private decisions on admissions, so parents’ socio-economic background is important for admission not just based on ability to pay but also based on ability to meet social admissions criteria. The reason for parental preference for a socio-economically homogenous student body may be academic in the sense of greater uniformity of academic preparation and support at home, or it may be social in the sense of preventing social mixing and investing in the cultural and social capital of their children (Zweigenhaft, Citation1993).
There are clear exceptions to the egalitarian nature of public funding where public funding is based on local property taxes, like in the United States. There are also limits to the egalitarian impact of public funding where high levels of residential segregation by socio-economic status or immigration status generate student populations with radically different backgrounds in terms of preparation for learning and family support for learning. This is becoming a growing problem in European societies with generally egalitarian funding of public education.
There is a third type of organization of education to be considered: publicly funded but privately run schools. The impact of this type of organization on equality of education and of professional access depends on the rules governing these schools, specifically their ability to levy additional fees and to discriminate in admissions. If they can levy additional fees and discriminate in admissions, their impact on the distribution of educational achievement and earnings capacity will be similar to that of privately funded and run schools. However, where they are subject to rules that prohibit social segregation, such as in Belgium and the Netherlands, they may not have an inegalitarian impact (Schlicht, Stadelmann-Steffen, & Freitag, Citation2010). In Sweden, the bourgeois government elected in 1991 passed legislation which allowed parents to send their children to private schools with a voucher. When the Social Democrats returned to power in 1994, they amended the legislation prohibiting schools from charging tuition or fees over and above the value of the voucher and also prohibiting them from having selective admissions criteria.
There is some preliminary evidence for the inegalitarian impact of private education expenditure. Busemeyer (Citation2015) found that the private share of education spending at all levels was positively related to the Gini of disposable household income in the period 1997–2008 in advanced industrial societies. In contrast, he found that public spending on all levels of education was negatively related to the Gini of disposable household income in the same country/year observations. Weisstanner and Armingeon (Citation2018) found that public expenditure on education depressed and private expenditures on education increased the education premium in 22 OECD countries between the early 1990s and 2014. In their analysis of top 1% income shares, Huber, Huo, and Stephens (Citation2018) found that the private share of total tertiary spending was strongly associated with greater top income shares.
We are going beyond these studies in two major ways. First, we analyze different measures of inequality, the 90:10 and 50:10 wage ratios. They measure pre-tax and transfer earnings and thus are more closely related to education and skills than the Gini of disposable household income, which is highly sensitive to household composition and the degree of welfare state redistribution. Moreover, they let us identify where in the income distribution the impact of different sources of education funding matters most. Second, we demonstrate that the mechanism that mediates the effect of different sources of education funding on earnings inequality is the skill formation in the society. We show that public education funding raises skill levels at the bottom and at the mean, whereas private education funding fails to do so. Finally, we show that higher skill levels in the society depress the education premium.
On the basis of extant knowledge and the above reflections on selective access to education and to positions in the labor market, we have the following expectations regarding the relationship between funding sources for education, skills, and earnings inequality. We expect public education spending to reduce inequality and private education spending to increase it, measured both as wage dispersion and the education premium. We expect public education spending to be particularly important for the lower half of the income distribution. We also expect public education spending to raise skills in the society and private education spending to have a weaker or no effect on skills, particularly at the lower end. Finally, we expect higher skill levels in a society to be associated with a lower education premium.
Sources of education spending are only one among many influences on the distribution of skills and the returns to skills in post-industrial societies. The literature has identified an affinity between education systems and welfare state regimes (Iversen & Stephens, Citation2008; Mosher, Citation2015; West & Niolai, Citation2013).Footnote1 Weisstanner and Armingeon (Citation2018) found that high average tax rates and high levels of spending other than on the elderly depressed the education premium. The embeddedness of education systems in welfare state regimes is important because high levels of poverty depress skills acquisition at the bottom. The sociology of education literature has firmly established the lasting negative consequences of disadvantaged family and community backgrounds for the educational success of children (Duncan, Boisjoly, & Harris, Citation2001; Fergusson, John Horwood, & Boden, Citation2008; van Ewijk & Sleegers, Citation2010). Accordingly, in our analysis of skills acquisition we shall include poverty levels in the society, and we expect high levels of poverty to depress skills acquisition.
Finally, in analyzing the education premium we include controls for the supply of and demand for highly educated workers, and for unemployment. Goldin and Katz (Citation2008) made a compelling case that inequality in the United States has increased because the country has lost the race between technology and education. That is, since the 1970s, the US has not invested enough in schooling to increase the supply of the high skilled to keep pace with increased demand due to skill biased technological change. It is reasonable to generalize the insight that this race shapes income distribution, specifically the skill premium. High levels of unemployment can be expected to drive up inequality by depressing wages at the bottom.
Data and measurement
We use data for 22 post-industrial democracies from 1960 on for our baseline model on wage dispersion and from 1995 on (depending on data availability) and until 2017 for the models with public and private education spending. The countries are Australia, Austria, Belgium, Canada, Denmark, Finland, France, Germany, Greece, Ireland, Italy, Japan, Luxembourg, Netherlands, New Zealand, Norway, Portugal, Spain, Sweden, Switzerland, United Kingdom, and the United States. Luxembourg falls out of all analyses except the analysis of the education premium (). Australia, Belgium, Greece, Portugal, and Switzerland lack usable data for skills in the PIACC studies. In addition, Japan, New Zealand, and Portugal lack LIS data on poverty from the Luxembourg Income Study (LIS).
Table 1. Variable definitions and sources.
Table 2. Determinants of wage dispersion (90–10 Ratio).
Table 3. Determinants of wage dispersion (50–10 ratio).
Table 4. PISA scores and public-private mix in education.
Table 5. PIAAC scores and public-private mix in education.
Table 6. Adult skills and the education premium.
Table 7. Private/public mix, vocational training, and the education premium.
Our first set of analyses focuses on the relationship between public and private education spending and the distribution of earnings both across the economy and for just the lower half of earners. The first dependent variable is the ratio of gross earnings received by an individual at the 90th percentile of earnings to the gross earnings received by an individual at the 10th percentile. While this measure allows us to investigate the relationship between our independent variables and income inequality across most of the income distribution, our second dependent variable, the ratio between the gross earnings of an individual at the 50th and 10th percentile of earnings, enables us to focus our analysis on the effect of skills and education funding further down the income distribution, where we expect the effect of public education spending to be particularly strong. We use the OECD wage dispersion database to establish our basic finding because it contains over four times as many observations as the LIS database, the alternative source for data on market personal income.
We measure the distribution of skills among students with results from the Programme for International Student Assessment (PISA) which is run by the Organization for Economic Co-operation and Development (OECD). The PISA tests are given triennially to 15-year-olds across the OECD along with several partner countries to evaluate reading literacy, mathematical literacy, and scientific literacy. The scores are then standardized to have an OECD average of 500 with about two-thirds of scores between 400 and 600. For the purposes of this article we use only the country mean score and 25th percentile score in mathematical literacy for our pooled-cross sectional analysis (OECD multiple years), which give us a measure for the central tendency of skill distribution and a measure of performance for low academic achievers. We use mathematical skills, because, as Hanushek, Schwerdt, Wiederhold, and Woessmann (Citation2015) note with regard to PIAAC, they are generally more comparable cross-nationally than literacy skills.
We measure the distribution of skills among the adult population with scores from the Programme for the International Assessment of Adult Competencies (PIAAC) operated by the OECD. The PIAAC tests, unlike the PISA tests, are given to a nationally representative sample of adults (16–65), and they are designed to measure three broad categories of skills: literacy, numeracy, and problem solving in technology rich environments (OECD, Citation2013b). We only have PIAAC data from a single wave and we mainly use the numeracy scores, adjusted for literacy related non-responses, for the reasons just mentioned. We only use literacy scores in one model and we do not use the problem solving scores because they are the most weakly related to income of the three tests (Hanushek et al., Citation2015).
Our final dependent variable is the wage premium to education. Calculated by Weisstanner and Armingeon (Citation2018) using Luxembourg Income Study (LIS) data, this variable is the percentage difference between the median wage of full-time workers with tertiary education and the median wage of individuals without tertiary education (pre-tax).Footnote2 Because LIS is carried out in waves and not all countries provided information in each wave, the number of observations of this variable varies by country. For most countries, we have data from the early 1990s through 2013, with an average of just under seven observations per country for which data were provided. Data were not available for Japan, New Zealand, and Portugal.Footnote3
The primary independent variables of interest for this article are indicators of education expenditure and the distinction between public and private sources of education expenditure. We use total education spending, public education spending, and private education spending, all as a percent of GDP. The data breaking down education expenditure into public and private begin between 1995 and 1997. We look at funding sources rather than enrollment in public versus private schools because of the wide variation of the rules under which private schools operate. We also capture public human capital spending, which includes public education spending, daycare spending, and active labor market policy spending as a percent of GDP. The inclusion of this measure reflects the necessity of investigating in education as a part of a cluster of social policies (Iversen & Stephens, Citation2008; Mosher, Citation2015). The sources and a description of these variables, as well as all other variables, are presented in .
As noted, we control for the effect of poverty on skill levels. We capture poverty with the percentage of households headed by individuals of working age (18–65) below 50% of median disposable household income, and we assess its impact on skills acquisition of 15-year old students. We calculated poverty level with micro-data from LIS and Eurostat’s Statistics on Income and Living Conditions surveys (SILC, Citationn.d.). We also measure the same concept of poverty as the average of poverty levels in the 1980s, when the younger cohorts among the adults in the PIAAC study were growing up, and we assess its impact on skills of these adults. Skills in the adult population are measured by numeracy scores from PIAAC, as explained above.
The distribution of wages is also a product of labor market and political institutions in addition to individual skill levels. As such, we control, when possible with the number of observations available, for other important political and economic factors. One such variable is the degree of fragmentation in wage coordination (Visser, Citation2019; Wallerstein, Citation1999). Higher values indicate more centralization, ranging from the level of individual firms to economy-wide wage setting, with the literature consistently finding that more centralized systems of wage coordination are associated with less wage inequality. The strength of unions also plays a strong role in conditioning the distribution of wages across the economy, which we operationalize as union density, net union membership as a percent of employed wage and salary earners (Pontusson et al., Citation2002; Visser, Citation2019). We also control for the history of leftist government with the cumulative proportion of seats of parties in government belonging to left parties as these parties have programmatic commitments to create more egalitarian economic outcomes (Brady, Citation2009; Huber & Stephens, Citation2001; Pontusson et al., Citation2002; Stephens, Citation1979).
The education premium should be shaped by the relationship between demand for and supply of educated workers. We measure the demand for educated workers with total factor productivity, an indicator of technological advancement. We measure the supply of educated workers with the percentage of the population with at least some tertiary education. Since unemployment affects disproportionately workers with low education, and unemployment depresses wages of workers with high risk of unemployment, high levels of unemployment can be expected to be associated with an increase in the education premium. We measure unemployment as the percentage of the population of working age who, in the reference period: are without work; are available for work; and have taken specific steps to find work.
Statistical estimation
For the cross sectional data, we estimate the models with OLS (ordinary least squares) regressions. Statistical methodologists (e.g. Plümper, Troeger, and Manow Citation2005, p. 329; Hicks Citation1994, p. 172) identify four problems with OLS estimation posed by the non independence of observations in pooled time series: (1) errors are serially correlated, (2) errors are cross-sectionally heteroskedastic, (3) errors tend to be correlated across units due common shocks, and (4) errors tend to be autocorrelated and heteroskedastic at the same time. To deal with these problems, Beck and Katz (Citation1995,Citation1996) recommend addition of unit and period dummies and a lagged dependent variable to the right hand side of the equation, calculation of panel corrected standard errors (PCSE), and imposition of a common rho for all cross-sections. Plümper et al. (Citation2005) note that this set up, which they call the ‘Beck-Katz standard,’ does effectively deal with all four problems, but, unfortunately, introduces some of its own problems. Following Achen (2000), they argue that the lagged dependent variable can absorb most of the theoretically interesting time series variance in many pooled time series datasets. Indeed, this is true of our data: The lagged dependent variable alone explains 94% of the variation in the data; the addition of the period dummies raises this to 95% while the introduction of all of the theoretically interesting variables adds nothing to the variation explained.
Our solution is to deal with serial correlation by correcting for first order auto-regressiveness rather than by inclusion of a lagged dependent variable. Beck and Katz (Beck & Katz, Citation2004, Citation2011) have shown that correcting for first order auto-regressiveness (ar1 corrections) actually does include a lagged dependent variable on the right hand side of the equation (PCSE and ar1 corrections are known as Prais Winsten estimations). Thus, it does deal with the problem of serial correlation but without, as our results show, suppressing the power of other independent variables.
We estimate our Prais Winsten models in Stata 14.2 using Vernby and Lindgren's (Citation2009) dvgreg package. Dvgreg is specifically designed to estimate dynamic panel data models with gaps in the dependent variable but complete or nearly complete data on the independent variables. It generates an estimate of the value of the dependent variable at t-1 for each gap, based on the values of the dependent variable at the previous actual observation and the values of the independent variables. This then makes it possible to derive a corrected estimate of AR1. We use Vernby and Lindgren’s modification of Prais Winsten estimation when the data are pooled time series data, that is, when wage dispersion, education premium, or Pisa scores are the dependent variables. As mentioned, when the data are cross sectional, we use ordinary least squares regression.
We hypothesize that most of our causes operate over long periods of time and changes in the dependent variables occur gradually, a case of cumulative causes in Pierson’s (Citation2003, p. 198) typology of causes and effects. Thus, it is appropriate to measure the dependent and independent variables as levels. Moreover, in almost all pooled time series studies of the determinants of inequality, regardless of whether it is measured by wage dispersion, the Gini coefficient of household income, or top income shares, the dependent variable is measured as a level. This is another reason to measure the dependent and independent variables as levels.Footnote4 This raises the issue of whether the series are stationary. A Fisher test for unit roots shows that the series are stationary.
In order to control for common economic shocks, such as oil price increases or global economic cycles, we include period dummies. The periods selected are the latter part of the Golden Age of post war growth (1960–1972), oil shocks and stagflation of the seventies (1973–1979), the period of deregulation up to the introduction of the single European market (1980–1992), the global financial crisis (2008–2012) and the post-crisis period (2013–2017). The reference period is 1993–2007, the transition to the knowledge economy.
Results
We begin with an analysis of the determinants of wage dispersion between the top and the bottom of the income distribution, the ratio of gross earnings of a full time worker at the 90th percentile to those of a worker at the 10th percentile (). We then compare these results with the ratio of gross earnings of a full time worker at the 50th percentile to those of a worker at the 10th percentile (). Model 1 is our baseline with the three variables that have consistently been shown to be significant predictors of wage dispersion: union density, wage coordination, and left government (Pontusson et al., Citation2002). In model 2 we introduce total education spending and drop left government, because left government is a cause of public education spending (Ansell, Citation2010). Total education spending has no effect on wage dispersion. In model 3 we replace total education spending with public and private education spending. We find that higher levels of public education spending are associated with lower wage dispersion between both the top and bottom and the middle and the bottom, whereas higher levels of private education spending are associated with greater levels of wage dispersion.
Given that the standard deviation of the 90:10 ratio is larger than the standard deviation of the 50:10 ratio, we cannot compare the unstandardized coefficients in the two tables. In order to deal with this problem, we standardized both dependent variables and then reran model 3 for each dependent variable. The negative coefficient of public spending is 68% larger and the coefficient of the inequality enhancing private spending is 23% larger for the 50:10 ratio compared to the 90:10 ratio, but these differences fall somewhat short of statistical significance. In model 4 we replace public education spending with public human capital spending, which includes spending on day care and on active labor market policies together with public spending on education at all levels. We find that total human capital spending also depresses wage dispersion and that the coefficient again is larger at the bottom of the income distribution, by 48% in the models with the standardized dependent variables. The impact of private education spending remains significant and increases earnings dispersion. We cautiously interpret these consistent differences as suggesting that public spending is particularly beneficial, and conversely, heavy reliance on private education funding has particularly detrimental effects for workers at the bottom of the income distribution.
In we investigate the effects of public and private education spending on the scores of 15-year old students on the test of mathematical skills. These are the aggregate national level scores for all the waves of the PISA tests conducted between 2000 and 2015. The reason for focusing on math scores rather than literacy scores is that they are more comparable across countries than the literacy scores. Moreover, as we shall show later, math skills among adults are more significant for earnings potentials than literacy skills. We focus on the mean scores and on the scores at the 25th percentile. Since we would not expect the level of education expenditure in the year of observation to shape the test scores of students, we use the cumulative average of education spending, for both public and private spending, from 1990 and 1995 to the year of the test score observation.
We find that public education spending raises the math scores of students at the 25th percentile and the mean, but that private education spending is insignificant for scores at both the 25th percentile and the mean. The substantive effect of public education spending is greater for scores at the 25th percentile than the mean. One standard deviation in public education spending raises test scores by 9.3 points at the 25th percentile and 4.9 points at the mean. This finding supports the contention that public funding of education is crucial for lifting up the academically lower achieving groups.
In previous work, we have shown that poverty among the parental generation depresses skill acquisition among children (Huber and Stephens Citation2015). Accordingly, in models 2 and 4 we introduce poverty among households headed by a working age adult. Poverty has a highly significant depressing effect on scores at both levels. Moreover, once we control for poverty, education spending becomes insignificant in both models. These findings underline the importance of social policy context for the effectiveness of public education spending.
displays the results of our analysis of the relationship between cumulative average education expenditures, poverty in the parents’ generation, and skill levels among adults. Unfortunately, data here are even scarcer than for the skill levels of 15-year olds. Essentially, the only recent study is the PIAAC survey, conducted under the auspices of the Organization for Economic Cooperation and Development in 2011–2012. The study covered 24 countries, including 15 of the advanced industrial democracies under analysis here. There are problems with the data because of considerable differences in literacy related non-responses. The data we use here are calculated to adjust for these non-responses, following the method used by the OECD to adjust the published mean scores. The data for Belgium could not be properly adjusted and therefore are omitted. We are analyzing scores at the 25th percentile and the mean, and we compare the effect of public to the effect of private education spending. We use the average of education spending from the beginning of the data (1995) to 2010. We control for poverty levels when the adults being tested were of school age. At both skill levels, the impact of public education spending is significant and the impact of private education spending is not statistically significant. As expected, poverty levels in their youth have a highly significant negative effect on skill levels among adults. Nevertheless, the effect of public education spending remains significant once we introduce the poverty controls. Public education spending has been crucial for building skills at the bottom and the mean, whereas private education spending has failed to make a contribution to skills at these levels.
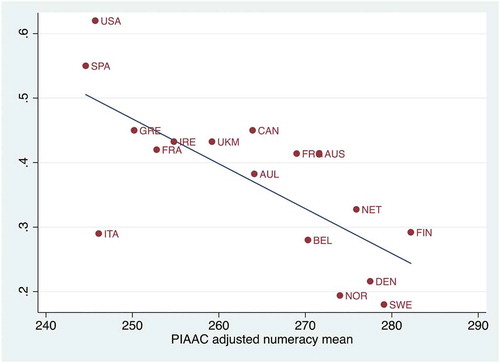
Our next step is to assess the impact of skills on the returns to education. Here we use skill levels among the adult population, since much can happen to skill formation after age 15, when the PISA tests are done. The scatterplot in makes clear that Italy is a big outlier, having an education premium much lower than one would expect given the low numeracy level. Accordingly, we delete Italy from our regressions. As models 1 and 2 in demonstrate, the numeracy mean and the literacy mean both depress the education premium. Numeracy skills emerge as more important, however, because the variation explained is more than 50 percent larger. A difference in variation explained persists once we introduce union density, the single most important determinant of wage dispersion, in models 3 and 4. Comparing models 5, 6, 7, 3, and 8, we can see that the skill levels at the very bottom, the 5th percentile, do not affect the education premium, and skill levels at the 10th percentile, while statistically significant, explain less of the variation than skill levels at the 25th, 50th, and 75th percentile. So, it is in the broad middle, between the 25th and the 75th percentile, that the quality of skills reduces the difference in income between adults with and without tertiary education.
Figure 1. Education premium and mean numeracy.
Our final step is to connect different patterns of education funding to the education premium. The education premium is closer to education in the causal chain between sources of education funding and earnings inequality than wage dispersion. In and we already established the connection between education funding and wage dispersion; here we are filling in one step in the causal chain. Models 1 to 3 in show that public education expenditure is associated with a reduction of the education premium, whereas private education expenditure is associated with an increase of the education premium. This result confirms the importance of public versus private education spending for the gap between earnings of those with and without tertiary education.
Conclusion
We have shown repeatedly that the sources of education funding matter for income inequality. High levels of public education spending consistently lower income inequality, both measured as wage dispersion and as the education premium. In contrast, higher levels of private education spending increase both wage dispersion and the education premium.
We have also shown that this effect works in part through differential skills acquisition. Public education spending raises the math scores of 15-year old students at the mean and at the 25th percentile, but private education spending has no significant effect. Moreover, the substantive effect of public education spending is greater on skills at the 25th percentile than for the mean. This underlines how crucial public education spending is for the academically weaker groups. We have seen the same pattern in the relationship between education spending and skills among adults. Public education spending has a strong positive impact on adult skills at the 25th percentile and the mean, and private education spending has no significant effect.
We have then shown that higher levels of adult skills indeed depress the education premium. This effect is weaker at the very bottom than between the 25th and the 75th percentiles. Given that we have data for only 13 countries for this analysis, the result is more suggestive than conclusive, but it replicates a result found by Hanushek et al. (Citation2015).
Finally, we have shown that the education premium is shaped in a similar fashion as wage dispersion and skills acquisition: Public education spending reduces the education premium, and private education spending in contrast drives up the education premium.
In short, if societal success in the knowledge economy is understood not just as economic growth but also equity in the sense of equitable improvement of skills at all levels, including the bottom, then more education spending regardless of its source is not the solution. Rather, it matters where that spending is coming from. Higher reliance on private spending creates greater room for social selectivity, both in access to educational opportunities and to careers. It has a particularly pernicious effect for those at the lower end of the academic and social scale. In contrast, higher levels of public education spending raise skills at all levels and reduce returns to education and ultimately earnings inequality.
Disclosure statement
No potential conflict of interest was reported by the authors.
Additional information
Funding
Notes on contributors
Evelyne Huber
Evelyne Huber is Morehead Alumni Distinguished Professor of Political Science at the University of North Carolina, Chapel Hill. She studies democratization and redistribution in Latin America and post-industrial democracies. She is the author and co-author of several books, three of which have won book awards. She received an Honorary Doctorate in the Social Sciences from the University of Bern, Switzerland, in 2010.
Jacob Gunderson
Jacob Gunderson is a doctoral student in the Political Science Department at the University of North Carolina, Chapel Hill. His research focuses on political economy and party competition in developed democracies.
John D. Stephens
John D. Stephens is Lenski Distinguished Professor of Political Science and Sociology and Director, Center for European Studies, University of North Carolina, Chapel Hill. He is the author or co-author of five books including the award-winning Capitalist Development and Democracy (with Evelyne Huber and Dietrich Rueschemeyer, 1992), Development and Crisis of the Welfare State(2001), and Democracy and the Left (2012, both with Evelyne Huber).
Notes
1 Given the affinity between welfare state regimes and education systems, it is not surprising that the findings on the political origins of different sources of education funding parallel those of the literature on the political origins of welfare states. Ansell (Citation2010) finds a powerful positive effect of left-wing control of government on public education spending. Wolf’s (Citation2009) findings confirm the partisan effects, identifying Conservative and Christian Center parties as sources of lower public shares of education funding.
2 Weisstanner and Armingeon’s education premium measure calculated from LIS data is highly correlated (r=.91) to Hanushek’s measure of skill returns calculated from the PIAAC data, which gives one great confidence in the validity of the measure.
3 Because not all states provide data on pre-tax income, full-time status, or education, certain cases have special calculation procedures. For information on these cases, see Weisstanner and Armingeon (Citation2018).
4 For this reason, error correction estimation in which the dependent variable is measured as a first difference is not an appropriate technique to model the hypothesized causal processes.
References
- Ansell, B. W. (2010). From the ballot to the blackboard: The redistributive political economy of education. Cambridge: Cambridge University Press.
- Barro, R. J. (2001). Human capital and growth. The American Economic Review, 91(2), 12–17.
- Barro, R. J., & Lee, J.-W. (1997). Determinants of schooling quality (unpublished). Harvard University.
- Barro, R. J., & Lee, J.-W. (2001). International data on educational attainment: Updates and implications. Oxford Economic Papers, 53(3), 541–563.
- Beck, N. (1995). What to do (and not to do) with time-series and cross-section data. American Political Science Review, 89(3), 634–647.
- Beck, N., & Katz, J. (1996). Nuisance vs. substance: Specifying and estimating time-series-cross-section models. Political Analysis 6(1), 1–36
- Beck, N., & Katz, J. (2004). Time-series-cross-section issues: Dynamics, 2004. Presented at the Annual Meeting of the Society for Political Methodology, Stanford, CA: Stanford University.
- Beck, N., & Katz, J. (2011). Modeling dynamics in time-series-cross-section political economy data. Annual Review of Political Science, 14, 331–352.
- Brady, D. (2009). Rich democracies, poor people: How politics explain poverty. New York: Oxford University Press.
- Brady, D., Huber, E., & Stephens, J. D. (2014). Comparative welfare states data set, University of North Carolina and WZB Berlin social science center.
- Busemeyer, M. R. (2015). Skills and inequality: Partisan politics and the political economy of education reforms in western welfare states. Cambridge: Cambridge University Press.
- Busemeyer, M. R., & Trampusch, C. (2011). Comparative political science and the study of education. British Journal of Political Science, 41(2), 413–443.
- Card, D., & Lemieux, T. (2001). Can falling supply explain the rising return to college for younger men? A cohort-based analysis. The Quarterly Journal of Economics, 116(2), 705–746.
- Castles, F. G. (1989). Explaining public education expenditure in OECD nations. European Journal of Political Research, 17(4), 431–448.
- Dronkers, J., & Avram, S. (2010). A cross-national analysis of the relations between school choice and effectiveness differences between private-independent and public schools. Riron to Hoho/Sociological Theory and Methods, 25(2), 183–205.
- Dronkers, J., & Robert, P. (2008). School choice in the light of the effectiveness differences of various types of public and private schools in 19 OECD countries. Journal of School Choice, 2(3), 260–301.
- Duncan, G. J., Boisjoly, J., & Harris, K. M. (2001). Sibling, peer, neighbor, and schoolmate correlations as indicators of the importance of context for adolescent development. Demography, 38, 437–447.
- Fergusson, D. M., John Horwood, L., & Boden, J. M. (2008). The transmission of social inequality: Examination of the linkages between family socioeconomic status in childhood and educational achievement in young adulthood. Research in Social Stratification and Mobility, 26, 277–295.
- Gift, T., & Wibbels, E. (2014). Reading, writing, and the regrettable status of education research in comparative politics. Annual Review of Political Science, 17, 291–312.
- Goldin, C., & Katz, L. F. (2008). The race between education and technology. Cambridge: Belknap Press of Harvard University Press.
- Hanushek, E. A., G. Schwerdt, S. Wiederhold & L. Woessmann. (2015). Returns to skills around the world: Evidence from PIAAC. European Economic Review, 73, 103–130.
- Hanushek, E. A., & Kimko, D. D. (2000). Schooling, labor-force quality, and the growth of nations. The American Economic Review, 90(5), 1184–1208.
- Hanushek, E. A., & Woessmann, L. (2008). The role of cognitive skills in economic development. Journal of Economic Literature, 46(3), 607–668.
- Hicks, A. (1994). Introduction to pooling. In A. Hicks & T. Janoski (Eds.), The comparative political economy of the welfare state. New York: Cambridge University Press.
- Huber, E., & Stephens, J. D. (2001). Development and crisis of the welfare state: Parties and policies in global markets. Chicago: University of Chicago Press.
- Huber, E., & Stephens, J. D. (2015). Predistribution and redistribution: Alternative or complementary policies. In C. Chwalisz & P. Diamond (Eds.), The predistribution agenda. London: I.B. Tauris.
- Huber, E., Huo, J., & Stephens, J. D. (2018). Power, policy, and top income shares. Socio-Economic Review. doi:10.1093/ser/mwx027
- Iversen, T., & Stephens, J. D. (2008). Partisan politics, the welfare state, and three worlds of capital formation. Comparative Political Studies, 41(4/5), 600–637.
- Mosher, J. S. (2015). Education state, welfare capitalism regimes, and politics. Comparative European Politics, 13(2), 240–262.
- Nickell, S. (2004). Poverty and worklessness in Britain. The Economic Journal, 114, C1–C25.
- OECD. (1998). Education at a glance: OECD indicators. Paris: Author.
- OECD. (2000). Education at a glance: OECD indicators. Paris: Author.
- OECD. (2001). Education at a glance: OECD indicators. Paris: Author.
- OECD. (2002). Education at a glance: OECD indicators. Paris: Author.
- OECD. (2003a). Education at a glance: OECD indicators. Paris: Author.
- OECD. (2003b). Literacy skills for the world of tomorrow: Further results from PISA 2000. Paris: Author.
- OECD. (2004a). Education at a glance: OECD indicators. Paris: Author.
- OECD. (2004b). Learning for tomorrow’s world: First results from PISA 2003. Paris: Author.
- OECD. (2005). Education at a glance: OECD indicators. Paris: Author.
- OECD. (2006). Education at a glance: OECD indicators. Paris: Author.
- OECD. (2007a). Education at a glance: OECD indicators. Paris: Author.
- OECD. (2007b). PISA 2006: Science competencies for tomorrow’s world (Vol. 1). Paris: Author.
- OECD. (2008). Education at a glance: OECD indicators. Paris: Author.
- OECD. (2009). Education at a glance: OECD indicators. Paris: Author.
- OECD. (2010a). Education at a glance: OECD indicators. Paris: Author.
- OECD. (2010b). PISA 2009 results: What students know and can do: Student performance in reading, mathematics and science (Vol. 1). Paris: Author.
- OECD. (2011). Education at a glance: OECD indicators. Paris: Author.
- OECD. (2012). Education at a glance: OECD indicators. Paris: Author.
- OECD. (2013a). Education at a glance: OECD indicators. Paris: Author.
- OECD. (2013b). OECD skills outlook 2013: First results from the survey of adult skills. Paris: Author.
- OECD. (2014a). Education at a glance: OECD indicators. Paris: Author.
- OECD. (2014b). PISA 2012 results: What studens know and can do: Student performance in mathematics, reading and science (Vol. 1). Paris: Author.
- OECD. (2015). Education at a glance: OECD indicators. Paris: Author.
- OECD. (2016a). Education at a glance: OECD indicators. Paris: Author.
- OECD. (2016b). Pisa 2015 results: Excellence and equity in education (Vol. 1). Paris: Author.
- OECD. (2017). Education at a glance: OECD indicators. Paris: Author.
- Pierson, P. (2003). Big, slow-moving, and … invisible: Macrosocial processes in the study of comparative politics. In J. Mahoney & D. Rueschemeyer (Eds.), Comparative historical analysis in the social sciences (pp. 177–207). Cambridge: Cambridge University Press.
- Plümper, T., V. Troeger & P. Manow. (2005). Panel data analysis in comparative politics: linking method to theory. European Journal of Political Research, 44(2), 327–54.
- Pontusson, J., Rueda, D., & Way, C. R. (2002). Comparative political economy of wage distribution: The role of partisanship and labor market institutions. British Journal of Political Science, 32(2), 281–308.
- Rueda, D., & Pontusson, J. (2000). Wage inequality and varieties of capitalism. World Politics, 52(3), 350–383.
- Schlicht, R., Stadelmann-Steffen, I., & Freitag, M. (2010). Educational inequality in the EU. European Union Politics, 11(1), 29–59.
- SILC. n.d. Eurostat, statistics on income and living conditions. Retrieved from https://ec.europa.eu/eurostat/statistics-explained/index.php/EU_statistics_on_income_and_living_conditions_(EU-SILC)_methodology_–_data_collection
- Stephens, J. D. (1979). The transition from capitalism to socialism. London: Macmillan.
- van Ewijk, R., & Sleegers, P. (2010). The effect of peer socioeconomic status on student achievement: A meta-analysis. Educational Research Review, 5, 134–150.
- Vernby, K., & Lindgren, K.-O. (2009). Estimating dynamic panel models when there are gaps in the dependent variable. Uppsala Universitet, Department of Government Studies in Political Economy and Welfare Working Paper Series 1.
- Visser, J. (2019). ICTWSS: Database on institutional characteristics of trade unions, version 6.0, wage setting, state intervention and social pacts in 34 countries between 1960 and 2018. Amsterdam, Netherlands: University of Amsterdam.
- Wallerstein, M. (1999). Wage-setting institutions and pay inequality in advanced industrial societies. American Journal of Political Science, 43(3), 649–680.
- Weisstanner, D., & Armingeon, K. (2018). How redistributive policies reduce market inequality: Education premiums in 22 OECD countries. Socio-Economic Review. doi:10.1093/ser/mwy018
- West, A., & Niolai, R. (2013). Welfare regimes and education regimes: Equality of opportunity and expenditure in the EU (and US). Journal of Social Policy, 42(3), 469–493.
- Wolf, F. (2009). The division of labour in education funding: A cross-national comparison of public and private education expenditure in 28 OECD countries. Acta Politica, 44, 50–73.
- Zweigenhaft, R. L. (1993). Accumulation of cultural and social capital: The differing college careers of prep school and public school graduates. Sociological Spectrum, 13(3), 276–365.