ABSTRACT
Reaching the goal of the Paris Agreement will not be possible without a deep decarbonization of the passenger transport sector. In emerging economies experiencing rapid economic growth and social transformations, and large-scale development of urban areas and associated infrastructure, opportunities and challenges exist when considering a broader set of mitigation options. In this paper, we apply the Deep Decarbonization Pathways (DDP) approach to develop and report scenarios on the passenger transport sector in Brazil, India, Indonesia, and South Africa. This approach supports an increase in the sectoral ambition of covering all drivers of change in transport mobility and facilitating collective comparison and policy discussions on the barriers and enablers of transitions. The scenario analysis illustrates that all four countries can achieve reductions in emissions per passenger kilometres of 59% and up to 92% by 2050 while meeting growing mobility needs. Lastly, the analysis identifies short-term policy needed to address barriers and promote enablers.
Key policy insights
The scenarios produced in this paper provide targets and guidance, up to 2050, on required ambition in this sector over coming decades.
While current national policies are often limited to introducing low-carbon vehicles and fuels, these pathways suggest the important role of a wide spectrum of mitigation options, including systemic measures related to demand-side options.
These scenarios suggest that targeted land-use, social, and urban policies could reduce distances between activities, the costs of mobility and time, thereby improving quality of life and supporting the shift to non-motorized and public transport. They highlight a lack of policies to improve the quality of public transport in terms of time and comfort, not only in terms of cost, to avoid a car dependency model with its externalities.
Long-term pathways can help support the development of policy-relevant dialogues about barriers and enablers for the transition, thereby supporting the reinforcement of short-term actions and goals.
1. Introduction
In 2019, the transport sector accounted for 23% of total CO2 emissions from energy and industrial processes, with passenger cars at 9%, or just over 3 GtCO2 (IEA NZ, Citation2021). According to the IEA’s Net Zero Emission (NZE) scenario by 2050, passenger car emissions need to decrease by 11% per year for the next 30 years.
The recent emissions reduction in 2020 due to the COVID19 pandemic masks what has been a continuous rise in transport emissions of 85% since 1990, reflecting a high dependency on fossil fuels and a continuous increase in mobility demand. Recent estimates for 2021 suggest that transport emissions are likely to rebound to levels close to 2019 levels (IEA GER, Citation2021).
Current policy pledges by countries through their Nationally Determined Contributions (NDCs) submissions are insufficient to bend the transport emission curve downwards (OECD/ITF, Citation2021). Under current policies, the IEA’s Stated Policies Scenario (STEPS) estimates that transport emissions will continue to increase, by 8% in 2030 and 11% by 2050, relative to 2019. Nevertheless, this trend is reversed when existing net-zero pledges are considered; under the IEA’s Announced Pledges Scenario (APS), reductions of 6% in 2030 and 24% in 2050 are estimated (IEA NZ, Citation2021). However, this still only delivers a quarter of the reductions necessary by 2050.
It is critical that future NDCs are significantly more ambitious overall, and specifically for the transport sector.Footnote1 According to OECD/ITF (Citation2021), only 16% of the NDCs submitted by October 2021 included transport emission reduction targets, with the vast majority of measures discussed focusing only on reducing fuel consumption, developing low-carbon fuels, and electric vehicles. NDCs also need to be developed in conjunction with long-term low GHG emission development strategies, so that the ambition level is commensurate with what is needed to reach net-zero in 2050 (Waisman et al., Citation2019). Currently, 50 countries have submitted such long-term strategies (UNFCCC, Citation2022), providing coverage for more than 40% of global CO2 emissions (IEA NZ, Citation2021), and only 10 countries mentioned a 2050 transport targets (SLOCAT, Citation2021a). This low level of LTSs risks new NDCs being developed that are not sufficiently ambitious to account for necessary long term ambition.
Reaching the goal of the Paris Agreement will not be possible without a push in the transport sector. In emerging countries, and even more than in the rest of the world, the decarbonization transformations will have to go hand in hand with the required socio-economic development of the populations and access to mobility. In exploring low carbon transport futures, recent research suggests that two key aspects need to be considered to increase ambition in the sector. Firstly, that scenarios cover the broad spectrum of mitigation options, and secondly, are able to inform short-term needs for policy (IPCC, Citation2018; Lefevre et al., Citation2020).
On the first point, an increase in ambition requires all aspects of transport demand to be understood in order to identify a plurality of options. Most NDCs currently focus on technological measures; however, demand side options, such as avoiding trips, shifting to public transport, or sharing transport systems are equally important (Creutzig, Citation2016; Creutzig et al., Citation2018). Increasingly, studies have stressed and demonstrated the importance of demand side measures in decarbonization strategies in general (Barrett et al., Citation2022; Pye et al., Citation2021; Sharmina et al., Citation2021; Wachsmuth & Duscha, Citation2019) and for transport (Brand et al., Citation2019; Briand et al., Citation2017; Kainuma et al., Citation2017; Pye & Li, Citation2017; Tovilla & Buira, Citation2017). Lefevre et al. (Citation2020) demonstrated the importance of capturing the broad spectrum of mitigation options and the role that demand-side transformations could play in several countries: Mexico, Japan, France, and the UK.
On the second point, stronger ambition and the need for rapid implementation requires that scenarios are able to inform the decision-making community on short-term actions consistent with long term goals. However, current energy models often fail to provide insight on key enabling conditions needed for the transformation, like the social drivers of mode choice, institutional capacity, or the balance between actors’ interests. Lefevre et al. (Citation2020) argues that a different approach is required for improved engagement with decision-makers and implementation with all actors. It introduces a mixed qualitative-quantitative approach, which makes explicit many of the assumptions embedded in narratives, allowing for improved understanding of short-term policy barriers and enablers to help strengthen the response. Such assumptions may include barriers and enablers related to geophysical, environmental-ecological, technological, economic, and especially institutional and socio-cultural factors (IPCC SPM, Citation2022).
In this paper, we use the Deep Decarbonization Pathways (DDP) approach described in Waisman et al. (Citation2019), and adapted to passenger transport in Lefevre et al. (Citation2020), developed to tackle these methodological challenges. This framework has been used to develop and compare economy-wide and transport-specific long-term scenarios for selected countries (Bataille et al., Citation2016a, Citation2020; Godinez-Zamora et al., Citation2020; Godoy et al., Citation2021; Gupta, Citation2020; Vasconcelos Goes et al., Citation2020; Villamar et al., Citation2021). This paper aims to focus and demonstrate how comparable long-term deep decarbonization scenarios built with the support of the DDP framework can help identify common cross-country national barriers and enhance the discussion on national and international policy action. While our focus is on the transport sector, the DDP approach also highlights the importance of whole systems analysis, taking account of the linkage and feedbacks between transport and other sectors, which are captured in the modelling undertaken here (Boer et al., Citation2021; Garg et al., Citation2021; La Rovere et al., Citation2021; Trollip, Citation2021).
In the next section of this paper, we describe the method employed in more detail before providing a country-intercomparison of the transport scenarios in section three. Based on this multi-country scenario analyses, the following section four presents two key aspects of national transformation and discusses some associated barriers and potential enablers. We conclude with recommendations for country policy-makers, and new avenues for research.
2. Methods
The global carbon neutrality goal requires countries to go beyond incremental transformations, often resulting from past trends, to consider systemic transformations with ‘rapid and far-reaching transitions in energy, land, urban and infrastructure (including transport and buildings), and industrial systems’ (IPCC, Citation2018). To assess how to meet this challenge, a backcasting approach from 2050 helps to identify the short-term actions and necessary structural changes to meet mid-century development objectives and emissions neutrality. Such an approach is derived from methodological lessons learned from the Deep Decarbonization Pathways Project (SDSN and IDDRI, Citation2015; Bataille et al., Citation2016b).
The DDP design framework (See Annex 1) is an iterative and backcasting framework, which aims to support national research teams in the development of consistent, actionable, and comparable national and sectoral pathways compatible with carbon neutrality. Its development for the passenger transport sector has already been presented in Lefevre et al. (Citation2020). In summary, the framework for the design of passenger transport scenario starts with the development of a storyline encompassing eight main factor categories: demography and economy; human settlement, land development and spatial organization; sociocultural practices and lifestyles; technological development of vehicles; fuel production and carbon content; penetration of alternative engine types and fuels; income dedicated to transport, modal distribution and costs; and speed, infrastructure and time dedicated to transport. Aspects of these storylines are then quantified using different models and quantitative tools, with other qualitative aspects remaining as key parts of the storyline. Finally, qualitative and quantitative information is reported in a common and comparable Microsoft Excel document shared among the DDP community of practice to facilitate internal exchange.
Going beyond the usual quantitative energy and climate descriptions is necessary to reveal some underlying assumptions contained in modelling tools and provide context to the modelling assumptions, but it also helps to ensure scenario consistency among the different transformations and with key ‘non-climate’ development priorities. This mixed qualitative-quantitative approach is required to support dialogues on the policy conditions for action. Quantitative indicators facilitate the follow up of the transition using key selected quantitative indicators. Qualitative and stakeholder-oriented storyline’s descriptions help express the current identified barriers related to different actors and the conditions of feasibility to implement these transformations. Such descriptions are essential to structure sectoral dialogues able to deliver concrete strategies of action and cooperation between actors.
The framework has been applied by four country teams in Brazil, India, South Africa, and Indonesia to develop and report one possible deep decarbonization scenario. Annex 1 provides an overview of the different modelling architecture used by the country teams. While using different models appropriate to in-country capacity, the insights that emerge from national scenarios and analysis are useful comparators. The storyline’s and dashboard’s indicators are then used to facilitate cross-country comparison of the required key long-term transformations and related short-term barriers and enablers (see Sections 3 and 4).
3. Application to build and compare systemic long-term deep decarbonization pathways
In this section, we present the key long-term transformations of mobility needs, modal choices, low-carbon vehicles and fuel deployment, based on quantitative and qualitative information reported in the dashboard and storyline.
3.1. Overall cross-country comparison of passenger transport transitions
In Brazil, India, Indonesia, and South Africa, passenger transport emissions accounted for 4–7% of national GHG emissions in their baseline years (2019 in Brazil, 2012 in India, 2010 in Indonesia, and 2017 in South Africa). However, while the population and access to mobility continues to grow in all countries, analyses highlight possible pathways for a low-carbon transition of the passenger transport sector. On a per capita basis, passenger transport emissions could be reduced by 35%−90% between 2050 and the baseline years, reaching less than 0.04 tCO2eq/cap in India and South Africa, around 0.1 tCO2eq/cap in Indonesia and around 0.2 tCO2eq/cap in Brazil (See Annex 2). On a per passenger kilometres travelled (pkm) basis, emissions are reduced by 66-92% in 2050 relative to the baseline years, reaching less than 8 gCO2eq/pkm in India and South Africa and around 12gCO2eq/pkm in Indonesia and Brazil (See Annex 2). It should be noted that the average passenger domestic transport emissions per capita in non-OECD countries lies around 0.5 tCO2/cap, while OECD countries have values of around 3 tCO2/cap (OECD/ITF, Citation2017).
In Brazil, the penetration of electric vehicles by 2050 is lower than the other countries. As highlighted by the local stakeholders, the scenario reflects strong lobbying efforts by interest groups for the continuation of policies aiming at promoting biofuels (See Section 4.2.1.). Thus, the electric vehicle market in Brazil may advance in specific transport sectors such as bus services, urban freight deliveries, and other private fleets of cars and motorcycles. All country research teams, except in South Africa, have integrated the mobility of the population done by walking or biking, the so-called non-motorized modes, in their analysis. This explains the higher base year level on emissions intensity of activity in South Africa.
In India, the emissions per capita, or per pkm, are very low mostly because the current mobility model is based on a low modal share of private motorized vehicles and important use of public transport (See Section 3.3.) and a high use of 2-wheelers rather than cars, which consume about 60% of all petrol and gasoline used in India (MoPNG, Citation2014). Apart from this, while per capita mobility will increase in the next decades, India will foster the shift towards electric private motorized mobility and maintain a high use of public transport and non-motorized transport. This could explain why the emissions per capita and per pkm will continue to decrease and be very low.
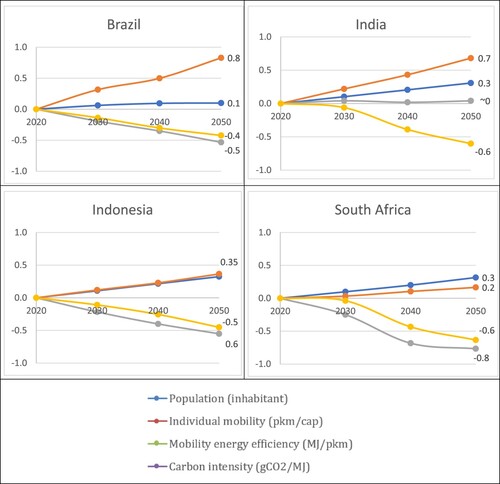
Annex 2 presents the Kaya identity, following an Activity–Structure-Intensity-Fuel (ASIF) disaggregation approach (Schipper et al., Citation2000). These include four main factors: population (capita), per capita mobility demand (pkm/cap), energy consumption per passenger kilometres (MJ/pkm), and fuel carbon content (gCO2eq/MJ).
3.2. Mobility needs
Passenger mobility differs markedly between the four countries today, with Brazil having almost twice the demand of South Africa in 2020 (See a). The relatively low demand for South Africa is due to high levels of unemployment at more than 40%, a large part of the population relying on very low income, and because non-motorized kilometres travelled are not accounted in this national research. In comparison, in Brazil, the scenario also covers the impact of COVID-19 restrictive measures, reflected in an unusually low level of mobility in 2020. Indeed, in the past decade, the average activity growth was of 2% per year and led to about 9700 pkm/cap in 2019. From 2020 onwards, increasing Brazilian incomes drive demand upwards, at a rate of 2% per year again. In contrast, South Africa sees relatively low growth of 0.5% per year due to the time it takes for employment challenges to be addressed. India and Indonesia are located between these two trajectories, with annual growth rates of 1.7% and 1% respectively.
Figure 1. Passenger mobility projections in pkm per capita, 2020–2050.
Note: Metropolitan areas defined as: the eight largest metropolitan areas in Brazil: São Paulo, Rio de Janeiro, Brasília, Salvador, Fortaleza, Belo Horizonte, Recife, and Porto Alegre with more than 1.5 million inhabitants (16% of the population); the six largest in Indonesia: greater Jakarta, Bandung Raya, Surabaya, Medan, Semarang and Palembang with more than 1.5 million inhabitants (18% of the population). In India, metropolitan areas cover all cities having more than 1 million inhabitants, which includes 9 megacities with more than 6 million and 70 cities with more than 1 million inhabitants (30% of the population). The South African team has not been able to advance on such disaggregation between metropolitan versus non-metropolitan areas.
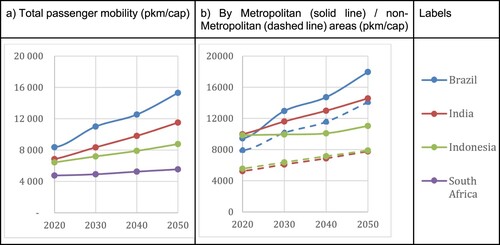
For three of the countries, passenger demand was estimated for different geographic areas (See b), namely the largest urban areas (metropolitan), and other small urban and non-urban areas (non-metropolitan). This spatial differentiation is useful to explore how specific policies can be implemented in geographies with different infrastructures, land-use characteristics, and social-economic characteristics. For India, the relative growth in both major urban versus small urban and non-urban areas is similar, at around 1.3% per year, but the mobility of households in metropolitan areas is currently two times more than in non-metropolitan areas. Work-from-home trend picks up in the metropolitan areas, but the extensive development of public transport facilities and shared transport are driving up mobility demand in these areas. For Indonesia, most of the demand growth is in regions outside of the main urban areas, because specific policies are projected to be implemented that focus on metropolitan areas such as the development of teleworking or development of specific land-use policies to reduce unnecessary travel and develop compact cities. A similar phenomenon occurs in Brazil, where teleactivities, compact settlements, and collective transport systems are addressed on a collaborative basis between urban planners and mobility actors, changing slowly behaviour and mobility patterns.
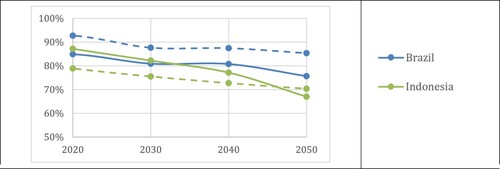
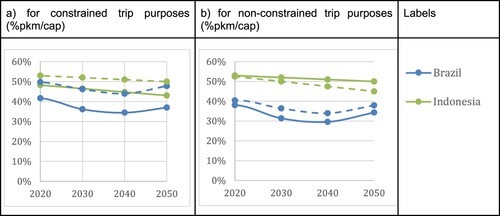
The research teams have also investigated the extent to which the passenger demand is deemed as generated by constrained or non-constrained activities as described in . For Indonesia and Brazil, most demand is constrained both in metropolitan and non-metropolitan areas, although this decreases over time as higher incomes enable more leisure trips, particularly for populations in large urban areas where incomes are higher. In Indonesia, the decrease shown for metropolitan areas is the highest due to impact of policies mentioned before. By 2050, the share of mobility due to constrained activities reduces to 67% of mobility in metropolitan areas, down from 93% today. For India, constrained mobility has been assessed at a very low level, around 24%, and not distinguished by geographic areas. This is mainly due to the lack of detailed datasets and that inter-city or long-distance travels have been determined to be mostly non-constrained activity. While such data are useful to develop specific activity- and geographical-based policies, this example reveals the difficulty to source these data in developing countries. This data disaggregation has not been assessed in the case of South Africa.
Figure 2. Share of pkm generated by constrained activities in Metropolitan (Solid line) / non-Metropolitan (Dashed line) areas, 2020–2050.
Note: ‘Constrained’ refers to a specific type of travel activity that is deemed essential. For example, this includes getting to a workplace or place of education, going home or buying food. ‘Non-constrained’ mostly refers to ‘leisure’ type of activity.
3.3. Modal choices
The share of passenger mobility by cars or motorized 2-wheelers seen today varies considerably between countries (see ). For example, combined these represents more than 53% of passenger mobility in Indonesia while it accounts for less than 30% in India. In Indonesia, this higher level also represents a larger share of motorized 2-wheelers (35%) and a lack of public transport. In India, public transport is highly subsidized by the government to support the lower- and middle-class population (70% of the total population), who therefore travel more by public transport. In addition, though car ownership is expected to increase in the near term, in the long term it is assumed that if access and comfort are increased and other advantages in terms of traffic priorities are implemented, the middle class will continue to prefer public transport in India.
Figure 3. Share of private motorized mobility (car and motorized 2-wheelers) in total mobility (%Gpkm), 2020–2050.
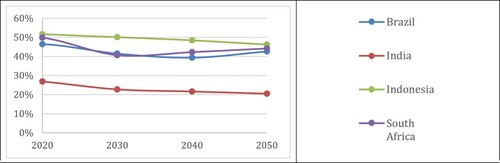
However, in all countries, the relative share of private motorized mobility will be reduced over the period by 2Ppts in Brazil, 7Ppts in South Africa and Indonesia, and up to 9Ppts in India. The declines are mainly driven by strong investments in safe and accessible public transport services, and, in the case of Indonesia, high level of road congestion in metropolitan areas. Costs followed by travel time remain the primary modal determinants of mode choice in all scenarios.
In South Africa and Brazil, variations can be observed after 2030. A pent-up demand for private motorized mobility is expected from 2030 onwards due to increasing incomes, combined with an increase in the use of ride-share and ride-hailing services, the saturation of metro and metropolitan train systems in Brazil, and a move away from minibus taxis in South Africa. In addition, the benefits of electric vehicles in this period are expected to be widely perceived by the public as a cheaper and sustainable alternative, increasing the average kilometre travelled. In South Africa, the strong decrease between 2020 and 2030 is mostly due to the extensive development of bus rapid transit (BRT) systems and a decline in vehicle ownership from middle-income households.
For two countries, Brazil and Indonesia, the share of private motorized mobility was further split by travel purpose (constrained and non-constrained) and geographic context (metropolitan and non-metropolitan) (see ). For constrained trip purposes, the use of cars and motorized 2-wheelers is relatively more important in non-metropolitan areas than in metropolitan areas in Indonesia and Brazil. These vehicles are preferred when the spatial distribution of activities is sprawled, the public transport services are not sufficient and time constraints are important. In Indonesia and Brazil, non-motorized transport, especially cycling, will increase in metropolitan areas facilitated by a redesign of urban space and the organization of social activities. For non-constrained trip purposes, the share of private motorized mobility will decrease more for non-metropolitan households in Indonesia than for metropolitan households. This is mostly due to the development of new and adequate public transport services. In Brazil, the changes over time follow the average trend described before, with limited difference based on trip purpose.
Figure 4. Share of private motorized mobility (car and 2-wheelers) for constrained and non-constrained trips in the two geographical areas, 2020–2050.
Note: In India, initial analyses have highlighted that the use of private mobility to fulfil constrained activities was more important in metropolitan than in non-metropolitan areas. This could be mostly explained by the fact that households in metropolitan areas have a better spending power and can afford a private vehicle.
3.4. Low-carbon vehicle and fuel deployment
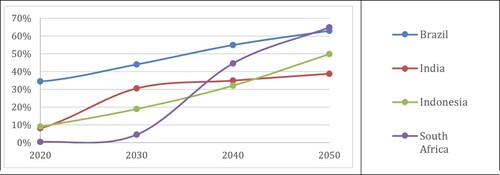
A key feature of the national decarbonization pathways is the major shift towards low carbon vehicles and fuels. The share of passenger transport final energy consumption from non-fossil fuel sources would reach between 39% and 65% (See ), which is aligned with the range of shares of transport low-emission final energy in 2050 in 1.5°C scenarios (IPCC, Citation2018), but current systems differ markedly and shape the transition going forward.
Figure 5. Share of passenger transport final energy consumption from non-fossil fuel sources (biofuels and electricity), %EJ, 2020–2050.
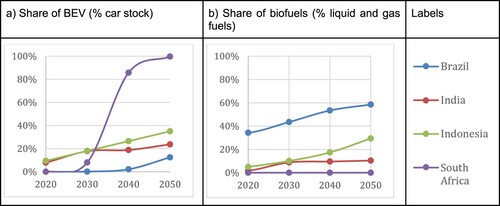
Brazil is the only country to start from a high share of biofuel mixed in blended fuels for the passenger transport mobility of 36% (See b), mostly bioethanol. This is planned to continue to increase substantially out to 2050, reaching 59%. While the anhydrous ethanol-gasoline blend still remains at 27% in 2050, the biodiesel–diesel blend ratio and the market share of hydrous ethanol in flexible fuel are expected to increase to 40% and 70%, respectively. Moreover, battery-electric vehicles (BEV) in Brazil play a more limited role compared to that shown for India, Indonesia, and South Africa (See a). The continental dimensions and the strong biofuel market in this country are barriers that delay the penetration of electro-mobility in long-distance transport, concentrating such market in urban mobility.
Figure 6. (a) Share of full-electric vehicles in total car stock, and (b) share of liquid biofuels and biogas in total liquid fuels and pipe gas consumed by passenger transport, 2020–2050.
Note: Plug-and-Hybrid Electric Cars do represent an important part of the car stock in Brazil and Indonesia by 2050, around one-third.
In addition, reaching an economy-wide deep decarbonization will not be possible without a decarbonization of the electricity sector. In all deep decarbonization pathways, the electricity carbon content decreases to reach 2gCO2/kWh in Brazil, 43gCO2/kWh in South Africa, 96gCO2/kWh in India, and 104gCO2/kWh in Indonesia by 2050, increasing the mitigation potential of transport electrification.
In Brazil, there have been significant advances in research, production, and distribution of biofuels, with efforts particularly focused on progressive increases in regulated mixtures with fossil fuels. There is an expectation that biofuels will dominate the mix in the future, with production costs of biofuels falling with the development of new generations of fuels, and expanding primary resources, assisted by financial incentives. In this analysis, ethanol will be produced mainly by fermentation of sugars (1st generation), but also by cellulosic material recovered from production residues (2nd generation). Regarding biodiesel, Fatty Acid Methyl Esters (FAME) remain predominant, but co-productions of drop-in renewable diesel (HVO) and kerosene (SPK) via Esters and Hydroprocessed Fatty Acids (HEFA) are also included. On the other hand, BEV start to penetrate the car stock representing 12% by 2050 and does become increasingly important for urban buses, with 50% of the stock being fully electric by 2050 in this pathway.
In Indonesia, biofuels use for passenger transport increases quickly with a strong support to produce bioethanol and mandate to reach up to 30% by 2050, as gasoline is mostly used in cars and 2-wheelers. Indonesia is also developing innovative biodiesel production, converting crude palm oil (CPO) to hydrocarbon fuels known as bio-hydrocarbon. It will prevent conversion of natural forest to plantations and will be useful for heavy vehicles. By 2050, the biodiesel industry will move away from the current FAME to CPO production method and biodiesel mandate would reach up to 50% of blended fuels. BEVs do make an important contribution, with about one-third of the passenger car stock, about 40% of buses and 60% of 2-wheelers being fully electric by 2050 in this pathway.
In South Africa, EVs play a much stronger role in the longer term. There is a period of limited change until early 2030, when EVs start to become cost-competitive, and by 2050 account for all passenger cars on the road. There is an assumption that infrastructure will be built out as the EV stock share increases and that the domestic automotive sector will retool to produce EVs (DTI, Citation2021). With no large-scale uptake of biofuels to date, despite regulations to promote biofuel blending (RSA DMRE, Citation2020), this is not seen as a potential low carbon fuel in the future transport mix. In addition, despite the water resources challenges, a cumulative land constraint is applied and based on the available land for new agricultural enterprise, circa 2.5 Mha (Jewitt & Kunz, Citation2011).
India also takes an EV-focused approach, although the pathway and end point is different to that seen in the South Africa and Indonesia case. India sees a strong growth of BEVs during the 2020s, similar to Indonesia, but then a slower rate after 2030. In terms of BEVs in the passenger car stock, this reaches around 24% in 2050. While South Africa sees no impactful role for biofuels, India has some uptake, but only to 10% of transport fuels in 2050, reflecting strong limits on bioenergy resources, as those related to land-use competition (Ravindranath et al., Citation2011). In addition, other studies highlighted risks for biodiversity conservation (IPBES, Citation2019; Santangeli et al., Citation2016).
Hydrogen and fuel-cell powered vehicles have been considered in all countries, but have not been identified as a key technology to reach deep decarbonization in the passenger transport, rather for freight.
4. Policy discussion about short-term barriers and enablers for the transition
Based on the scenario comparison and issues most pertinent to the country contexts, this part of the paper is developed around two selected decarbonization transformations highlighted in Section 3. Using those examples, this section illustrates how the DDP framework and different parts of the storyline could contribute towards a structured policy discussion around short-term barriers and enablers related to those long-term transformations.
The first selected transformation is the development of non-motorized or shared and collective transport in household mobility in metropolitan areas, highlighted in Section 3.3. In all scenarios, the share of motorized mobility by cars and 2-wheelers reduces and represents between 20% and 46% of all transport demand by 2050, but differentiated between the main metropolitan areas and the rest of the country, and between constrained versus non-constrained trip purposes. The second transformation of focus is the deployment of electric vehicles, as highlighted in Section 3.4. While South Africa estimates that battery-electric cars will represent 100% of the stock by 2050, the development in the other countries is smaller at about 12-35% of the car stock by 2050.
4.1. Barriers for the development of non-motorized or shared and collective transport in household mobility in metropolitan areas and potential solutions
Fulfilling mobility needs through walking, biking, or in using more efficient services of transport such as shared and collective mobility could contribute to strongly reduce energy consumption and related emissions (Bergk et al., Citation2016; Briand et al., Citation2017; Kainuma et al., Citation2017; Pye & Li, Citation2017; Tovilla & Buira, Citation2017). Country research teams have identified in their storyline different barriers to such changes and two are described here: a general techno-centric approach of transport planning and the low attractiveness and quality of service provided by public transport. These emerge from the earlier storyline descriptions around ‘human settlement, land development and spatial organization’, ‘sociocultural practices and lifestyles’, ‘income dedicated to transport, modal distribution and costs’, and ‘speed, infrastructure and time dedicated to transport’.
4.1.1. Infrastructure-and car-centric approach of transport and city planning
City planners often consider that planning transport systems means providing infrastructure. With the rise in car ownership, they have prioritized the place of cars in urban areas. However, this approach ignores the fact that transport is just a means for people to access different places and activities such as work, schools, supermarkets, hospitals, parks, etc. and, at low cost and as quickly as possible. Therefore, disconnecting transport from social and land-use planning and prioritizing the design of the built environment towards a car-centric approach can lead to negative consequences. This includes reinforced social inequalities and urban sprawl, created dependencies on cars and congestion issues, and under-investments in safe sidewalks, biking lanes, or public transport infrastructures and services. These observations have been made in all four countries, with differentiation, of course, in the existing relationship between transport and urban planning.
Nevertheless, many solutions exist and have been considered in the country scenarios to support the shift towards more non-motorized, shared, and collective mobility. First, the development of integrated planning and unified transport authority has been clearly expressed in some countries like in India (MoHUA, Citation2017; NITI Aayog & BCG, Citation2018). The design of more ‘compact cities’ (Ewing & Cervero, Citation2010) has been highlighted as a good way to plan cities, like in Indonesia and Brazil. Such planning requires strong coordination between transport infrastructure planning, social and land-use policies. This is needed to take into account the diverse needs of households and businesses so that they can access their daily needs within a given perimeter. In reducing travel distances, this design can also support the use of non-motorized mobility and public transport where services exist. In addition, this new design can support the interconnectivity between all modes, starting with walking, biking, public transport and finishing with cars, creating friendly pedestrian environments. As explained in the Brazilian scenario, this could reduce costs, time, and dependence on cars.
Second, all countries have emphasized the need for massive investments in public transport infrastructures. However, transport infrastructure development often focuses on motorized rather than non-motorized transport infrastructures, which are not considered as important for daily activities. For example, in India, strong investment schemes already exist to develop metros and mass rapid transit systems by 2035 in all main metropolitan areas with more than 1 million inhabitants. In Indonesia, some new housing developments are now planned alongside the development of a transport network such as bus rapid transit (BRT), light rail transit, dedicated lanes for buses, and intermodality areas. In Brazil, there is a structural under-investment in such infrastructure, which needs to change to prioritize high-capacity modes and active transport over individual motorized transport. This could include planning new BRTs with exclusive lanes and reducing car parking spaces in cities, for example.
4.1.2. Low attractiveness and quality of service proposed by public transport
The attractiveness of modes is affected by a number of factors, such as their modal costs and speeds in relation with household revenues and time budgets (Waisman et al., Citation2013; Zahavi, Citation1974), the purpose of trips and associated constraints (Yang & Diez-Roux, Citation2012), their accessibility, flexibility, and comfort (Ewing & Cervero, Citation2010; Litman, Citation2004; Litman, Citation2022). To enable the development of public transport, these factors should be comparable or better to those for car mobility, and solutions exist for to create incentives and reduce disincentives (Gao et al., Citation2020; Petrunoff et al., Citation2017). Below are a few examples of those barriers in the specific country cases and solutions mobilized in the country scenarios to increase the attractiveness of public transport.
First, the price of public transport should be lower than car use. In South Africa, for example, in 2020, travel cost (30.8%) surpassed travel time (23.3%) as the biggest factor influencing modal choice of households, while in most Brazilian cities, transport fares are often unaffordable for most urban dwellers. To change this situation, some country teams suggest developing specific pricing systems such as developing a bonus-penalty system to increase taxes on individual motorized transport to then subsidize public transport tickets, or road tolls as suggested in the Brazilian scenarios.
Second, the travel time should be more advantageous, in particular for bus transport. In South Africa, for example, commuting workers using bus transport spend twice the amount of time than if they drove their own cars (NHTS, Citation2020). While light rail benefits from a dedicated line, this is often not the case for buses and mini-buses, which are using the same space as private road vehicles. Differentiated speed limits or dedicated bus tracks are the most common solutions addressed in the country scenarios.
Other dimensions such as the safety, the predictability, the frequency and flexibility, and the comfort of the service are key. As mentioned in some analysis, it could be taken into account in revising existing concession contracts or regulating informal transport services to improve the quality of public transport services with financial incentives and disincentives for the operators. However, regulating public transport is not an easy task, as some private-owned collective transport companies could represent an important blocking force using strikes as a main lever.
4.2. Barriers for the deployment of electro-mobility for passenger transport and potential solutions
Electric mobility will not solve all transport sustainability issues such as congestion or safety and will even bring its own problems (De Blas et al., Citation2020; SUM4ALL, Citation2017). However, the electrification of energy uses combined with electricity decarbonization will clearly play a key role for economy-wide deep decarbonization (Huppmann et al., Citation2019; SDSN & IDDRI, Citation2015) and specifically for the transport sector.
In the four country cases, the deployment is just starting and country research teams have therefore identified two main barriers to overcome: the transformation of domestic national industries, and the affordability of vehicles and charging infrastructures. The following elements have been taken from storyline elements including ‘demography and economy’, ‘technological development of vehicles’, ‘fuel generation and carbon content’, ‘penetration of alternative engine types and fuels’, and ‘income dedicated to transport, modal distribution and costs’. Many other barriers exist and have not been further analysed like the synergies between biofuels for terrestrial transport, maritime and aviation transport.
4.2.1. Unlocking domestic national industries in Brazil and Indonesia
While Brazil is the second largest biofuel producer globally, and more precisely of bioethanol, and the third largest consumer, Indonesia is the third largest biofuel producer, and the second largest biodiesel producer (IEA REN, Citation2021). Both countries plan to increase their biofuel production capacity in the near future. In addition, Brazil was the 10th largest oil producer in 2019 with 2.9 million barrels per day, while Indonesia produced around 0.8 million barrels per day (BP, Citation2020). These facts demonstrate the importance of the oil, gas, and biofuel industries in Brazil and Indonesia, which require internal combustion engines in the future and represent a strong lobby against phasing out those engines. In comparison, India and South Africa are very dependent on crude oil imports with more than 80% and almost 100% of crude oil needs being imported, respectively (ETEnergyWorld, Citation2018). This has facilitated the decisions to support actively the deployment of electro-mobility.
Those scenarios highlight that a key enabling condition is the development of national electro-component industries to create new national business opportunities and offset the potential need for imported goods for this industry and losses in the trade balance. In Brazil, this could even reduce the impact of the devaluation of the local currency on imports. This industry could sustain the needs for construction and maintenance of vehicles and charging infrastructures. It could also create new job opportunities. Due to continental dimensions and the strong biofuel market, electro-mobility in Brazil will be concentrated first on intensive urban operations such as ride hailing and bus transport services. The social transition of automotive industries remains an important challenge requiring policies to train the work force in other technical skills.
Regarding the future of biofuel industries in Brazil and Indonesia, the challenge is to prioritize the use of biofuels for the sectors of the economy where no alternatives exist yet, like in some industries or aviation. Increasing production capacity will still be required in the future, but for uses other than private cars or buses in urban mobility. The use of biofuels could continue to predominate in interstate buses, as well as in long-distance car trips. Finally, today oil production remains a major source of public funding. However, as oil demand could rapidly be decreasing globally, it is critical to anticipate this future revenue loss and develop a public finance system, which does not rely on oil production and export.
4.2.2. Affordability of vehicles and adapted charging network
Current passenger electromobility is dominated by buses and 2-wheelers, while electric cars represent only 1% of the global 2020 stock (SLOCAT, Citation2021b). In all scenarios, electric vehicles will penetrate all type of fleets: private cars, 2-wheelers, and buses. However, one of the main barriers for vehicle uptake is the upfront cost of those vehicles (Cano et al., Citation2018) and therefore depends on the financial capacity of the consumer buying the vehicle.
For bus renewal, the main actors are public or private transport businesses and operators. For companies with concession contracts, the role of public authorities will be key in providing mandates for electric buses, alongside either the access to low-cost loans, or the design of relevant financial incentives mechanisms. In Brazil, for example, public transport is foreseen to be the main vector for the penetration of electromobility with the renewal of concession contracts. Another important concern of governments is the transition of the private-owned minibuses that correspond to a large need of the population in terms of collective transport and is often not regulated, like in South Africa.
For private vehicles, households are the key economic agent with a diversity of situations (revenues, geographical localization, and family size). While low-speed electric 2-wheelers could be quite easily affordable today for households at around 400 USD (Jiangsu, Citation2021), this is not the same situation with private cars. Even though battery pack prices have decreased 36% over the last five years and are projected to reach 62$/kWh by 2030 (BNEF, Citation2019), current electric private cars have not reached a price parity with those with internal combustion engines (ICE). In the four-country analysis, upfront costs are currently around 10,000 USD for a segment 1-car with ICE. However, all national experts are anticipating a fall in battery costs driving the electric car price down to parity between 2030 and 2040, compared to price parity being reached by 2023–26 in developed countries (BNEF, Citation2021). During this transition period, additional policies should contribute to reduce the cost of electric cars to develop the first and second-hand markets, in either cutting specific taxes (on importation, for example) or subsidizing them. In addition, emerging economies are facing a huge risk to see ICE second-hand cars from richer countries with an attractive price. One approach could be to restrict the import of cars over a certain age, for example, as is being put in place in Zimbabwe (Zimbabwe Mail, Citation2021).
To enable this shift, financing capacity has been mentioned as one main obstacles in all countries like in India (NITI Aayog & Rocky Mountain Institute, Citation2019), but more and more international funding programmes are focusing now on sustainable mobility policies. Furthermore, there is currently no clear strategic plan for the development of charging points and the reinforcement of the power distribution network in the four countries, while it remains a major factor for households and the sustainability of the power network. Indeed, the development of the charging network should ensure that households could access easily charging stations everywhere and that the charging power is adapted to the battery autonomy to ensure a socially acceptable time of charge.
5. Conclusions
In Brazil, India, Indonesia, and South Africa, national research teams demonstrated that reaching carbon neutrality in emerging economies is possible and would require deep transport sector emission reductions of 59–92% by 2050 compared to 2020, on a per passenger kilometres travelled (pkm) basis. These levels of decarbonization include systemic and structural demand-side transformations linked to social, urban, and land-use development that mitigate increasing demand and enable the use of less motorized modes of transport, alongside changes in technologies that reduce fossil-fuel using vehicles. This suggests the importance of deploying a wide spectrum of mitigation options.
Based on the quantitative representation of scenarios presented in Section 3, country teams compared in greater detail two key aspects of the mobility transition, namely the uptake of non-motorized or shared and collective transport in metropolitan areas and the deployment of electro-mobility. While in other modelling exercises, the policy-oriented discussion is often limited to the quantitative analysis, the comparison of the stakeholder-driven storylines provided additional and complementary perspectives. This analysis identified common cross-country barriers and challenges and discussed potential enablers using different elements of narratives from the storyline of the DDP framework. Regarding modal shift in metropolitan areas, the analysis of barriers highlighted the necessity to shift the current city and transport planning approach towards a more integrated planning approach, and to focus investment priorities towards more public transport. It also highlighted specific challenges related to the transport users’ preferences, like the necessity to ensure a lower comparative cost of public transport compared to private motorized mobility, but most importantly to improve the quality of service of public transport, including travel times. Regarding the deployment of electro-mobility, the analysis of barriers highlighted the vested interests of the fuel and automotive industry in Brazil and Indonesia, and focused on the economic challenges for both individual and collective transport service operators on the costs of purchasing their vehicles. In the context of the Global Stocktake, developing such analysis of the barriers and enablers for the transition and sectoral conversations with the different stakeholders will be vital to foster cooperation and identify how national ambitions and actions can be raised.
With respect to further research building on this paper, we note a range of limitations that require additional focus. First, the cross-country comparison of the mobility patterns based on trip purpose is challenging. Indeed, the project suffered from lack of a structured database related to the trip purposes in different geographies, and we were only able to confidently assess it in Brazil and Indonesia, based on studies in key urban areas. Second, household socio-economic indicators were identified as key to assessing the acceptability of the scenarios, but were challenging to assess. As a result, related indicators were only partially analysed. Therefore, further research is needed to develop comparative analysis of modal costs and household revenues, and modal speeds and household time dedicated to mobility. Third, the total public and private investment level required for the transport transition was only partially assessed by some research teams but with different approaches (integrating only infrastructures, or transport services). Further research could add new common indicators related to the different types of investments. Finally, the next development of this research could be to propose concrete and actionable policy packages for policymakers based on the detailed analysis of national short-term barriers.
Disclosure statement
No potential conflict of interest was reported by the author(s).
Additional information
Funding
Notes
1 The Glasgow Pact ‘recalls Article 3 and Article 4, paragraphs 3, 4, 5 and 11, of the Paris Agreement and requests Parties to revisit and strengthen the 2030 targets in their nationally determined contributions as necessary to align with the Paris Agreement temperature goal by the end of 2022, taking into account different national circumstances’ (Decision of the CMA.3, paragraph 29, COP26, 2021). See https://unfccc.int/sites/default/files/resource/cma3_auv_2_cover%20decision.pdf.
References
- Barrett, J., Pye, S., Betts-Davies, S., Broad, O., Price, J., Eyre, N., Anable, J., Brand, C., Bennett, G., Carr-Whitworth, R., Garvey, A., Giesekam, J., Marsden, G., Norman, J., Oreszczyn, T., Ruyssevelt, P., & Scott, K. (2022). Energy demand reduction options for meeting national zero-emission targets in the United Kingdom. Nature Energy, 7(8), 726–735. https://doi.org/10.1038/s41560-022-01057-y
- Bataille, C., Waisman, H., Briand, Y., Svensson, J., Vogt-Schilb, A., Jaramillo, M., Delgado, R., Arguello, R., Clarke, L., Wild, T., Lallana, F., Bravo, G., Nadal, G., Le Treut, G., Godinez, G., Quiros-Tortos, J., Pereira, E., Howells, M., Buira, D., … Imperio, M. (2020). Net-zero deep decarbonization pathways in Latin America: Challenges and opportunities. Energy Strategy Reviews, 30, Article 100510. https://doi.org/10.1016/j.esr.2020.100510
- Bataille, C., Waisman, H., Colombier, M., Segafredo, L., & Williams, J. (2016a). The deep decarbonization pathways project (DDPP): insights and emerging issues. Climate Policy, 16(sup1), S1–S6. https://doi.org/10.1080/14693062.2016.1179620
- Bataille, C., Waisman, H., Colombier, M., Segafredo, L., Williams, J., & Jotzo, F. (2016b). The need for national deep decarbonization pathways for effective climate policy. Climate Policy, 16(sup1), S7–S26. https://doi.org/10.1080/14693062.2016.1173005
- Bergk, F., Biemann K., Heidt C., Knörr W., Lambrecht U., Schmidt T. (2016). Klimaschutzbeitrag des Verkehrs bis 2050. Umweltbundesamt. https://www.umweltbundesamt.de/sites/default/files/medien/1410/publikationen/texte_56_2016_klimaschutzbeitrag_des_verkehrs_2050_getagged.pdf
- BNEF. (2019, March 5). A behind the scenes take on lithium-ion battery prices. Bloomberg New Energy Finance, Blogpost.
- BNEF. (2021). Zero-emission vehicles factbook. A Bloomberg New Energy Finance special report prepared for COP26. November 10, 2021. https://assets.bbhub.io/professional/sites/24/BNEF-Zero-Emission-Vehicles-Factbook_FINAL.pdf
- Boer, R., Siagian, U., Dewi, R. G., Rossita, A., Anggraeni, L., & Immanuel, G. S. (2021). Policy lessons on deep decarbonization in large emerging economies, Indonesia. Deep Decarbonization Pathways (DDP) Initiative-IDDRI. Paris. https://ddpinitiative.org/wp-content/pdf/DDP_BIICS_CountryReport_IDN.pdf
- BP. (2020). Statistical Review of World Energy 2020. BP, 69th edition. https://www.bp.com/content/dam/bp/business-sites/en/global/corporate/pdfs/energy-economics/statistical-review/bp-stats-review-2020-full-report.pdf
- Brand, C., Anable, J., & Morton, C. (2019). Lifestyle, efficiency and limits: Modelling transport energy and emissions using a socio-technical approach. Energy Efficiency, 12(1), 187–207. ISSN 1570-646X. https://eprints.whiterose.ac.uk/131941 https://doi.org/10.1007/s12053-018-9678-9
- Briand, Y., Lefevre, J., & Cayla, J.-M. (2017). Pathways to deep decarbonization of the passenger transport sector in France, IDDRI. https://ddpinitiative.org/pathways-to-deep-decarbonization-of-the-passenger-transport-in-france/
- Cano, Z. P., Banham, D., Ye, S., Hintennach, A., Lu, J., Fowler, M., & Chen, Z. (2018). Batteries and fuel cells for emerging electric vehicle markets. Nature Energy, 3(4), 279–289. https://doi.org/10.1038/s41560-018-0108-1
- Creutzig, F. (2016). Evolving narratives of low-carbon futures in transportation. Transport Reviews, 36(3), 341–360. https://doi.org/10.1080/01441647.2015.1079277
- Creutzig, F., Roy, J., Lamb, W. F., Azevedo, I. M., de Bruin, W. B., Dalkmann, H., Edelenbosch, O. Y., Geels, F. W., Grubler, A., Hepburn, C., Hertwich, E. G., Khosla, R., Mattauch, L., Minx, J. C., Ramakrishnan, A., Rao, N. D., Steinberger, J. K., Tavoni, M., Ürge-Vorsatz, D., & Weber, E. U. (2018). Towards demand-side solutions for mitigating climate change. Nature Climate Change, 8(4), 260–263. https://doi.org/10.1038/s41558-018-0121-1
- De Blas, I., Mediavilla, M., Capellán-Pérez, I., & Duce, C. (2020). The limits of transport decarbonization under the current growth paradigm. Energy Strategy Reviews, 32, Article 100543. https://doi.org/10.1016/j.esr.2020.100543
- DTI. (2021). Auto green paper on the advancement of new energy vehicles in South Africa, Version of May 18th, 2021. Trade, Industry and Competition Department, Republic of South Africa. http://www.thedtic.gov.za/wp-content/uploads/EV_Green_Paper.pdf
- ETEnergyWorld. (2018). India’s monthly oil import bill growth at a year-high. Economic Times. https://energy.economictimes.indiatimes.com/news/oil-and-gas/indias-monthly-oil-import-bill-growth-at-a-year-high/63015213
- Ewing, R., & Cervero, R. (2010). Travel and the built environment. Journal of the American Planning Association, 76(3), 265–294. https://doi.org/10.1080/01944361003766766
- Gao, Y., Newman, P., & Kenworthy, J. (2020). The rise and decline of car use in Beijing and Shanghai. Sustainability in Urban Planning and Design. IntechOpen. https://doi.org/10.5772/intechopen.90130
- Garg, A., Sudharmma Vishwanathan, S., Chaturvedi, R., Gupta, D., Avashia, V., & Patange, O. (2021). Policy lessons on deep decarbonization in large emerging economies, India. Deep Decarbonization Pathways (DDP) Initiative-IDDRI. Paris. https://ddpinitiative.org/wp-content/pdf/DDP_BIICS_CountryReport_IND.pdf
- Godinez-Zamora, G., Victor-Gallardo, L., Angulo-Paniagua, J., Ramos, E., Howells, M., Usher, W., De León, F., Meza, A., & Quirós-Tortós, J. (2020). Decarbonising the transport and energy sectors: Technical feasibility and socioeconomic impacts in Costa Rica. Energy Strategy Reviews, 32, Article 100573. https://doi.org/10.1016/j.esr.2020.100573
- Godoy, J. C., Villamar, D., Soria, R., Vaca, C., Hamacher, T., & Ordóñez, F. (2021). Preparing the Ecuador’s power sector to enable a large-scale electric land transport. Energies 14(18): 5728. https://doi.org/10.3390/en14185728
- Gupta, G. (2020). Sustainable development and carbon neutrality: Integrated assessment of transport transitions in India. Transportation Research Part D: Transport and Environment, 85, Article 102474. https://doi.org/10.1016/j.trd.2020.102474
- Huppmann et al. (2019). IAMC 1.5°C scenario explorer and Data hosted by IIASA. https://doi.org/10.5281/zenodo.3363345
- IEA GER. (2021). Global energy review 2021. IEA, Paris. https://www.iea.org/reports/global-energy-review-2021
- IEA NZ. (2021). Net Zero by 2050. IEA, Paris. https://www.iea.org/reports/net-zero-by-2050
- IEA REN. (2021). Renewable energy market update, Outlook for 2021 and 2022. IEA. https://iea.blob.core.windows.net/assets/18a6041d-bf13-4667-a4c2-8fc008974008/RenewableEnergyMarketUpdate-Outlookfor2021and2022.pdf
- IEA SUV. (2021). Global SUV sales set another record in 2021, setting back efforts to reduce emissions, IEA, Paris https://www.iea.org/commentaries/global-suv-sales-set-another-record-in-2021-setting-back-efforts-to-reduce-emissions
- IPBES. (2019). Summary for policymakers of the global assessment report on biodiversity and ecosystem services (summary for policy makers). IPBES Plenary at its seventh session (IPBES 7, Paris, 2019). Zenodo. https://doi.org/10.5281/zenodo.3553579
- IPCC. (2018). Summary for policymakers. In: Global Warming of 1.5°C. An IPCC Special Report on the impacts of global warming of 1.5°C above pre-industrial levels and related global greenhouse gas emission pathways, in the context of strengthening the global response to the threat of climate change, sustainable development, and efforts to eradicate poverty. [Masson-Delmotte, V., P. Zhai, H.-O. Pörtner, D. Roberts, J. Skea, P.R. Shukla, A. Pirani, W. Moufouma-Okia, C. Péan, R. Pidcock, S. Connors, J.B.R. Matthews, Y. Chen, X. Zhou, M.I. Gomis, E. Lonnoy, T. Maycock, M. Tignor, and T. Waterfield (eds.)]. In Press. https://www.ipcc.ch/site/assets/uploads/sites/2/2019/05/SR15_SPM_version_report_LR.pdf
- IPCC SPM. (2022). Summary for Policymakers. In: Climate Change 2022: Mitigation of Climate Change. Contribution of Working Group III to the Sixth Assessment Report of the Intergovernmental Panel on Climate Change [P.R. Shukla,J. Skea, R. Slade, A. Al Khourdajie, R. van Diemen, D. McCollum, M. Pathak, S. Some, P. Vyas, R. Fradera, M. Belkacemi,A. Hasija, G. Lisboa, S. Luz, J. Malley, (eds.)]. Cambridge and New York, NY: Cambridge University Press. https://doi.org/10.1017/9781009157926.001
- Jewitt, G., & Kunz, R. (2011). The impact of biofuel feedstock production on water resources: A developing country perspective. Biofuels, Bioproducts and Biorefining, 5(4), 387–398. https://doi.org/10.1002/bbb.314
- Jiangsu. (2021). Low speed electric bike. Jiangsu Nwow Technology Co., Ltd. https://nwow2020.en.made-in-china.com/product/ndvfSoIcLYVO/China-Low-Speed-Electric-Bike.html
- Kainuma, M., et al. (2017). Pathways to deep decarbonization of the passenger transport sector in Japan, IDDRI. https://ddpinitiative.org/pathways-to-deep-decarbonization-of-the-passenger-transport-in-japan/
- La Rovere, E., et al. (2021). Policy lessons on deep decarbonization in large emerging economies, Brazil. Deep Decarbonization Pathways (DDP) Initiative-IDDRI. Paris. https://ddpinitiative.org/wp-content/pdf/DDP_BIICS_CountryReport_BRA.pdf
- Lefevre, J., Briand, Y., Pye, S., Tovilla, J., Li, F., Oshiro, K., Waisman, H., Cayla, J.-M., & Zhang, R. (2020). A pathway design framework for sectoral deep decarbonization: The case of passenger transportation. Climate Policy, 21:1, 93-106. https://doi.org/10.1080/14693062.2020.1804817
- Litman, T. (2004). Transit price elasticities and cross-elasticities. Journal of Public Transportation 7(2), 37–58. https://digitalcommons.usf.edu/cgi/viewcontent.cgi?article = 1339&context = jpt https://doi.org/10.5038/2375-0901.7.2.3
- Litman, T. (2022). Land use impacts on transport: How land use factors affect travel behavior. Victoria Transport Policy Institute. https://www.vtpi.org/landtravel.pdf
- MoHUA. (2017). Ministry of urban affairs to push dense urban growth along mass transit corridors for better living experience. Government of India. Press Information Bureau. https://pib.gov.in/newsite/PrintRelease.aspx?relid = 158690
- MoPNG. (2014). 70% of diesel, 99.6% of petrol consumed by transport sector. Ministry of Petroleoum & Natural Gas, Government of India. Press Information Bureau. https://pib.gov.in/newsite/printrelease.aspx?relid = 102799
- NHTS. (2020). National household travel survey in South Africa. Department of Statistics of South Africa. Republic of South Africa. http://www.statssa.gov.za/?p = 14063
- NITI Aayog & BCG. (2018). Transforming India’s mobility: A perspective. NITI Aayog. https://www.niti.gov.in/writereaddata/files/document_publication/BCG.pdf
- NITI Aayog & Rocky Mountain Institute. (2019). India’s electric mobility transformation: Progress to date and future opportunities. https://rmi.org/wp-content/uploads/2019/04/rmi-niti-ev-report.pdf
- OECD/ITF (2017). ITF transport Outlook 2017. OECD Publishing. https://doi.org/10.1787/9789282108000-en
- OECD/ITF. (2021). Transport CO2 and the Paris Climate Agreement: Where Are We Six Years Later? https://www.itf-oecd.org/sites/default/files/docs/transport-co2-paris-agreement-six-years-later.pdf
- Petrunoff, N., Rissel, C., & Wen, L. M. (2017). If you don’t Do parking management. Forget your behaviour change, it’s not going to work.”: Health and transport practitioner perspectives on workplace active travel promotion. PLoS ONE, 12(1), e0170064. https://doi.org/10.1371/journal.pone.0170064
- Pye, S., Broad, O., Bataille, C., Brockway, P., Daly, H. E., Freeman, R., Gambhir, A., Geden, O., Rogan, F., Sanghvi, S., Tomei, J., Vorushylo, I., & Watson, J. (2021). Modelling net-zero emissions energy systems requires a change in approach. Climate Policy, 21(2), 222–231. https://doi.org/10.1080/14693062.2020.1824891
- Pye, S., & Li, F. G. N. (2017). Pathways to deep decarbonization of the passenger transport sector in the UK, IDDRI. https://ddpinitiative.org/pathways-to-deep-decarbonization-of-the-passenger-transport-sector-in-the-uk/
- Ravindranath, N. H., Sita Lakshmi, C., Manuvie, R., & Balachandra, P. (2011). Biofuel production and implications for land use, food production and environment in India. Energy Policy, 39(10), 5737–5745. https://doi.org/10.1016/j.enpol.2010.07.044
- RSA DMRE. (2020). South African Biofuels Regulatory Framework. Department of Mineral Resources and Energy, Republic of South Africa.
- Santangeli, A., Toivonen, T., Pouzols, F. M., Pogson, M., Hastings, A., Smith, P., & Moilanen, A. (2016). Global change synergies and trade-offs between renewable energy and biodiversity. GCB Bioenergy, 8(5), 941–951. https://doi.org/10.1111/gcbb.12299
- Schipper, L., et al. (2000). Flexing the link between transport and greenhouse gas emissions. IEA.
- SDSN & IDDRI. (2015). Deep carbonization pathways project pathways to deep decarbonization- 2015 synthesis report. https://www.iddri.org/sites/default/files/import/publications/ddpp_2015synthetisreport.pdf
- Sharmina, M., Edelenbosch, O. Y., Wilson, C., Freeman, R., Gernaat, D. E. H. J., Gilbert, P., Larkin, A., Littleton, E. W., Traut, M., van Vuuren, D. P., Vaughan, N. E., Wood, F. R., & Quéré, C. L. (2021). Decarbonising the critical sectors of aviation, shipping, road freight and industry to limit warming to 1.5–2°C. Climate Policy, 21(4), 455–474. https://doi.org/10.1080/14693062.2020.1831430
- SLOCAT. (2021a). Climate strategies for transport: An analysis of nationally determined contributions and long-term strategies. https://slocat.net/wp-content/uploads/2022/01/Climate-Strategies-for-Transport-An-Analysis-of-NDCs-and-LTS-SLOCAT-December-2021.pdf
- SLOCAT. (2021b). Tracking trends in a time of change: The need for radical action towards sustainable transport decarbonisation, transport and climate change global status report – 2nd edition. https://tcc-gsr.com/
- SUM4ALL. (2017). Global mobility report 2017: Tracking Sector Performance. Sustainable Mobility For All, Washington DC, License: Creative Commons Attribution CC BY 3.0. https://openknowledge.worldbank.org/bitstream/handle/10986/28542/120500.pdf?sequence = 6
- Tovilla, J., & Buira, D. (2017). Pathways to deep decarbonization of the passenger transport sector in Mexico, IDDRI. https://ddpinitiative.org/pathways-to-deep-decarbonization-of-the-passenger-transport-in-mexico/
- Trollip, H. (2021). Policy lessons on deep decarbonization in large emerging economies, South Africa. Deep Decarbonization Pathways (DDP) Initiative-IDDRI. Paris. https://ddpinitiative.org/wp-content/pdf/DDP_BIICS_CountryReport_ZAF.pdf
- UNFCCC. (2022). Retrieved Feb 24th, 2022, from https://unfccc.int/process/the-paris-agreement/long-term-strategies
- Vasconcelos Goes, G., Schmitz Gonçalves, D. N., de Almeida D’Agosto, M., de Mello Bandeira, R. A., & Grottera, C. (2020). Transport-energy-environment modeling and investment requirements from Brazilian commitments. Renewable Energy, 157, 303–311. https://doi.org/10.1016/j.renene.2020.05.032
- Villamar, D., Soria, R., Rochedo, P., Szklo, A., Imperio, M., Carvajal, P., & Schaeffer, R. (2021). Long-term deep decarbonisation pathways for Ecuador: Insights from an integrated assessment model. Energy Strategy Reviews, 35, Article 100637. https://doi.org/10.1016/j.esr.2021.100637
- Wachsmuth, J., & Duscha, V. (2019). Achievability of the Paris targets in the EU—the role of demand-side-driven mitigation in different types of scenarios. Energy Efficiency, 12(2), 403–421. https://doi.org/10.1007/s12053-018-9670-4
- Waisman, H., Bataille, C., Winkler, H., Jotzo, F., Shukla, P., Colombier, M., Buira, D., Criqui, P., Fischedick, M., Kainuma, M., La Rovere, E., Pye, S., Safonov, G., Siagian, U., Teng, F., Virdis, M.-R., Williams, J., Young, S., Anandarajah, G., & Trollip, H. (2019). A pathway design framework for national low greenhouse gas emission development strategies. Nature Climate Change, 9(4), 261–268. https://doi.org/10.1038/s41558-019-0442-8
- Waisman, H.-D., Guivarch, C., & Lecocq, F. (2013). The transportation sector and low-carbon growth pathways: Modelling urban, infrastructure, and spatial determinants of mobility. Climate Policy, 13(sup01), 106–129. https://doi.org/10.1080/14693062.2012.735916
- Yang, Y., & Diez-Roux, A. V. (2012). Walking distance by trip purpose and population subgroups. American Journal of Preventive Medicine, 43(1), 11–19. https://doi.org/10.1016/j.amepre.2012.03.015
- Zahavi, Y. (1974). Traveltime budgets and mobility in urban areas, US department of transportation.
- Zimbabwe Mail. (2021). Used car import ban rules clarified. The Zimbabwe Mail. https://www.thezimbabwemail.com/business/used-car-import-ban-rules-clarified
Appendices
Annex 1. The sectoral DDP design framework and modelling architectures used in the project
The method builds on two main modes of representations of pathways, called the storyline and the dashboard. The storyline structures the systemic description of all national and sectoral transformations towards carbon neutrality including at best the description of the enabling conditions across the economic, demographic, technological, organizational, behavioural and socio-cultural dimensions of feasibility (Statement D2.3 of [IPCC, Citation2018]), through qualitative and stakeholder-oriented descriptions. In complementarity, the dashboard structures a quantitative-only representation of the pathway through national and sectoral selected indicators facilitating stakeholder engagement and control of long-term objectives and transition effects. [Lefevre et al., Citation2020]
Figure A1. DDP Design framework for passenger transport (Lefevre et al., Citation2020).
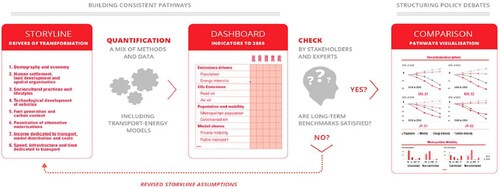
The quantification of the dashboard requires the use of different quantitative tools and methods. Most teams used a hybrid approach combining a transport sector model with an economy-wide general equilibrium model.
Table A1. Overview of the modelling and quantification architecture.
University Federal of Rio de Janeiro
The Transport-Energy-Emissions Multi-Tier Analysis (TEMA) model is used to articulate historical and future transport activity data with the resulting energy use and GHG emissions. Fundamentally, the TEMA model considers three fundamental approaches: bottom-up, top-down and Activity–Structure–Intensity–Fuel (ASIF). The joint application of the approaches depends on the availability of local data. In the Brazilian case, a tier 3 bottom-up approach is employed to calculate road transport emissions, since technology-level data is available locally. Other modes of transport such as air, rail, water (inland navigation and cabotage) and pipelines are estimated using the ASIF approach (Gonçalves et al., 2019). A top-down approach is then employed to verify and adjust the results of the other two approaches. Assumptions and hypotheses are defined after intensive literature reviews, interviews and workshops with stakeholders. Stakeholders receive prior training to standardize the opinions to be provided.
The results of the transport model and models from other Brazilian sectors are integrated into a hybrid multi-sector computable general equilibrium model, IMACLIM-BR, to evaluate the macroeconomic and social impacts of the proposed scenarios. The IMACLIM-BR details the Brazilian economy into 19 productive sectors, 4 income classes and 4 institutional sectors. An interactive process of adjustments and information exchange between models is required to provide a realistic national picture. Thus, each type of energy consumed in an end-use sector must be consistent with the capacity offered by the producing sectors. The measures implemented in each scenario are defined after conducting a marginal abatement cost curves (MACC) analysis, so only the most cost-effective ones are included. Detailed descriptions of the models and their connections are provided by La Rovere et. al. (2018) and Goes et al. (2020).
References
La Rovere, E. L., Wills, W., Grottera, C., Dubeux, C. B., & Gesteira, C. (2018). Economic and social implications of low-emission development pathways in Brazil. Carbon Management, 9(5), 563-574.
Gonçalves, D. N. S., Goes, G. V., Márcio de Almeida, D. A., & de Mello Bandeira, R. A. (2019). Energy use and emissions scenarios for transport to gauge progress toward national commitments. Energy Policy, 135, 110997.
Goes, G. V., Gonçalves, D. N. S., Márcio de Almeida, D. A., de Mello Bandeira, R. A., & Grottera, C. (2020). Transport-energy-environment modeling and investment requirements from Brazilian commitments. Renewable Energy, 157, 303-311.
Indian Institute of Ahmedabad
The researchers assume the range of quantitative drivers on modal distribution, car stock and car sales in the bottom-up model AIM/Enduse that is further based on the benchmark estimates for service share each technology. 40 passenger transport technologies and 30 fuels are described in the updated version of the model that provides much depth to the quantitative analysis. The benchmark estimates follow the qualitative storylines obtained after referring existent literature and stakeholder views. The model output for parameters such as sectoral energy consumption, household energy demand, energy prices and energy trade is fed into the economy-wide static model IMACLIM-IND that is calibrated for the year 2012 to get the output for horizon years 2030 and 2050. This top-down model is set up based on 22 sector classification comprising of 8 energy sectors- coal, coke, crude oil and non-transport fuels, biomass, natural gas, electricity and renewables; and 14 non-energy sectors that includes air, water, road and rail transport sectors among other economic sectors. Hybrid input-output table is constructed by extensive data treatment using the data on energy balance from IEA and supply-use tables from the Central Statistics Office that is further used for calibrating the IMACLIM-IND model (Gupta et al., 2018). The sectoral output from the top-down model is fed back into the AIM/Enduse model. This process is repeated until there is convergence of the shared outputs of the two models (Gupta et al., 2019; Gupta & Garg, 2020). This iterative method allows us to compute the transport service demand endogenously.
References
Gupta et al., 2018: Gupta, Dipti, Ghersi, F., Garg, A., 2018. Hybrid Input-Output tables for India at year 2012. Mendeley Data 2, 2 https://dxoi.org/10.17632/D7FFRYVTJK.2.
Gupta et al., 2019: Gupta, D., Ghersi, F., Vishwanathan, S.S., Garg, A., 2019a. Achieving sustainable development in India along low carbon pathways: Macroeconomic assessment. World Dev. 123, 104623. https://dxoi.org/10.1016/j.worlddev.2019.104623.
Gupta & Garg, 2020: Gupta, D., & Garg, A. (2020). Sustainable development and carbon neutrality: Integrated assessment of transport transitions in India. Transportation Research Part D: Transport and Environment, 85, 102474. https://dxoi.org/10.1016/j.trd.2020.102474
University of Cape Town
The Energy Systems Research Group’s linked energy-economic model, SATIMGE, is used in this study. The two individual models of which it consists (i.e. SATIM and SAGE) as well as the methodology of how they are linked are described by Arndt et al.(2016) and Merven et al.(2017). The figure below presents a simplified schematic of the linked model.
The linked model combines the bottom-up technology rich least-cost optimization South Africa TIMES (SATIM) energy systems model, with a detailed dynamic recursive computable general equilibrium model for South Africa (SAGE). The latter is calibrated such that the energy volumes in the model (e.g. measured in PJ) match those presented in SATIM’s energy balance. Energy/environment scenarios are constructed in the energy model, SATIM. An iterative process in which energy prices, investment expenditure and energy demand changes (including efficiency gains) is passed to the economic model, SAGE, which returns, in response to the latter information, expected Gross Domestic Product (GDP) and household income/expenditure. The economic information moderates the expansion determined by SATIM for energy supply such as electricity generation and liquid fuels, as well as demand for energy commodities by the economic sectors such as freight transport services for example. Furthermore, income grouping of households as quantified by SAGE (currently aggregated into three groups: low, middle, and high) determine the level of ownership of private vehicles and consequently the demand for public transport. Model choices are primarily determined by fuel, and technology costs, availability and conversion efficiency. In addition, carbon constraints (i.e. budgets) are imposed for deep decarbonization scenarios. Iteration occurs until economic growth converges in both models.
References
Arndt, C. Davies, R., Gabriel, S., Makrelov, K., Merven, B., Hartley, F. and Thurlow, J. 2016. A sequential approach to integrated energy modelling in South Africa. Applied Energy, 161:591–599. DOI: https://dxoi.org/10.1016/j.apenergy.2015.06.053
Merven, B., Arndt, C. and Winkler, H. 2017. The development of a linked modelling framework for analysing the socioeconomic impacts of energy and climate policies in South Africa. WIDER Working Paper, No. 2017/40, ISBN 978-92-9256-264-9, The United Nations University World Institute for Development Economics Research (UNU-WIDER), Helsinki.
The Institute Technology of Bandung
The researchers used the Deep Decarbonization Pathway Building Tool for passenger transport. This tool proposes a user-friendly approach to develop a narrative based on the main categories of transformations for this sector and translate it into quantitative assumptions. This tool is based on the sectoral DDP approach developed in [Lefevre, 2020] and the disaggregation of Activity-Structure-Intensity-Fuel (ASIF) indicators. All detailed indicators as well as the key interactions are accessible on [DDP Website, 2022].
References
Lefevre, J., Briand, Y., Pye, S., Tovilla, J., Li, F., Oshiro, K., Waisman, H., Cayla, J.-M., Zhang, R. (2020): A pathway design framework for sectoral deep decarbonization: the case of passenger transportation, Climate Policy. https://dxoi.org/10.1080/14693062.2020.1804817
DDP Website (2022). Pathway Building Tool. https://ddpinitiative.org/trp-mob-build/
Annex 2. Kaya identity and emissions
The Kaya identity over the period 2020–2050 includes the variations of capita, per capita mobility demand, energy consumption and energy carbon content.
Population and per capita mobility demand grow in all scenarios, with population growing by 10% in Brazil and up to 31-32% in India, Indonesia and South Africa, and per capita mobility demand growing by 17% in South Africa and up to 83% in Brazil (see section 3.2). However, this 83% growth of per capita mobility in Brazil between 2020 and 2050 is due to the modelling of the COVID-19 pandemic in 2020 which represented an important drop in mobility demand. When compared to the 2019-level, the per capita mobility demand grows by 58% over the period 2019-2050, similarly to India. These current development characteristics will therefore contribute to increasing emissions if there is no modal shift, no vehicle efficiency improvement or no shift towards vehicles powered with low-carbon fuels. Particularly alarming is the development of larger and heavier cars than before, so-called Sport Utility Vehicles [IEA SUV, Citation2021], while the trend should be to avoid unnecessary energy use.
Energy consumption reduces in all scenarios but based on quite different pathways. This contributes directly to lower the pressure on the production of zero-emission fuels. While the Brazilian and Indonesian scenarios see an almost linear decrease of 53-55% in energy consumption per pkm over the period, the South African scenario shows stronger reductions over the period 2030-2040, reaching up to 77% of reduction by 2050 compared to 2020. In comparison, the Indian scenario results in limited energy efficiency gains over the period, with most emission reductions coming from decarbonization of fuels, as shown by the purple trend line (see section 3.3 and section 3.4).
As with India, the reduction of the fuel carbon content contributes to most of the decarbonization efforts in South Africa (63%) over 2020–2050 (compared to 60% in India), while Brazil and Indonesia see a 42-45% reduction over the same period. This is due to a high electrification of the vehicles and a strong development of biofuels for specific uses (see section 3.4.).
In conclusion, while the population and access to mobility continues to grow in all countries, analyses highlight possible pathways for a low-carbon transition of the passenger transport sector. On a per capita basis, passenger transport emissions could be reduced by 35%−90% between 2050 and the baseline years, reaching less than 0.04 tCO2eq/cap in India and South Africa, around 0.1 tCO2eq/cap in Indonesia and around 0.2 tCO2eq/cap in Brazil. On a per passenger kilometres travelled (pkm) basis, emissions are reduced by 66-92% in 2050 relative to the baseline years, reaching less than 8 gCO2eq/pkm in India and South Africa and around 12gCO2eq/pkm in Indonesia and Brazil (See figure below).
Figure A2. Per capita and per passenger kilometre CO2eq emissions from passenger transport.