
ABSTRACT
Attempts to structurally transform segments of the agri-food system inevitably involve trade-offs between the priorities of actors with different incentives, perspectives and values. Trade-offs are context-specific, reflecting different socio-economic and political realities. We investigate the potential of structured boundary objects to facilitate exposing and reconciling these trade-offs within the context of multi-stakeholder social learning processes with pastoral and mixed crop-livestock communities in Burkina Faso, Ethiopia and Tanzania. Building on boundary objects as items flexible enough to be understood by all without having one common definition, structured boundary objects visualize actors’ input in a comparable format to facilitate knowledge sharing. Stakeholders in each country used a simulation tool and board game to explore the implications of changing livestock stocking and management practices for the environment and for actors’ future socio-economic priorities. Using structured boundary objects elicited trade-offs between household food and animal feed, and between livestock for income, labour, and/ or cultural functions, reflecting the context-specific and subjective evaluations actors make when attempting to plan livelihood changes. Our findings suggest to policy and decision-makers that sustainable transition plans can be developed when stakeholders in local agri-food systems employ approaches that allow shared understandings of trade-offs inherent to sustainable agriculture to emerge.
Introduction
Population and income growth in Africa will lead to an increase in demand for food and, in particular, for animal products (Enahoro et al., Citation2018). Increased crop and livestock production will inevitably compete for land and water with urbanization, industrial crop production, biofuel production and conservation of land under protected areas (Kariuki et al., Citation2018; Vlek et al., Citation2017). Some degree of intensification of production will be required so that sufficient calories and nutrients can be provided for an expanding population. To be sustainable, this intensification will need to maintain ecological integrity, livelihoods and wellbeing. This is a complex challenge and one that has given rise to much debate (e.g. Garnett, Citation2014; Haggar et al., Citation2018; Leach et al., Citation2013) and alternative strategies to address it (e.g. sustainable intensification (Pretty et al., Citation2011), climate smart agriculture (Lipper et al., Citation2014) and agro-ecology (Gliessman, Citation2016)). Solutions for changing livestock production systems are inevitably contested as each will have a range of better or worse consequences, generating new patterns of winners and losers among actors with unequal power and influence (Eriksen et al., Citation2015). Stakeholders, including researchers, policy makers, private enterprises, producers, community leaders, non-governmental organizations and civil society organizations, frequently hold different visions for a sustainable agriculture and livestock system, which can translate into conflicting priorities (e.g. Scown et al., Citation2019).
Gains in economic growth from increased livestock production compete with ‘losses’ associated with increased resource use and pollution, and/or losses of cultural, social and livelihood functions (e.g. Loos et al., Citation2014; Vlek et al., Citation2017). For example, high yielding livestock cannot replace draught power, or provide lower value animals for cultural rituals (Moll, Citation2005). Prioritization of gains and losses differ according to social norms, beliefs and perceptions of costs and risks (Garforth, Citation2015; Salmon et al., Citation2018; Tittonell, Citation2013). Apparently sustainable strategies for livestock may result in indirect or ‘hidden’ social and environmental consequences (Tschakert et al., Citation2017) and will likely distribute socio-economic impacts unevenly across actors, the more so when they are embedded in different social and cultural contexts (Beuchelt, Citation2016). As such, a given socio-economic gain can be realized in terms of environmental costs - or vice versa - in many ways.
This complexity suggests that diverse actors must participate in evaluating the relevance and weighting of trade-offs in a particular context and at a given scale (Thomson et al., Citation2019; Tschakert et al., Citation2017). While multi-stakeholder processes, such as those informed by social learning, have been proposed as a mechanism for exploring complex problems (Ison et al., Citation2007; Tschakert & Dietrich, Citation2010), the use of participatory processes comes with opportunities and challenges (Cooke & Kothari, Citation2001; Hickey & Mohan, Citation2004).
Participatory processes create opportunities for empowerment by including marginalized perspectives into decision-making and challenging dominant assumptions about which trade-offs or synergies are most appropriate (Capitani et al., Citation2019; Duncan & Claeys, Citation2018). When decision makers increase their awareness of the multiple, legitimate perspectives of an issue, the chance of positive outcomes increases, as does the transparency and legitimacy of decision-making (Cash et al., Citation2003; Clark et al., Citation2016). The design and facilitation of participatory events influence whether (or not) the process of participation opens spaces for innovation and transformation (Cornwall, Citation2004; Gaventa, Citation2006), with factors such as invitees, location and language influencing who is included or excluded from participating. Furthermore, no space for participation is neutral as hierarchy, rules and norms leak into the space with participants’ habits and experiences, and the risks of reinforcing existing power relations are considerable (Cornwall, Citation2004; Gaventa, Citation2006). While these power dynamics are not necessarily bad, it can be detrimental when they are ignored (Stirling et al., Citation2018). A facilitator thus has both the power and the responsibility to guide and intervene in discussions (Kapoor, Citation2002).
Ison (Citation2010) and Rist et al. (Citation2006) therefore call attention to the design of the participatory process, to ensure that it invites equal participation and provides rules for promoting open dialogue and the freedom to express oneself. This encourages negotiation based on rationality rather than influenced by hierarchy or emotion; in other words, creating the conditions for Habermas (Citation1981) communicative action. But sharing knowledge between stakeholders is not always straightforward (Lamont & Molnár, Citation2002; Oswick & Robertson, Citation2009). There are natural boundaries between stakeholders, reflecting levels of education, types of knowledge, experiences, and observed rules and norms (Lamont & Molnár, Citation2002). These differences can be exacerbated when, as is frequently the case in Africa, technical and scientific terminology does not translate well into local languages and understandings.
As discussed in more detail below, the concept of boundary objects, made popular by Star and Griesemer (Citation1989), has been increasingly used in literature on learning processes and structured multi-stakeholder methodologies to address facilitation of communication between stakeholders (e.g. Cash, Citation2001; Jean et al., Citation2018). Modelling, visualizations and games are being conceptualized as structured boundary objects for their ability to organize knowledge and produce comparable visual outputs that are useful for communication (Pennington, Citation2016). As such, they offer a means of facilitating shared learning and collaboration between stakeholders (Forrester et al., Citation2019a; Jakku & Thorburn, Citation2010). In this paper, we assess the benefits and challenges of using structured boundary objects in stakeholder processes to support meaningful stakeholder engagement. Focusing on the problem of livestock livelihood futures in Africa, we ask: (a) how effective are structured boundary objects in supporting knowledge sharing and learning between stakeholders, and (b) in doing so, how effective are they in supporting the identification of context-specific trade-offs? Our study looks at the deployment of a computer simulation and board game within a participatory process to co-design sustainable pathways for livestock production in three case study areas: Burkina Faso, Ethiopia and Tanzania. In the following sections, we describe the functions of boundary objects and, for our case, how the simulation tool and board game provided these functions. We then discuss how the boundary objects represent stakeholder perspectives and how the findings inform our understanding of the trade-offs implicit in sustainable livestock production.
Boundary objects
Boundary objects may mean different things to each actor, but are recognizable enough to allow meaningful communication around a common issue (Jakku & Thorburn, Citation2010). For example, design blueprints or scale models for new products allow architects, interior designers and engineers to fit their respective elements within common spaces, providing a medium for each actor to explain their ideas, concerns and requirements to the others (Carlile, Citation2002; Ewenstein & Whyte, Citation2009; Lee, Citation2007). In this way, boundary objects mediate between the values, interests and knowledges of people from intersecting lifeworlds (Long, Citation2001; Pennington, Citation2016). Importantly, all actors can contribute knowledge to a boundary object, modify it or use it in some way, providing a common point of reference. Boundary objects have, or rely on, some inherent infrastructure or standardization that allows diverse actors to work together (Star, Citation2010; Trompette & Vinck, Citation2009), such as where a standard classification template or computer program (Ewenstein & Whyte, Citation2009) establishes a common vocabulary to define and discuss the issue (e.g. Martin, Citation2015). Similarly, project management tools (e.g. Sapsed & Salter, Citation2004), mind maps (e.g. Sapsed & Salter, Citation2004; Subrahmanian et al., Citation2003), mental models (e.g. Thorburn et al., Citation2011; Walters et al., Citation2019), simulation models (e.g. Cash, Citation2001; Jakku & Thorburn, Citation2010) and games (e.g. Jean et al., Citation2018) have all been explored as boundary objects.
Boundary objects mediate between perspectives by making explicit actors’ interpretations of the objects and of the common issue, in turn supporting knowledge sharing (Forrester et al., Citation2019a; Jakku & Thorburn, Citation2010; Pennington, Citation2016). Similarly, boundary objects can be props for catalysing discussion that lead to fuller exploration of issues that are understood differently or incompletely by the actors, until a common level of understanding is reached (Lee, Citation2007; Wallis et al., Citation2017). An example is visual representations of reality, such as conceptual maps, mental models or social network maps, which create a tangible object that can be viewed and discussed (Black & Andersen, Citation2012; Forrester et al., Citation2019a; van Bruggen et al., Citation2019). Revealing and exploring differences through successive drafts of conceptual maps or scenarios, help to build mutual understanding of the different perspectives between actors in defining the issue, knowledge about the issue, and preferences or intentions for acting on the issue (Forrester et al., Citation2019a; Jakku & Thorburn, Citation2010; Klerkx et al., Citation2012). Identifying and reconciling mismatches in the perceptions of a boundary object and its outputs can build relationships and trust between actors and increase confidence in the object and transparency in the collaborative process (Cash, Citation2001; Jean et al., Citation2018; Martin, Citation2015).
Objects that do not allow collaboration are not boundary objects (Star, Citation2010). In Black and Andersen’s (Citation2012) example, when one actor replaced the shared visual representation with his own list, it was no longer a boundary object because none of the other actors could engage with it. This relates to authorship: who created and contributed to the boundary object. Narrow authorship, where there are knowledge or power imbalances, can reinforce dominant perspectives. The more powerful may not wish to be confronted with another perspective and others may refrain from contributing out of concern for how their stated positions might be used going forward (Oswick & Robertson, Citation2009).
Whether with narrow or wide authorship, boundary objects are external representations of reality that simplify an issue to be more easily communicated (Pennington, Citation2016). Understanding actors’ interpretations of the boundary objects is to hold up a ‘partial mirror’ reflecting their lifeworld, their perception of reality (Forrester et al., Citation2019b, p. 71). There is a three-way relation between what is being represented (reality), the representation itself (the boundary object) and the intentions, both of the creator and of the audience (Zeitlyn, Citation2010). As such, while boundary objects are created with an intention, once produced they take on a separate identity, and one cannot predict how they might be interpreted and used, or how they might evolve once created (e.g. Klerkx et al., Citation2012). Critical consideration of how representations are crafted (authorship) and the variety of ways in which they are used offers a gauge of the quality of the collaboration and the outcomes.
The ResLeSS learning process
The ‘Research and Learning for Sustainable intensification of Smallholder livestock value chains’ (ResLeSS) learning process was implemented during 2017–2018 in Bama commune in Hauts-Bassins region, Burkina Faso, in Atsbi woreda in Tigray region, Ethiopia and in Lushoto district in Tanga region, Tanzania (). The objective was to integrate environmental, economic and equity considerations into decision making around sustainable livestock production. The learning process, designed using social learning principles (Ensor & Harvey, Citation2015), comprised two participatory workshops in each site, supported by a scoping visit before the first workshop and development of the site-specific CLEANED-R tool before the second workshop (). Two facilitators led each stakeholders group, experts who spoke the local language and provided an interface between the research team and the local participants.
Figure 1. Summary of the stages of the ResLeSS learning process, highlighting the elements of the Transformation Game that functioned as boundary objects.
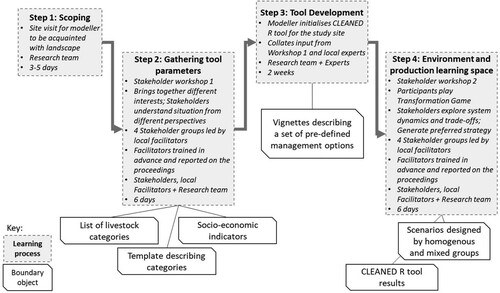
Table 1. Characteristics of the three study sites of the ResLeSS learning process.
The Transformation Game as a structured boundary object
In all except the first step in the learning process, participants and researchers created or used certain items that were instrumental in designing or playing the Transformation Game, which are conceptualized in this paper as boundary objects (). These boundary objects played complementary roles in facilitating participants’ engagement with the Transformation Game over the course of the learning process (, described in more detail in the supplementary Information).
Table 2. Overview of boundary objects in the ResLeSS process, which activities they were used in, correlated with boundary object functions, which lead to identifying trade-offs and social learning outcomes.
In Step 2, the list of livestock categories, created by the participants, and template for describing the categories, provided by the researchers, were the first boundary objects that brought people together and provided a common structure with which everyone could engage. The list of livestock categories classify the livestock in the study areas into sufficiently different groups for the CLEANED-R tool to model. Participants used the research team’s template to describe current and future management of livestock in each category, providing comparable feedbasket and manure management data for CLEANED-R (further details in Pfeifer et al., Citationsubmitted for review this issue). Participants also identified and defined socio-economic indicators reflecting aspects outside livestock that were of significance to them, such as children’s education, and peace of mind.
In Step 3, researchers built the CLEANED-R tool using the list of livestock categories and the category descriptions. To speed up gameplay in the second workshop, the research team created a selection of pre-defined management options for each livestock category (vignettes), although an experienced user could define their own management profile in the CLEANED-R tool user interface.
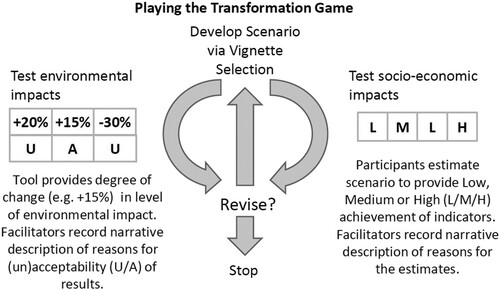
While playing the Transformation Game in Step 4, participants created the main structured boundary objects in the form of the scenarios they designed, first in homogeneous and then mixed stakeholder groups, to negotiate what would be acceptable or not across all stakeholder groups. Players designed scenarios by allocating the number of livestock and selecting their management (which vignette), in each livestock category; iteratively evaluating the scenario using the CLEANED-R tool results and their (subjective) assessment of the socio-economic indicators; and revising the scenario as necessary (). The scenarios are the external representation, or mirrors, of participants’ desired reality that elicit different perspectives in a structured manner to facilitate knowledge sharing. The vignettes, CLEANED-R tool results and socio-economic indicators function as boundary objects that provide information and prompt discussion of certain aspects to support evaluation of the scenarios.
Figure 2. Playing the Transformation Game: iteratively designing and evaluating scenarios of livestock production.
Data and methods of analysis
Data were collected using participant observation, feedback from the workshops and semi-structured interviews with participants from the two workshops in each of the three countries. Thematic analysis according to Braun and Clarke (Citation2006) was used to analyse the data.
The first and third authors participated in all six workshops, reflecting on the effectiveness of the process, emerging perspectives and participants’ engagement. Feedback from the workshops was gathered in workshop reports prepared by eight group facilitators in each workshop team on perspectives discussed by participants, their engagement and interaction with the process, as well as pre–post questionnaires before and after each workshop. Following the second workshop in each country, the first author carried out semi-structured interviews with eight (25%), ten (30%) and ten (29%) workshop participants in Burkina Faso, Ethiopia and Tanzania respectively. Interviewees, selected by a local team member, represented one or two individuals from each stakeholder group (e.g. producers, traders, processors, local administrators, local researchers or livestock ministry officials). The workshops, reporting and interviews took place during six two-week periods between 2017 and 2019.
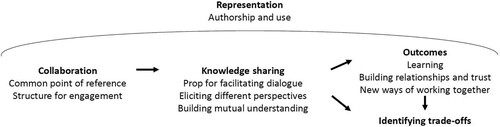
The workshop reports and transcripts of interviews were analysed in QSR International's NVivo 12 software (Richards, Citation1999), coding for how the Transformation Game functioned as a boundary object in supporting collaboration, knowledge sharing and learning, while reflecting on how the Transformation Game was created and used, as outlined in .
Figure 3. Functions and outcomes of boundary objects (authors’ illustration of concepts drawn from the literature).
Results
This section gives examples from each study site of how the Transformation Game provided opportunities to collaborate and props for discussion, how it exposed different perspectives and catalysed negotiations toward an agreed strategy.
Enabling collaboration
Once the stakeholders were in the same room, having a meaningful engagement process implies they were able to talk to each other. The list of livestock categories and template for describing their present and future management, as the initial boundary objects, established a common topic to talk about and a common vocabulary with which to talk about it.
The use of, and need for, these initial boundary objects became clear as actors have many different ways of classifying livestock, for example by breed (e.g. Zebu or Friesian), function (e.g. draught power, main herd or fattening), level of inputs, type of output (e.g. milk, meat), or ethnic groups. Particularly in Burkina Faso, no one could agree on how best to split up the livestock herd (cattle) into common livestock ‘systems’ for the study area – or, as the word ‘systems’ was too ambiguous or contentious, into categories: sufficiently distinct groups of animals that CLEANED-R could model. The groupings finally proposed by the modeller provided a common point of reference, to set common categories and common understandings of what those categories entailed, so that all participants were ‘on the same page’. This was as important in Ethiopia and Tanzania, where participants more readily agreed on categories themselves. The template provided a structure for describing the livestock management, to capture in a comparable way participants’ qualitative experience into quantitative input for the CLEANED-R model. As input into the CLEANED-R tool, these boundary objects meant participants could identify with the tool – they also set the scope for what could be manipulated when playing the Transformation Game, providing the vocabulary and structure for designing scenarios of livestock production.
The scenarios also facilitated collaboration - as comparable physical representations serving as a mirror reflecting the reality of the individual or group who designed the scenario, yet separate from the creator(s) (Forrester et al., Citation2019b). As such, they could be viewed, shared and built upon by other participants. In this way, participants could collaborate with each other to explore alternative options for the future.
Supporting knowledge sharing while playing the Transformation Game
Knowledge sharing happened throughout the ResLeSS process. Negotiating the list of livestock categories revealed different perspectives on classifying livestock, and the template regulated knowledge sharing between participants and researchers. Most knowledge sharing occurred while playing the Transformation Game, with the elements of the Game serving different boundary object functions. They iteratively provided props for facilitating dialogue, exposing different perspectives that needed to be explored, in turn bringing new knowledge into play, prompting new dialogue, and so on. This iterative process, conducted as a group, played an important role in building shared understanding of the different stakeholder priorities with respect to what they expected to achieve from livestock in the future. In turn, it provided opportunities for learning how to design scenarios that could meet those expectations. The following gives some examples.
Eliciting different perspectives when designing scenarios
The vignette descriptions provided new information about higher yielding cows and sheep. For many participants, the vignettes introduced new animals with higher milk or meat production potential than those currently found in the study area. Similarly, for many participants the vignettes showed that it is possible to increase production within their livestock category by providing good quality feed in sufficient quantities. The vignettes became props for stimulating dialogue: when selecting a vignette for each category, they stimulated discussions about the resource implications of different management strategies: when deciding how many animals to keep in each category, the discussion focused on the value placed on different categories of livestock. Exploring these issues exposed different and competing perspectives.
In all three countries, the choice of vignettes elicited different perspectives on the trade-off between food for the household and feed for the animals. Improving the feedbasket requires more financial resources to buy concentrates or planted fodder, or spare irrigated land to grow planted fodder. Some in Ethiopia and Tanzania would rather grow planted fodder as they consider it cheaper to buy staple food required by the household than to buy concentrates. In strong opposition to this view, others would not use ‘their little land available’ for planted fodder as they would lose the opportunity to secure food for the family. Similarly, sensitive higher-yielding breeds are more labour-intensive to care for and require more financial resources for maintaining their health. Some judged the increased milk yield to be sufficient to pay for higher investment in inputs while providing extra income for the household. However, those with little land or capital preferred to retain land for food production, hedging against emergencies with smaller animals that can easily be sold if required. The Tanzania stakeholder group scenarios reflect these perspectives as a gradient of intensification, with improved management of local and cross breeds for the more cautious and the most improved breeds and management for the more ambitious.
Discussions also revealed different understandings of livestock, not always as the primary source of income. Often it is a secondary support to cropping (where livestock is appropriated for labour and manure for fertiliser) or to off-farm income, and in all three countries there are cultural values and functions performed by local breeds for which high-performing breeds could not be a substitute. For the pastoralists, cattle are a substantive form of wealth and therefore more than a money-earner. Each of these considerations play a different role in the choice made by different actors over which animals to keep, in what numbers, and under what management practice. In the Tanzanian example, groups emphasised that while much of the current dairy herd should intensify, albeit to varying extents, there would remain a portion of the herd kept as it is today to satisfy cultural functions.
Eliciting different perspectives on the outcomes of the scenarios
Running the scenarios in CLEANED-R, the tool results provided a second round of new information, specifically including environmental measures to prompt exploration of issues the researchers felt might be important. The socio-economic indicators defined by the participants offered a third dimension, prompting discussion of the consequences in terms of ambitions for education for all children, sufficient food, health and peace of mind. The results were sometimes unexpected, usually when scenarios produced less meat and milk, or more greenhouse gas emissions, than anticipated.
This exploration exposed different perspectives on what participants had expected their chosen scenarios would achieve, and how they expected the scenarios to link to improving livelihoods and wellbeing. Revealing the differences between officials and experts (who have a mandate or interest to reduce greenhouse gas emissions and water use) and those concerned with how livestock products can support improved livelihoods, was useful. In Ethiopia, for example, both sides of the debate indicated how much they appreciated being confronted with the opposite view, as it prompted the mixed groups to seek a balance between increasing output and minimising environmental impact. Agreeing that specialized dairy production and sheep provide valuable social benefits to unemployed, landless and poorer households, the group agreed to offset increased greenhouse gases from specialized dairy by trading in beef production for mutton production. Yet, in all three countries, regardless of environmental indicators, scenarios that produced less than around 25% more meat or milk compared to today were considered to provide insufficient extra income to meet the socio-economic goals of the community, and therefore were deemed to be inadequate.
Mediating between different perspectives
In some cases, the Transformation Game, as a boundary object, functioned as an impartial voice to mediate in arguments and, in some cases, conflicts. In Ethiopia, the CLEANED-R results suggested that scenarios emphasising sheep produce less greenhouse gas emissions than those emphasising beef cattle. The results added weight to those arguing that sheep are less expensive and more easily managed, and therefore would benefit more households than cattle. In Burkina Faso, the tool results defused a heated discussion that reflects a wider history of dispute between pastoralists and settled farmers. First, the scenarios, which appeared in the Game as external representations of conflicting perspectives, were somewhat detached from the original proponents. Then, as participants came to ascribe a voice to the CLEANED-R tool, ‘the computer’, the tool results were seen as coming from an impartial party. The tool results provided an external, physical object which participants could address, ‘de-personalising’ the scenarios and their implications (e.g. Black & Andersen, Citation2012, p. 201). This allowed an objective debate between the conflicting perspectives, in a safe space, which was much appreciated by participants from each side. Explaining their evaluations of the scenarios drew out the rationales behind the opposing perspectives, painting a rich picture of both sides of the argument and offering the opportunity for each side to learn from the other. This was particularly the case for those with limited experience of or empathy with the broader context outside of their own life, such as a relatively wealthy male farmer that does not understand the challenge of a female-headed landless household.
Representing different perspectives
Participants’ use of the ResLeSS learning process exemplifies how boundary objects assist groups to ‘collectively make their thought and action more coherent’ (van Bruggen et al., Citation2019, p. 824). The scenarios produced in playing the Transformation Game, as physical representations of participants’ subjective realities, were used to facilitate or mediate the exploration of different perspectives. Reflecting on how these objects represent participants’ different perspectives gives an insight to how effectively the Transformation Game provided enabling conditions for meaningful engagement. The following section considers who took part in creating the boundary objects, how they were interpreted by others and what has been learnt about sustainable livestock production.
Authorship and use – who shaped the boundary objects and how were they used?
The findings offer lessons about how authorship shapes the use of boundary objects. First, users can only contribute to collective thought and action if they can identify with the structure of the boundary objects (Black & Andersen, Citation2012). Giving participants authorship, as input to the Transformation Game, meant that the scenarios could mirror their realities. The Burkina Faso example of very different stakeholder classifications of livestock illustrates the importance of ensuring the boundary object is constructed on common ground, using terminology they had collectively agreed (that is, the list of livestock categories).
The second lesson more broadly relates to the role of the research team’s authorship in influencing participation in and scope of the Transformation Game. For example, in Burkina Faso the researchers deliberately kept both the minority storyline (more animals kept in a similar way as today) as well as the majority storyline (intensification, which appeared in three of the four initial group scenarios) in the mixed starting scenarios. Maintaining diversity in the scenarios forced participants to consider both perspectives, thereby providing space for less powerful voices (pastoralists) to enter the debate instead of driving towards consensus too early (Muro & Jeffrey, Citation2008).
Pragmatic choices restricted the scope of discussions. For example, restricting the template to describe only animal management gathered sufficient information, fairly quickly, to populate the CLEANED-R tool. However, participants could not contribute how livestock fits into the rest of their lives, as in Tanzania where many dairy cattle are complementary to the main activity of horticulture, providing manure for the fields. As such, the scenario ‘mirrors’ filter out activities such as crop production or off-farm livelihoods that complement or compete with livestock production in any of the categories.
Similarly, the researchers embedded the CLEANED-R tool in the Transformation Game to make it more accessible in a participatory setting, which included pre-selecting a set of management options (vignettes) to simplify the scope in designing scenarios. As another simplification, users could only select one vignette per livestock category. One scenario is therefore good at reflecting one actor’s vision, a mirror of their reality – but a ‘partial mirror’ when compared to the diverse visions of other actors, reflected in their scenarios (Forrester et al., Citation2019b, p. 71). Learning from the partial mirrors, groups can acknowledge the variety of preferences households have for how to engage with changes in livestock categories. In the Tanzania example, groups would have selected two vignettes in certain categories to show that only some producers will transition to new management. Those preferences are shaped by producers’ ability and resources (Udo et al., Citation2011) and their perspectives on the role of livestock (van Bruggen et al., Citation2019), such as ambition to be early adopters of new breeds, caution about the risks involved, interest in conserving cultural functions or focus on other primary income activities. The final scenarios might best be referred to as composite mirrors that collate the preferences expressed in the partial mirrors. The CLEANED-R tool intentionally models producers as a collective, representing the animals associated with the landscape in livestock categories that are meaningful to the stakeholders and thereby encapsulating this diversity in preferences by translating the diverse strategies into the common denominator of biophysical feed demand (Lannerstad et al., Citationsubmitted for review). The simplified Transformation Game guides participants to consciously chart the diversity and combine it into one representative vignette per category, reflecting an average or most common strategy.
At the same time, the physical representation of each composite scenario veils diversity for new viewers by presenting just one vignette per category. As van Bruggen et al. (Citation2019) find in their work and that of others (e.g. Salvini et al., Citation2016), the most significant learning in participatory modelling or gaming exercises happened when there was deep discussion and reflection within the group about the scenarios or outcomes. The results presented here reflect this – the important learning about the diversity encoded in the composite mirror remains with the group members who agreed which vignette should represent the average, or most common, management within each category. Similarly, the Transformation Game, and the embedded CLEANED-R tool, are useful as a means (as a boundary object within a learning process), but are not an end in themselves for answering complex questions.
The Transformation Game and the scenarios have thus been shaped by the intentions of their creators. The research team intended to support communication and learning between participants in a short space of time, with particular attention to securing a place for minority or less powerful voices. The participants intended to showcase their perspectives. However, once created, the Transformation Game and scenarios became independent objects that were used by others to serve their own purposes (Zeitlyn, Citation2010). Many participants used the Transformation Game to enhance their own knowledge, about new breeds and management practices to increase yield, and about the greenhouse gases that dominate the concerns of higher-level actors. Some used the scenarios to advocate strongly for their perspectives. This was conspicuously the case in Burkina Faso, where the Transformation Game gave pastoralists an opportunity to have their voices heard and to make the case for a viable livestock future that includes pastoralist livelihoods. In turn, the researchers found the actors’ interaction with the Transformation Game instructive in identifying how the interface and information provided by the tool could be made most relevant to the actors (Cash, Citation2001).
Understandings of intensification
Our results reflect existing literature that emphasises how different understandings and prioritization of trade-offs influence farm level decision making and shape or constrain opportunities for taking steps towards intensification (Salmon et al., Citation2018; Udo et al., Citation2011). Literature challenging whether we should be focussing on sustainable intensification suggests that it may be more important to focus on outcomes in order to meet both production and livelihood objectives (Mehrabi et al., Citation2017). Being open to viewing the situation from different standpoints can identify different methods or pathways, and may ultimately challenge outsiders’ views of the most appropriate objectives (Ensor et al., Citation2019; Nightingale, Citation2015). In Tanzania, intensification in the highland part of Lushoto makes sense as land is severely limited and free grazing is forbidden. However, for pastoralists in Burkina Faso, the discourse around intensification directly threatens the social, cultural and economic basis of their livelihood (Gonin & Gautier, Citation2015). Recognizing this claim to pastoralism opens the space for alternative understandings of livestock futures, which may not surface when discussion is premised on a narrow view of intensification and assumption of meat and milk production as the primary role of livestock. And, indeed, other studies confirm the potential for some locally co-adapted farming and agro-pastoral systems to be more sustainable, in their physical and social context, than an intensified alternative (Jones & Thornton, Citation2009; Ran et al., Citation2017; Scoones, Citation1995; Wynants et al., Citation2019).
A meaningful stakeholder engagement process that elicits these different objectives and pathways must then be flexible enough to include them when exploring future alternatives for livestock production. This involves designing the process to encourage different viewpoints, but also to be adaptable if new actors or information needs are identified. The ResLeSS learning process succeeded in drawing out different perspectives by using structured boundary objects around which to focus a discussion that was open to different voices. Yet, by focusing on the livestock value chain rather than the landscape or food system (e.g. Sayer et al., Citation2013) other actors were not represented, such as crop producers, land planners and urban developers in Burkina Faso, finance institutions in Ethiopia, and forest managers in Tanzania. Widening stakeholder participation would add new perspectives on how intensification or alternative options interact with broader social, economic and land use systems, to further understand hidden trade-offs and how transforming livestock systems can match the specificities of the local context. For example, urban developers in Burkina Faso may challenge the sustainability of maintaining or increasing the demand for land – and would be available to negotiate a compromise in planning livestock or urban expansion. Adapting the process to cater for the additional perspectives means having flexibility in time and resources for engaging new actors, and adjusting the structure of the boundary objects to support new actors’ engagement. For example, the common point of reference may evolve as stakeholder participation widens, and they may need different information to support discussion. Catering to different information needs means that boundary objects, such as the ‘tool’ at the centre of the learning process are not fixed. As a prop to catalyse discussion rather than an end in itself, it may be valuable to have a range of tools on hand, or to be flexible to bringing in appropriate tools once the information needs have been defined, after agreeing on common objectives to explore.
Conclusion
Our findings suggest that using boundary objects in a learning process offers a structured way of learning and sharing knowledge. Structuring stakeholders’ interaction opens spaces for exploring differing values and priorities. Compiling and using a simulation tool embedded into a learning process, in the form of the Transformation Game, supported stakeholders in local agri-food systems to share perspectives on which strategies for transforming livestock production would be deemed acceptable. Although this study confirmed that meat and milk output are key evaluation criteria, discussions also raised the value of livestock in supporting other livelihood activities and cultural functions. Further, participants came to understand better how and why people make trade-offs when they have to weigh individual needs and priorities against societal needs. In this way, the boundary objects provided space for understanding how intensification and alternative options may be better or worse for different stakeholders and contexts. Clearly, increased demand on food systems across the African continent will inevitably compete for land with urbanization, industrial crop production, biofuel production and conservation; open dialogue using boundary objects offers an approach to navigate through this increasingly complex landscape and ultimately underpin sustainable livestock transformation.
The boundary object lens also offers an entry point to assess the significance of authorship in the learning process. Being aware of who created the boundary objects and how the objects were used gives an insight into the outcomes of the learning process and the extent to which they are representative of the stakeholders involved. By providing a common point of reference, a structure, and props for catalysing discussion, boundary objects offer ways to raise, manage and reconcile different perspectives, value systems and objectives. Yet they do so in ways that inevitably reflect choices made by those in control of authorship, and are capitalized on by participants in unpredictable ways. The experiences of working with the Transformation Game suggest that incorporating boundary objects into collaboration and learning processes offers enabling conditions for meaningful stakeholder engagement on complex issues, but also that similar processes need to be deployed critically and flexibly to capture the emerging priorities of participants as well as users.
Acknowledgments
We thank INERA, ESRC/PSI and SUA, in Burkina Faso, Ethiopia and Tanzania sites respectively. We also thank Dr Barbara Rischkowsky and Dr Mulugeta Birhanu from ICARDA and Dr Amos Omore from ILRI for their continuous support. We extend our sincere gratitude to all participants who engaged with our learning process and interviews. Particular thanks go to the facilitators who led the stakeholder groups in the workshops and provided the documentation that formed the basis of this paper: Albert Soudre, Arnaud A. R. Tapsoba, Diane Benao/Kantiono, Safoura Dindane / Ouedraogo, Timbilfou Kiendrebeogo, Almamy Konate, Dominique Ouédraogo, Seydou Sanou, Fabiola Traore, Pierre Zongo, Cassilde Muhoza, Tetemke Kidane, Getachew Hruy, Kinfe Mezgebe, Mulualem Alemayehu, Berhanu Arbissie, Melaku Berhe, Kiros Habtu Ferede, Genet Feseha, Tesfay Hagos, Embaye Kidanu, Dawit Mengistu, Tewodros Tadesse, Meheretu Yonas, Eliezer Moses, Elizebeth Msoka, Judith S. Kahamba, Boniface H. J. Massawe, Nickson P. Mkiramweni, Mathew L Sengelela, Omari Mahimbo, Silvia Mashare, Hassan Mdoembazi, Ayubu Omari. We would like to thank John Forrester for inspiring discussions and one anonymous reviewer for their comments on this article. CLEANED-R tool development was additionally supported by the Livestock and Fish as well as the Livestock Program at ILRI. ILRI thanks all donors and organizations that globally support its work through their contributions to the CGIAR Trust Fund.
Disclosure statement
No potential conflict of interest was reported by the author(s).
Additional information
Funding
Notes on contributors
Joanne Morris
Joanne Morris is a Research Associate at the Stockholm Environment Institute in the Department of Environment and Geography, University of York, UK, with research interests in resource management in agricultural systems.
Jonathan E. Ensor
Jonathan E. Ensor is a Senior Research Fellow at the Stockholm Environment Institute in the Department of Environment and Geography, University of York, UK, with research interests in processes that can lead to increasingly equitable and resilient human development. He was Principal Investigator for the ResLeSS project.
Catherine Pfeifer
Catherine Pfeifer is a spatial analyst, previously a Scientist at the International Livestock Research Institute (ILRI), Nairobi, Kenya, and now a Senior Scientist in the Department of Socio-Economic Sciences, Research Institute of Organic Agriculture (FiBL), Switzerland. She is the modeler of the CLEANED-R tool.
Robert Marchant
Robert Marchant is Professor of Tropical Ecology in the Department of Environment and Geography, University of York, UK, and head of the York Institute for Tropical Ecosystems (KITE), with research and teaching interests focused on vegetation dynamics and ecosystem change.
Dawit W. Mulatu
Dawit W. Mulatu is a Research Fellow at the Environment and Climate Research Center (ECRC), EfD-Ethiopia, in the Policy Studies Institute (PSI), Addis Ababa, Ethiopia, with an interest in resource and environmental economics as well as a consultant on environment and climate at the World Bank, Environment, Natural Resources and the Blue Economy Global Practice, Africa Region, Ethiopia.
Geofrey Soka
Geofrey Soka is a Senior Lecturer in the College of Forestry, Wild life and Tourism at Sokoine University of Agriculture, Tanzania, with interests in landscape ecology, conservation biology, and plant-herbivore-environment interactions.
Salifou Ouédraogo-Koné
Salifou Ouédraogo-Koné is a Lecturer and Researcher at the Université Nazi BONI of Burkina Faso in Bobo-Dioulasso, working in the area of animal nutrition, as well as the director of the Institute of Rural Development, Bobo-Dioulasso, Burkina Faso.
Mekonnen B. Wakeyo
Mekonnen B. Wakeyo is a Researcher in the Agriculture and Rural Development Research Center at the Policy Study Institute (PSI), Addis Ababa, Ethiopia, with interests in agricultural and environmental economics, natural resource and industrial economics.
Corrado Topi
Corrado Topi is a Senior Research Fellow and an ecological economist at the Stockholm Environment Institute Research Centre in the Department of Environment and Geography at the University of York, UK. He focuses on sustainability, resilience and change in the context of integrated social, economic and environmental systems with particular regard to economics and finance and private enterprises.
References
- Beuchelt, T. D. (2016). Gender, social equity and innovations in smallholder farming systems: Pitfalls and pathways. In F. W. Gatzweiler, & J. von Braun (Eds.), Technological and institutional innovations for marginalized smallholders in agricultural development (pp. 181–198). Springer International Publishing.
- Black, L. J., & Andersen, D. F. (2012). Using visual representations as boundary objects to resolve conflict in collaborative model-building approaches. Systems Research and Behavioral Science, 29(2), 194–208. https://doi.org/https://doi.org/10.1002/sres.2106
- Braun, V., & Clarke, V. (2006). Using thematic analysis in psychology. Qualitative Research in Psychology, 3(2), 77–101. https://doi.org/https://doi.org/10.1191/1478088706qp063oa
- Capitani, C., Garedew, W., Mitiku, A., Berecha, G., Hailu, B. T., Heiskanen, J., Hurskainen, P., Platts, P. J., Siljander, M., Pinard, F., Johansson, T., & Marchant, R. (2019). Views from two mountains: Exploring climate change impacts on traditional farming communities of Eastern Africa highlands through participatory scenarios. Sustainability Science, 14(1), 191–203. https://doi.org/https://doi.org/10.1007/s11625-018-0622-x
- Carlile, P. R. (2002). A pragmatic view of knowledge and boundaries: Boundary objects in new product development. Organization Science, 13(4), 442–455. https://doi.org/https://doi.org/10.1287/orsc.13.4.442.2953
- Cash, D. W. (2001). “In order to aid in diffusing useful and practical information”: agricultural extension and boundary organizations. Science, Technology, & Human Values, 26(4), 431–453. https://doi.org/https://doi.org/10.1177/016224390102600403
- Cash, D. W., Clark, W. C., Alcock, F., Dickson, N. M., Eckley, N., Guston, D. H., Jäger, J., & Mitchell, R. B. (2003). Knowledge systems for sustainable development. Proceedings of the National Academy of Sciences, 100(14), 8086–8091. https://doi.org/https://doi.org/10.1073/pnas.1231332100
- Clark, W. C., Kerkhoff, L. v., Lebel, L., & Gallopin, G. C. (2016). Crafting usable knowledge for sustainable development. Proceedings of the National Academy of Sciences, 113(17), 4570–4578. https://doi.org/https://doi.org/10.1073/pnas.1601266113
- Cooke, B., & Kothari, U. (2001). Participation: The new tyranny? Zed Books.
- Cornwall, A. (2004). Spaces for transformation? Reflections on issues of power and difference in participation in development. In S. Hickey, & G. Mohan (Eds.), Participation–from tyranny to Transformation?: Exploring new approaches to participation in development (pp. 75–91). Zed Books.
- Duncan, J., & Claeys, P. (2018). Politicizing food security governance through participation: Opportunities and opposition. Food Security, 10(6), 1411–1424. https://doi.org/https://doi.org/10.1007/s12571-018-0852-x
- Enahoro, D., Lannerstad, M., Pfeifer, C., & Dominguez-Salas, P. (2018). Contributions of livestock-derived foods to nutrient supply under changing demand in low- and middle-income countries. Global Food Security, 19, 1–10. https://doi.org/https://doi.org/10.1016/j.gfs.2018.08.002
- Ensor, J., & Harvey, B. (2015). Social learning and climate change adaptation: Evidence for international development practice. Wiley Interdisciplinary Reviews: Climate Change, 6(5), 509–522. https://doi.org/https://doi.org/10.1002/wcc.348
- Ensor, J. E., Wennström, P., Bhatterai, A., Nightingale, A. J., Eriksen, S., & Sillmann, J. (2019). Asking the right questions in adaptation research and practice: Seeing beyond climate impacts in rural Nepal. Environmental Science & Policy, 94, 227–236. https://doi.org/https://doi.org/10.1016/j.envsci.2019.01.013
- Eriksen, S. H., Nightingale, A. J., & Eakin, H. (2015). Reframing adaptation: The political nature of climate change adaptation. Global Environmental Change, 35, 523–533. https://doi.org/https://doi.org/10.1016/j.gloenvcha.2015.09.014
- Ewenstein, B., & Whyte, J. (2009). Knowledge practices in design: The role of visual representations as `Epistemic Objects’. Organization Studies, 30(1), 07–30. https://doi.org/https://doi.org/10.1177/0170840608083014
- Forrester, J., Matin, N., Taylor, R., Pedoth, L., Davis, B., & Deeming, H. (2019a). Managing complex systems: The need to structure qualitative data. In H. Deeming, M. Fordham, C. Kuhlicke, L. Pedoth, S. Schneiderbauer, & C. Shreve (Eds.), Framing community disaster resilience: Resources, capacities, learning, and action (pp. 125–138). John Wiley & Sons.
- Forrester, J., Taylor, R., Pedoth, L., & Matin, N. (2019b). Wicked problems: Resilience, adaptation, and complexity. In H. Deeming, M. Fordham, C. Kuhlicke, L. Pedoth, S. Schneiderbauer, & C. Shreve (Eds.), Framing community disaster resilience: Resources, capacities, learning, and action (pp. 61–75). John Wiley & Sons.
- Garforth, C. (2015). Livestock Keepers’ reasons for doing and Not doing things which governments, vets and scientists would like them to do. Zoonoses and Public Health, 62, 29–38. https://doi.org/https://doi.org/10.1111/zph.12189
- Garnett, T. (2014). Three perspectives on sustainable food security: Efficiency, demand restraint, food system transformation. What role for life cycle assessment? Journal of Cleaner Production, Towards eco-Efficient Agriculture and Food Systems: Selected Papers From the Life Cycle Assessment (LCA) Food Conference, 2012, in Saint Malo, France, 73, 10–18. https://doi.org/https://doi.org/10.1016/j.jclepro.2013.07.045
- Gaventa, J. (2006). Finding the spaces for change: A power analysis. IDS Bulletin, 37(6), 23–33. https://doi.org/https://doi.org/10.1111/j.1759-5436.2006.tb00320.x
- Gliessman, S. (2016). Transforming food systems with agroecology. Agroecology and Sustainable Food Systems, 40(3), 187–189. https://doi.org/https://doi.org/10.1080/21683565.2015.1130765
- Gonin, A., & Gautier, D. (2015). Shift in herders’ territorialities from regional to local scale: The political ecology of pastoral herding in western Burkina Faso. Pastoralism, 5(1), 7. https://doi.org/https://doi.org/10.1186/s13570-015-0023-z
- Habermas, J. (1981). The theory of communicative action - volume 1 (Translated by T. McCarthy, 1984). Beacon Press.
- Haggar, J., Lamboll, R., & Nelson, V. (2018). Understanding different perspectives on Sustainable Agricultural Intensification and how it can be achieved (SAIRLA Working Paper No. 1). National Resources Institute, Chatham.
- Hickey, S., & Mohan, G. (2004). Participation–from Tyranny to Transformation?: Exploring new approaches to participation in development. Zed Books.
- Ison, R. (2010). Traditions of understanding: Language, dialogue and experience. In C. Blackmore (Ed.), Social learning systems and communities of practice (pp. 73–87). Springer.
- Ison, R., Röling, N., & Watson, D. (2007). Challenges to science and society in the sustainable management and use of water: Investigating the role of social learning. Environmental Science & Policy, Social Learning: An Alternative Policy Instrument for Managing in the Context of Europe’s Water, 10, 499–511. https://doi.org/https://doi.org/10.1016/j.envsci.2007.02.008
- Jakku, E., & Thorburn, P. J. (2010). A conceptual framework for guiding the participatory development of agricultural decision support systems. Agricultural Systems, 103(9), 675–682. https://doi.org/https://doi.org/10.1016/j.agsy.2010.08.007
- Jean, S., Medema, W., Adamowski, J., Chew, C., Delaney, P., & Wals, A. (2018). Serious games as a catalyst for boundary crossing, collaboration and knowledge co-creation in a watershed governance context. Journal of Environmental Management, 223, 1010–1022. https://doi.org/https://doi.org/10.1016/j.jenvman.2018.05.021
- Jones, P. G., & Thornton, P. K. (2009). Croppers to livestock keepers: Livelihood transitions to 2050 in Africa due to climate change. Environmental Science & Policy. Special Issue: Food Security and Environmental Change, 12, 427–437. https://doi.org/https://doi.org/10.1016/j.envsci.2008.08.006
- Kapoor, I. (2002). The Devil’s in the theory: A critical assessment of Robert Chambers’ work on participatory development. Third World Quarterly, 23(1), 101–117. https://doi.org/https://doi.org/10.1080/01436590220108199
- Kariuki, R., Willcock, S., & Marchant, R. (2018). Rangeland livelihood strategies under varying climate Regimes: Model insights from Southern Kenya. Land, 7(2), 47. https://doi.org/https://doi.org/10.3390/land7020047
- Klerkx, L., van Bommel, S., Bos, B., Holster, H., Zwartkruis, J. V., & Aarts, N. (2012). Design process outputs as boundary objects in agricultural innovation projects: Functions and limitations. Agricultural Systems, 113, 39–49. https://doi.org/https://doi.org/10.1016/j.agsy.2012.07.006
- Lamont, M., & Molnár, V. (2002). The study of boundaries in the social sciences. Annual Review of Sociology, 28(1), 167–195. https://doi.org/https://doi.org/10.1146/annurev.soc.28.110601.141107
- Lannerstad, M., Ran, Y., Notenbaert, A. M. O., Fraval, S., Morris, J., Pfeifer, C., & Paul, B. K., submitted for review. Cleaned: A rapid ex-ante environmental livestock production assessment framework applied in three low income countries. Ecological Indicators.
- Leach, M., Raworth, K., & Rockström, J. (2013). Between social and planetary boundaries: Navigating pathways in the safe and just space for humanity. In World social science report 2013, changing global environments (pp. 84–89). OECD Publishing and UNESCO Publishing. https://doi.org/https://doi.org/10.1787/9789264203419-10-en
- Lee, C. P. (2007). Boundary negotiating artifacts: Unbinding the routine of boundary objects and embracing chaos in collaborative work. Computer Supported Cooperative Work (CSCW), 16(3), 307–339. https://doi.org/https://doi.org/10.1007/s10606-007-9044-5
- Lipper, L., Thornton, P., Campbell, B. M., Baedeker, T., Braimoh, A., Bwalya, M., Caron, P., Cattaneo, A., Garrity, D., Henry, K., Hottle, R., Jackson, L., Jarvis, A., Kossam, F., Mann, W., McCarthy, N., Meybeck, A., Neufeldt, H., Remington, T., … Torquebiau, E. F. (2014). Climate-smart agriculture for food security. Nature Climate Change, 4(12), 1068–1072. https://doi.org/https://doi.org/10.1038/nclimate2437
- Long, N. (2001). Development sociology: Actor perspectives. Routledge.
- Loos, J., Abson, D. J., Chappell, M. J., Hanspach, J., Mikulcak, F., Tichit, M., & Fischer, J. (2014). Putting meaning back into “sustainable intensification.”. Frontiers in Ecology and the Environment, 12(6), 356–361. https://doi.org/https://doi.org/10.1890/130157
- Martin, G. (2015). A conceptual framework to support adaptation of farming systems – development and application with forage rummy. Agricultural Systems, 132, 52–61. https://doi.org/https://doi.org/10.1016/j.agsy.2014.08.013
- Mehrabi, Z., Seufert, V., & Ramankutty, N. (2017). The conventional versus alternative agricultural divide: A response to Garibaldi et al. Trends in Ecology & Evolution, 32(10), 720–721. https://doi.org/https://doi.org/10.1016/j.tree.2017.07.011
- Moll, H. A. J. (2005). Costs and benefits of livestock systems and the role of market and nonmarket relationships. Agricultural Economics, 32(2), 181–193. https://doi.org/https://doi.org/10.1111/j.0169-5150.2005.00210.x
- Muro, M., & Jeffrey, P. (2008). A critical review of the theory and application of social learning in participatory natural resource management processes. Journal of Environmental Planning and Management, 51(3), 325–344. https://doi.org/https://doi.org/10.1080/09640560801977190
- Nightingale, A. J. (2015). Adaptive scholarship and situated knowledges? Hybrid methodologies and plural epistemologies in climate change adaptation research. Area, 48(1), 41–47. https://doi.org/https://doi.org/10.1111/area.12195
- Oswick, C., & Robertson, M. (2009). Boundary objects reconsidered: From bridges and anchors to Barricades and Mazes. Journal of Change Management, 9(2), 179–193. https://doi.org/https://doi.org/10.1080/14697010902879137
- Pennington, D. (2016). A conceptual model for knowledge integration in interdisciplinary teams: Orchestrating individual learning and group processes. Journal of Environmental Studies and Sciences, 6(2), 300–312. https://doi.org/https://doi.org/10.1007/s13412-015-0354-5
- Pfeifer, C., Morris, J., Ensor, J. E., Ouedraogo, S., Mulatu, D. W., & Wakeyo, M. B., submitted for review. Designing sustainable pathways for the livestock sector: The example of Atsbi, Ethiopia and Bama, Burkina Faso. International Journal of Agricultural Sustainability.
- Pretty, J., Toulmin, C., & Williams, S. (2011). Sustainable intensification in African agriculture. International Journal of Agricultural Sustainability, 9(1), 5–24. https://doi.org/https://doi.org/10.3763/ijas.2010.0583
- Ran, Y., van Middelaar, C. E., Lannerstad, M., Herrero, M., & de Boer, I. J. M. (2017). Freshwater use in livestock production—To be used for food crops or livestock feed? Agricultural Systems, 155, 1–8. https://doi.org/https://doi.org/10.1016/j.agsy.2017.03.008
- Richards, L. (1999). Using NVIVO in qualitative research. SAGE.
- Rist, S., Chiddambaranathan, M., Escobar, C., & Wiesmann, U. (2006). “It was hard to come to mutual understanding … ”—The multidimensionality of social learning processes concerned with sustainable natural resource use in India, Africa and Latin America. Systemic Practice and Action Research, 19(3), 219–237. https://doi.org/https://doi.org/10.1007/s11213-006-9014-8
- Salmon, G., Teufel, N., Baltenweck, I., van Wijk, M., Claessens, L., & Marshall, K. (2018). Trade-offs in livestock development at farm level: Different actors with different objectives. Global Food Security, 17, 103–112. https://doi.org/https://doi.org/10.1016/j.gfs.2018.04.002
- Salvini, G., van Paassen, A., Ligtenberg, A., Carrero, G. C., & Bregt, A. K. (2016). A role-playing game as a tool to facilitate social learning and collective action towards climate smart agriculture: Lessons learned from Apuí, Brazil. Environmental Science & Policy, 63, 113–121. https://doi.org/https://doi.org/10.1016/j.envsci.2016.05.016
- Sapsed, J., & Salter, A. (2004). Postcards from the edge: Local communities, global programs and boundary objects. Organization Studies, 25(9), 1515–1534. https://doi.org/https://doi.org/10.1177/0170840604047998
- Sayer, J., Sunderland, T., Ghazoul, J., Pfund, J.-L., Sheil, D., Meijaard, E., Venter, M., Boedhihartono, A. K., Day, M., Garcia, C., Oosten, C. v., & Buck, L. E. (2013). Ten principles for a landscape approach to reconciling agriculture, conservation, and other competing land uses. Proceedings of the National Academy of Sciences, 110(21), 8349–8356. https://doi.org/https://doi.org/10.1073/pnas.1210595110
- Scoones, I.1995). Living with uncertainty: New directions in pastoral development in Africa. Intermediate Technology Publications.
- Scown, M. W., Winkler, K. J., & Nicholas, K. A. (2019). Aligning research with policy and practice for sustainable agricultural land systems in Europe. Proceedings of the National Academy of Sciences, 116(11), 4911–4916. https://doi.org/https://doi.org/10.1073/pnas.1812100116
- Star, S. L. (2010). This is not a boundary object: Reflections on the origin of a concept. Science, Technology, & Human Values, 35(5), 601–617. https://doi.org/https://doi.org/10.1177/0162243910377624
- Star, S. L., & Griesemer, J. R. (1989). Institutional ecology, `translations’ and boundary objects: Amateurs and Professionals in Berkeley’s Museum of vertebrate zoology, 1907–39. Social Studies of Science, 19(3), 387–420. https://doi.org/https://doi.org/10.1177/030631289019003001
- Stirling, A., Ely, A., & Marshal, F. (2018). How do we ‘co-produce’ transformative knowledge? STEPS Centre. Retrieved July 2, 2018, from https://steps-centre.org/blog/how-do-we-co-produce-transformative-knowledge/.
- Subrahmanian, E., Monarch, I., Konda, S., Granger, H., Milliken, R., Westerberg, A., & Then-dim group (2003). Boundary objects and prototypes at the interfaces of engineering design. Computer Supported Cooperative Work (CSCW), 12(2), 185–203. https://doi.org/https://doi.org/10.1023/A:1023976111188
- Thomson, A. M., Ellis, E. C., Grau, H. R., Kuemmerle, T., Meyfroidt, P., Ramankutty, N., & Zeleke, G. (2019). Sustainable intensification in land systems: Trade-offs, scales, and contexts. Current Opinion in Environmental Sustainability, 38, 37–43. https://doi.org/https://doi.org/10.1016/j.cosust.2019.04.011
- Thorburn, P. J., Jakku, E., Webster, A. J., & Everingham, Y. L. (2011). Agricultural decision support systems facilitating co-learning: A case study on environmental impacts of sugarcane production. International Journal of Agricultural Sustainability, 9(2), 322–333. https://doi.org/https://doi.org/10.1080/14735903.2011.582359
- Tittonell, P. (2013). Towards ecologically intensive smallholder farming systems: Design, scales and trade-offs evaluation. In B. Vanlauwe, P. v. Asten, & G. Blomme (Eds.), Agro-ecological intensification of agricultural systems in the African Highlands (pp. 132–144). London: Routledge.
- Trompette, P., & Vinck, D. (2009). Revisiting the notion of boundary object. Revue d’anthropologie des connaissances, 3(1), 3–25. https://doi.org/https://doi.org/10.3917/rac.006.0003
- Tschakert, P., Barnett, J., Ellis, N., Lawrence, C., Tuana, N., New, M., Elrick-Barr, C., Pandit, R., & Pannell, D. (2017). Climate change and loss, as if people mattered: Values, places, and experiences. Wiley Interdisciplinary Reviews: Climate Change, 8(5), e476. https://doi.org/https://doi.org/10.1002/wcc.476
- Tschakert, P., & Dietrich, K. (2010). Anticipatory learning for climate change adaptation and resilience. Ecology and Society, 15(2), 11. https://doi.org/https://doi.org/10.5751/ES-03335-150211
- Udo, H. M. J., Aklilu, H. A., Phong, L. T., Bosma, R. H., Budisatria, I. G. S., Patil, B. R., Samdup, T., & Bebe, B. O. (2011). Impact of intensification of different types of livestock production in smallholder crop-livestock systems. Livestock Science. Special Issue: Assessment for Sustainable Development of Animal Production Systems, 139, 22–29. https://doi.org/https://doi.org/10.1016/j.livsci.2011.03.020
- van Bruggen, A., Nikolic, I., & Kwakkel, J. (2019). Modeling with stakeholders for transformative change. Sustainability, 11(3), 825. https://doi.org/https://doi.org/10.3390/su11030825
- Vlek, P. L. G., Khamzina, A., Azadi, H., Bhaduri, A., Bharati, L., Braimoh, A., Martius, C., Sunderland, T., & Taheri, F. (2017). Trade-Offs in multi-purpose land use under land degradation. Sustainability, 9(12), 2196. https://doi.org/https://doi.org/10.3390/su9122196
- Wallis, P. J., Bosomworth, K., Harwood, A., & Leith, P. (2017). Charting the emergence of a ‘knowing system’ for climate change adaptation in Australian regional natural resource management. Geoforum; Journal of Physical, Human, and Regional Geosciences, 84, 42–50. https://doi.org/https://doi.org/10.1016/j.geoforum.2017.06.002
- Walters, R., Kenzie, E., Metzger, A., Baltutis, W. J., Chakrabarti, K., Hirsch, S., & Laursen, B. (2019). A systems thinking approach for eliciting mental models from visual boundary objects in hydropolitical contexts: A case study from the Pilcomayo River Basin. Ecology and Society, 24(2), https://doi.org/https://doi.org/10.5751/ES-10586-240209
- Wynants, M., Kelly, C., Mtei, K., Munishi, L., Patrick, A., Rabinovich, A., Nasseri, M., Gilvear, D., Roberts, N., Boeckx, P., Wilson, G., Blake, W. H., & Ndakidemi, P. (2019). Drivers of increased soil erosion in East Africa’s agro-pastoral systems: Changing interactions between the social, economic and natural domains. Regional Environmental Change, https://doi.org/https://doi.org/10.1007/s10113-019-01520-9
- Zeitlyn, D. (2010). Representation/self-representation: A tale of two portraits; or, portraits and social science representations. Visual Anthropology, 23(5), 398–426. https://doi.org/https://doi.org/10.1080/08949460903472978
Appendix: Boundary objects in the ResLeSS learning process
The learning process comprised four stages: a reconnaissance tour to become familiar with the area; a first multi-stakeholder participatory workshop that gathered parameters for the Transformation Game with the stakeholders; followed by setting up the computer model; and finally a second multi-stakeholder participatory workshop where stakeholders played the Transformation Game. Boundary objects were created and used at all stages (). The following sections describe the boundary objects, how they were created and used.
List of livestock ‘systems’ to be defined
A List of livestock ‘systems’ to be defined was the first boundary object, produced in a snowballing activity, a brainstorming that quickly gathered individuals’ ideas of how livestock was kept, most commonly, in the area, first in pairs, then agreeing a common set in bigger groups until all came together. The final agreed list was negotiated to four categories by the modeller, and these four categories were described in detail in the next activity of the workshop. The following tables show the evolution from the four agreed categories in the workshop to the livestock categories represented in the CLEANED-R models (Tables A1–A3).
Burkina Faso
Table A1. Linkage between Workshop 1 livestock categories to CLEANED-R categories in Burkina Faso.
The snowballing negotiation showed that there was no common vocabulary about the different livestock practices and systems. Some groups classified different practices depending on how far animals go from home, others by product line (meat or milk), and others along ethnic group divisions. Many of the participants did not contribute to the negotiation, so agreeing on some common groups became a lengthy and frustrating expert debate. The facilitator picked some of the often-repeated words and proposed that the groups work with three topics, rather than systems or practices:
Transhumance
Dairy production
Animal fattening
Because milk had raised so many debates, two groups were assigned to the topic of milk, to see how different the discussion in the two groups might be.
Based on the activities in the first workshop, the research team characterized the livestock production in Bama into five categories, seeking to provide a representation that all stakeholders can recognize and work with, rather than describing the full complexity of reality. As such, these five categories describe common ways of keeping cattle, acknowledging that farmers may keep cattle in several categories at once, for example, having some on transhumance, a few kept at home for dairy, one or two draft animals, and perhaps some for fattening. The categories draw on two different ways of classifying livestock: i) in terms of practices, according to the product (milk, meat or draft power); and ii) in terms of production systems that describe the nutrition and herd management of the livestock. Nutrition management ranges from an ‘extensive’ type of feedbasket that is almost entirely free grazing through a ‘semi-intensive’ type of feedbasket that contains concentrate feed with free grazing, but not a cross breed, to an ‘intensive’ type of management that refers to improved breeds with mainly concentrate feed and very limited free grazing. Note in particular the presence of both pastoralist and settled farming in the study area, and that the two are not mutually exclusive. For this reason, the categories focus on the animals as moving (pastoral/ transhumant) or not moving (draft, specialized dairy and specialized fattening) and do not specify who keeps them.
Ethiopia
Table A2. Linkage between Workshop 1 livestock categories to CLEANED-R categories in Ethiopia.
The first snowballing exercises in Workshop 1 came up with 9 categories. Within the workshop these nine categories where collapsed into four groups to be described in further detail (Table 2).
For Workshop 1, the study area was the whole of the Atsbi woreda, including the transition zone to the lowlands (lower than 2200 m). In order to limit the number of categories in CLEANED-R, the study area boundary was set to the plateau, which, based on the maps developed in Workshop 1, excludes the goats. The four groups from Workshop 1 were transformed into the five categories used in the CLEANED-R tool to fulfil the following requirements (Table 2):
Animals in a category should have consistent energy requirement - lactating animals have different requirement than fattening animals;
The categories should allow users to test out some of the wished interventions, which in Atsbi means
o Removing draft animals to test impact of mechanization
o Switching to improved cattle breeds
Tanzania
Table A3. Linkage between Workshop 1 livestock categories to CLEANED-R categories in Tanzania.
Based on the activities in the first workshop, the research team characterized the livestock production in Lushoto into three categories, extensive lowland, semi-intensive highland and intensive highland. Yet, discussion about future developments in the first ResLeSS workshop have pointed out that in all three systems smallholders are trying to improve the breeds and the management systems. These breeds would be pretty similar across all systems. The geography is not a key driver in the up-coming changes, it had only emerged in the first workshop because of the participatory mapping exercise. This is why the CLEANED-R Tanzania was parametrized with breeds, namely preliminary local breeds, cross breeds (with 65-85% exotic genes), almost pure breed (more than 85% exotic breed). This classification is in line with ILRI results.
Template
The agreed livestock categories were described using a pre-prepared Template, including number of animals in that category, what they are fed, in which proportions and where the feed comes from, housing and manure management and other services, both for the current situation and how they might change in the future.
Information required by the template:
Type of animal
Number of animals in the study area (or number of households keeping them in the study area and minimum, mode and maximum number of animals per household)
Feedbasket – items in the feedbasket, proportion of the feed basket, and where each feed item is sourced; and if there is significant variation in the feedbasket over the year, then do a wet season and dry season feedbasket
Manure management – what is the manure used for, and in what proportions
Equipment and infrastructure required or used for keeping animals in this category
Input and output markets
Transformation Game – game boards
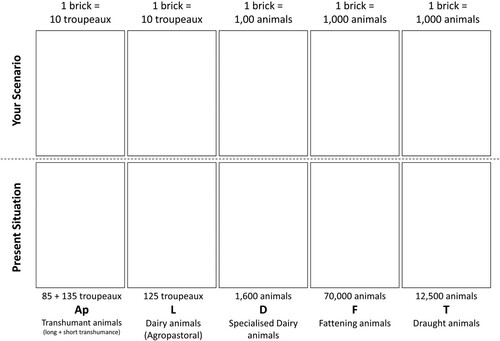
The Transformation Game (board game with bricks and vignettes + CLEANED-R tool) was built by the modeller based on the agreed livestock categories and the current and future descriptions of those categories, and verified by local livestock experts. The board game is a replica of the user interface for the CLEANED-R tool, to aid groups to build visually a scenario to enter into CLEANED-R.
The vignettes and numbers of animals initialize the Transformation Game on the game board. Important elements of the game board are:
- the name of each production category – translated into the appropriate language
- two rows of spaces to place vignettes – the starting situation (bottom row) and the scenario to be designed (top row) (see Tables A4–A6 describing the vignettes for each production category)
- a definition of what 1 brick represents – how many animals – leading to a corresponding number of bricks in the current scenario.
During the game, vignettes are laid in the squares (along the top row) and bricks piled on each vignette commensurate with the number of animals to be represented.
An example of the game board used in Burkina Faso is presented in .
Figure A1. Game board for selecting vignettes to build a scenario for Bama, Burkina Faso.
Transformation Game - vignettes
The Vignette cards used in the board game are pre-defined descriptions of viable profiles of management within one livestock category, i.e. a feedbasket to produce a particular volume of output and relevant manure management (Tables 4–6). The choice of vignettes was inspired by future system descriptions in Workshop 1 and local livestock literature, but designed by the modellers and local livestock experts. gives an example of one of the vignettes as a playing card to be used in the Transformation Game.
Figure A2. Example of a vignette card for the baseline dual purpose dairy category used in Ethiopia. The left panel has a short description (as in Tables 4–6) in the local language (Tigrigna in Atsbi). The right panel shows the parameters represented by this vignette.
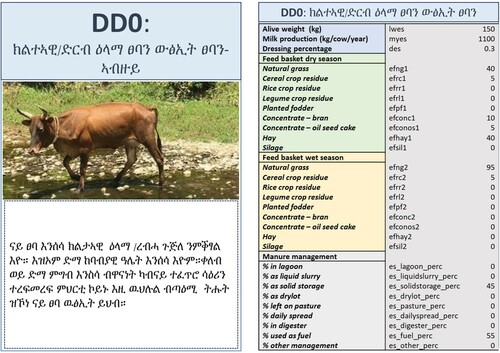
Table A4 . Vignettes for Burkina Faso and their descriptions. A total of 13 vignettes, including the current version of each production category (five vignettes) and one or two alternative futures for each category (eight vignettes).
Table A5. Vignettes for Ethiopia and their descriptions. A total of 13 vignettes, including the current version of each production category (5 vignettes), one alternative future for draft animals and specialized dairy (2 vignettes) and 2 alternative futures for all other categories (6 vignettes)
Table A6. Vignettes for Tanzania and their descriptions. A total of 11 vignettes, including the current version of each production category (three vignettes), two alternative futures for each category (six vignettes) and two vignettes representing options to increase available biomass by increasing crop yield and by invoking a land use change from grazing land to cropland.
Scenarios
A scenario is designed by selecting a vignette and a number of animals for each livestock category. All the scenarios produced during the workshops are listed in Tables A7-A9.
The base run is a simplified virtual landscape that tries to represent the reality on the ground as far as possible at the time of initializing the model for each country, i.e. by using the most accurate and realistic dataset possible for the user. But it is not possible (or necessary) to reproduce all the complexity of reality, and the base run remains a ‘virtual landscape’ with features that are inspired by the information obtained from literature, the reconnaissance tour, key informants and Workshop 1, which in turn (preferably) represent the features that are seen to be important and relevant by the stakeholders.
The group scenarios were created and evaluated by homogeneous stakeholder groups during Workshop 2 as their introduction to playing the Game.
Starting scenarios were provided to each mixed group in the final stage of Workshop 2, to avoid them spending time designing a first scenario. The intention was to focus on revising that starting point. The starting scenarios were created by the research team at the end of Day 1, as a combination of the 4 homogeneous group scenarios, either showing two clear trends (in Burkina Faso), or one average for both groups (in Tanzania) or three variations inspired by patterns across the groups as no clear trends emerged (in Ethiopia).
The mixed group scenarios are revisions of the starting scenario given to each mixed group, negotiated by the mixed groups during their final discussions.
Table A7. Design of homogeneous group scenarios, starting scenarios and mixed group scenarios in Burkina Faso, described by a vignette and number of animals for each livestock category. The agro-pastoral animals are counted in troupeaux (Troup., sub-herds) that go on long transhumance beyond the district (LT) or on short transhumance within the district boundary (ST). A Transhumance herd troupeaux was assumed to have 120 animals on average, while a dairy herd troupeaux was assumed to have 20 animals on average. Animals in the other livestock categories are counted in individual animals.
Table A8. Design of homogeneous group scenarios, starting scenarios and mixed group scenarios in Ethiopia, described by a vignette and number of animals for each livestock category.
Table A9. Design of homogeneous group scenarios, starting scenarios and mixed group scenarios in Tanzania, described by a vignette and number of animals for each livestock category.
Tool results
The tool results from the CLEANED-R tool give percentage change for a scenario compared to the current situation (baseline) for a variety of production (meat and milk yield, crop area used etc.) and environmental indicators (volume of water used for growing feed, greenhouse gases emitted, soil nitrogen balance and biodiversity). Tool results for Burkina Faso, Ethiopia and Tanzania are given in Tables A10–A12, for the indicators presented to stakeholders in respective workshops.
Note that these tool results should not be taken as accurate ‘truth’. Further refinements to the tool could still be made. These results give likely changes in magnitude and direction compared to the baseline, but the main purpose was to catalyse discussion.
Table A10. Percentage change in production and environmental indicator results, compared to the baseline, for homogeneous group scenarios, starting scenarios and mixed group scenarios in Burkina Faso. Units are the units in which the indicator is calculated, but numbers in the table are % change.
Table A11. Percentage change in production and environmental indicator results, compared to the baseline, for homogeneous group scenarios, starting scenarios and mixed group scenarios in Ethiopia. Units are the units in which the indicator is calculated, but numbers in the table are % change.
Table A12. Percentage change in production and environmental indicator results, compared to the baseline, for homogeneous group scenarios, starting scenarios and mixed group scenarios in Tanzania. Units are the units in which the indicator is calculated, but numbers in the table are % change.
List of socio-economic indicators of wellbeing
The list of socio-economic indicators of well-being was created by the participants, first in homogeneous groups, and then consolidated to a set of common socio-economic indicators that were agreed in plenary (). These are indicators representing what a successful life would look like in 2030, reflecting the socio-economic and wellbeing priorities of the participants.