
ABSTRACT
Introduction
Metabolomics has become a crucial part of systems biology; however, data analysis is still often undertaken in a reductionist way focusing on changes in individual metabolites. Whilst such approaches indeed provide relevant insights into the metabolic phenotype of an organism, the intricate nature of metabolic relationships may be better explored when considering the whole system.
Areas covered
This review highlights multiple network strategies that can be applied for metabolomics data analysis from different perspectives including: association networks based on quantitative information, mass spectra similarity networks to assist metabolite annotation and biochemical networks for systematic data interpretation. We also highlight some relevant insights into metabolic organization obtained through the exploration of such approaches.
Expert opinion
Network based analysis is an established method that allows the identification of non-intuitive metabolic relationships as well as the identification of unknown compounds in mass spectrometry. Additionally, the representation of data from metabolomics within the context of metabolic networks is intuitive and allows for the use of statistical analysis that can better summarize relevant metabolic changes from a systematic perspective.
KEYWORDS:
1. Introduction
The last few decades were marked by a steep increase in capacities to generate, store, share and process data. Such developments have driven a revolution in the ways we investigate complex systems such as social networks, cities, and organisms. In biology, this started with the earlier sequenced genomes at the turn of the century, closely followed by the boom of other ‘omics’ including trancriptomics, proteomics and metabolomics, consolidating the trends on moving from previous reductionist to holistic approaches in the investigation of biological systems. The structure of data generated by these approaches led to considerable changes in how we conceptualize and analyze these results, with particular attention driven toward the network structures arising from the integration of such rich datasets.
The concept of biological systems as networks is nothing new, in particular in relation to metabolism. In its most familiar representation, metabolism is pictured as a network of metabolites interconnected by enzymatic reactions catalyzing their interconversion, which define the flow of mass and energy through the system. Despite the familiarity of this representation of a metabolic network in the sense of metabolic pathways, networks are a much broader concept, useful for not only visualizing but also analyzing the global structure of any dataset that can be represented as nodes connected by a specific feature. Such data can be analyzed via several parameters in the field of graph theory and unravel mechanisms and structures beyond the direct interaction between neighboring nodes [Citation1–Citation3]. The combined analysis of several organisms including eukaryotes, bacteria and archea, for example, revealed a common feature of metabolism through its organization in a scale-free topology [Citation4,Citation5]. In these systems, most metabolites are involved in a low number of reactions whereas few metabolites, such as pyruvate, ATP/ADP, NAD(P)/NAD(P)H and coenzyme A, function as metabolic hubs participating in dozens of reactions and connecting multiple metabolic pathways [Citation4,Citation5]. However, there is considerable debate as to whether metabolism displays small-world topology or not, with strong arguments showing how these conclusion can arise from other common distributions due to analytical limitations or arbitrary choices in how to represent data [Citation6]. Indeed, recent examples have shown situations in which the small-world topology is not observed [Citation7,Citation8]. Therefore, a priori assumptions regarding network topologies, frequently incorporated into analysis pipelines should be carefully considered within the specificities of the investigated dataset. Despite the possibility that these different interpretations may lead to alternatives in our understanding of metabolic regulation, the fact is that network topology is an important feature of metabolic networks that can contribute to a phenotype interpretation.
The advent of metabolomics and its capacity for providing information on several dozen to hundreds of metabolites in a single experiment has given access to such higher levels of complexity. Subsequently, network analysis has become instrumental in exploring the full potential of these experiments. Among many popular approaches, metabolomics data have been used to produce correlation networks and to highlight the structural relationships between analytes in untargeted metabolomics and for pathway enrichment analysis of known metabolites. In this review, we will focus on those network strategies that are built exclusively upon analyzing data coming from metabolomics experiments to assist data visualization, explore metabolite–metabolite relationships and improve metabolite annotation. That said it is important to highlight that there are several other network strategies relying on mathematical modeling and simulations, such as those for the determination of metabolic fluxes including kinetic flux profiling [Citation9] and flux balance analysis [Citation10]. Such strategies for metabolic flux estimation are based on models built upon the underlying structures of metabolic network and may include metabolite levels and isotope enrichment data as means to quantify changes in fluxes or as constrains to reduce the solution space in some of these models [Citation11]. However, they will not be discussed here and the interested reader is referred to the recent extensive reviews regarding such approaches [Citation12–Citation14].
2. Metabolite correlation networks
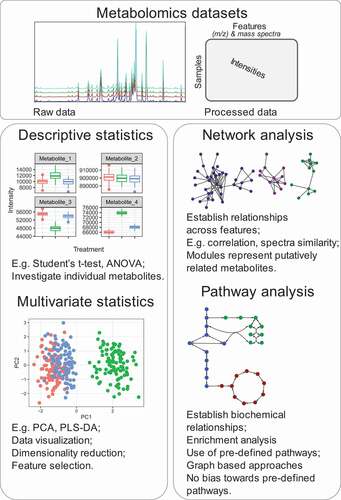
Most metabolomics experiments are designed to determine the relative quantification of dozens to hundreds of metabolites in relation to general internal standards [Citation15,Citation16], or less frequently the absolute quantification of a considerably reduced number of metabolites [Citation17]. Irrespective of the measurement type, common analyzes pipelines include direct application of descriptive statistics over individual metabolites comparing a treatment group against a control with common approaches such as Student’s t-test and ANOVA (). Multivariate analysis such as PCA is also frequently applied to highlight the most relevant metabolites responsible for differentiating between the groups of individuals under study. Such analyses are invaluable to access the differences between individual metabolites, which are very often instrumental in explaining the phenotypes, and understanding the effects of environmental and genetic perturbations. However, they still look at discrete parts of the whole system, and often miss important information comprised within the complex metabolomics datasets. A great example of this limitation is the many experiments where the use of correlation networks rather than metabolite levels could unravel links between distant nodes (metabolites) representing complex interactions between different pathways and physiological functions. The correlation matrixes of S. tuberosum, for instance, show marked differences for leaves and tubers, that can partially be explained by the different roles of these organs as source and sink, respectively [Citation18]. Even more remarkably, the differential analysis of network connectivity of a potato line exhibiting an apparently silent suppression of sucrose synthase isoform II expression reveled metabolic alterations in carbohydrate and amino acid metabolism that were not captured by differential analysis of the levels of the metabolites [Citation19].
Figure 1. Graphical summary comparing different mass spectrometry based metabolomics data analysis strategies.
It is evident from several other studies that correlation analysis is a powerful strategy to identify systemic metabolic changes which are often undetectable when relying solely on metabolite levels [Citation19,Citation20]. However, for proper interpretation, it is also essential to understand the particular mechanisms that may underlie these correlations in the specific case of metabolic networks [Citation21]. Correlation analysis finds widespread application in different fields of biology, with many of the strategies used for generating metabolic correlation networks originally developed for other sources of data. Transcriptomic data analysis, in particular, frequently uses correlation (co-expression) networks to draw conclusions, and the concept of guilt-by-association is widely accepted as a means to identify transcripts putatively associated with related processes [Citation22,Citation23]. Metabolic networks differ in the sense that its components are intermediates in a chain of processes depending on one another for their synthesis. Several well-known examples of cyclic pathways such as the TCA cycle and the Calvin-Benson cycle highlight the complex level of interdependency across metabolites. Moreover, metabolism is highly flexible exhibiting faster responses, at the milliseconds to seconds, which can be several orders of magnitude faster than typical transcriptional and translational responses [Citation18,Citation24]. That said, correlations in cellular metabolism may arise from multiple distinct factors including chemical equilibrium, mass conservation, asymmetric control distribution, and unusually high variance in the expression of single genes [Citation25].
2.1. Establishing metabolites correlations
The most frequently used methods for establishing metabolites correlations are based on Pearson’s correlation coefficient (or Spearman). Whilst easy to calculate, such networks capture both direct and indirect connections between metabolites. Considering the overwhelming complexity of metabolic networks, excluding such indirect connections can considerably facilitate data interpretation. The use of Gaussian graphical modeling to produce partial correlation networks has attracted growing attention in systems biology due to its capacity of differentiating the indirect associations and generating sparse networks better representing causal relationships [Citation26–Citation28]. This can be achieved by conditioning each pairwise correlation to all other variables. Therefore, the partial correlation between X and Y corresponds to the Pearson correlation between the residuals from regressing each X and Y to the remaining variables [Citation29]. In contrast to observations using direct pairwise correlation networks [Citation30], initial works applying such approach to metabolomics datasets have shown very promising results in a large human population cohort, with the high partial correlations of 151 metabolites in blood samples generally tracing back to known biochemical reactions [Citation26]. A major challenge for the application of partial correlations on the development of biological networks from omics datasets in general, is the need for at least as many observations as variables, condition rarely satisfied for such experiments [Citation28]. Common approaches to work around this limitation include the use of lower-order partial correlations, where the correlations are conditioned to a smaller subset of the remaining variables [Citation27], as well as regularization approaches such as the graphical lasso [Citation31].
An alternative approach for identifying an association between metabolites that is worth noting is mutual information (MI). MI is an association measure borrowed from information theory, routinely used across other functional genomics platforms, and often considered convenient for capturing non-linear relationships in contrast with traditional linear correlations [Citation32]. However, a few studies suggest that MI-based approaches may underperform in comparison with correlation-based approaches [Citation32,Citation33]. Indeed, the work by Suarez-Diez and Saccenti [Citation33] provides an interesting assessment of multiple methods for generating metabolite association networks as well as the effect of sample sizes and dimensionality. Their results suggesting that correlation-based methods perform better than mutual information. Moreover, Song, Langfelder [Citation32] in the same line suggest that even for the case of detecting non-linear associations, arguably one of the most attractive advantages of MI, there are computationally simpler regression-based alternatives such as spline and polynomial regression that could be considered.
2.2. Tools and strategies for metabolite correlation analysis
Despite the particularities of metabolism in relation to other biological networks, mathematical procedures for the generation and differential analysis are interchangeable with those developed elsewhere. In fact, most tools for the investigation of biological correlation networks were originally developed and indeed are more frequently used with transcriptomics data (see for a summary of all tools presented in this review) [Citation34,Citation35]. Several tools originally developed for transcriptomics have been later used or considered the inclusion of metabolomics data [Citation34–Citation36]. In summary, most methods are based on generating pairwise correlations for the whole dataset followed by some statistical comparison between different conditions.
Table 1. Useful resources for network analysis of metabolomics data
Large correlation networks including all samples of an experiment may still prove useful for data interpretation, particularly when the overall difference between groups is not too extreme [Citation37–Citation39]. However, in most cases, there is a greater interest in the differential correlation across distinct conditions. Therefore, correlation analysis on replicates may be more suitable than combining different conditions [Citation25]. It is important to highlight that sample size should be larger than many common metabolomics experiments in which this is often limited to numbers between three to six biological replicates. For the generation of correlation networks, it is often recommended a minimum of 10 biological replicates [Citation25]; however, it is important to highlight that this has to be evaluated in a case by case basis and this recommendation may be an underestimation.
Several examples of differential correlation network analysis applied to metabolomics describe alternative methodologies for performing such analysis [Citation35,Citation36,Citation40,Citation41]. One of the most simple and flexible approaches that can be easily integrated with other analysis pipelines is via functions from the R programing language. Built in functions such as corr or those from packages like hmisc or psych, can be used to calculate correlation matrixes and perform basic statistical tests from which data can be filtered based on any preferred cutoffs [Citation42]. Furthermore, tools such as Cytoscape can assist data visualization, while providing several other functionalities for network structure analysis [Citation43]. In a recent work by Batushansky, Matsuzaki [Citation7] the authors provide a concise example of differential correlation network analysis following this methodology, including a descriptive analysis of some of the main network topological features. This work highlights specific changes in BCAA metabolism in response to fasting that were not captured by individual metabolite comparison suggesting a possible disruption of BCAA metabolism from glycolysis [Citation7]. Network topology analysis can further efficiently extract information from larger networks. A good example is the use of clustering algorithms to identify modules of correlated metabolites, followed by pathway enrichment within differential modules across experimental groups [Citation44]. Still considering the R environment, there are a few packages focused on correlation network analysis that have been used for metabolomics and provide more sophisticated approaches, amongst some of the most popular are DiffCorr [Citation36] and weighted correlation network analysis (WGCNA) [Citation45]. DiffCorr was developed exclusively to analyze differential correlation in biological networks. It is based on the identification of the first principal component-based ‘eigen-molecules’ in the correlation networks, which corresponds to the representative correlation pattern of a module composed of highly correlated metabolites, followed by testing differential correlation between two groups based on Fisher’s z-test [Citation36]. DiffCorr can be applied to trancriptomics data but it has also been shown to work on metabolomics datasets. Its methodology was recently incorporated into metaX [Citation46], a metabolomics data processing software providing a graphical user interface that may be useful for those not familiar with command line tools. WGCNA is a very well-established approach in transcriptomics data analysis. Its implementation includes the identification of co-expression modules and integration of other phenotypic data, while still allowing for the differential comparison between networks. Despite its initial focus on microarray data, a few more recent studies have shown the application of this strategy also for the analysis of metabolomics data alone [Citation34].
Debiased Sparse Partial Correlation algorithm (DSPC) is a regularized approach that has been developed for handling high dimensional mass-spectrometry based metabolomics data [Citation28]. It is built upon a de-sparsified graphical lasso modeling procedure with the assumption that the number of true connections among the metabolites is much smaller than the available sample size, making it particularly relevant for such large-scale metabolomics datasets. Moreover, the procedure has been conveniently integrated into the Java application CorrelationCalculator and can be easily exported to the MetScape app in Cytoscape for visualization. A recent example using DSPC for differential network enrichment analysis has shown promising results, demonstrating alterations in triacylglycerols and cardiolipins-phosphatidylethanolamines that precede the clinical outcome of end-stage kidney disease by several years [Citation47].
One crucial step that must not be overlooked in the generation of correlation networks is the establishment of a correlation cutoff threshold. Most network analysis data interpretation relies upon the establishment of a somehow arbitrary threshold to select meaningful correlations. Early works investigating topological features of metabolite correlation networks have suggested that the number of connected components transitions from small to large at an absolute correlation of approximately 0.5 [Citation44], whilst biological meaning has been associated to moderate correlations in the order of 0.6 < |r| < 0.8 [Citation25]. Very few works have focused on trying to develop alternatives to avoid such arbitrary threshold selection. An interesting approach trying to tackle this subject has been developed using once again a modification over an algorithm originally developed to infer transcriptional regulatory networks from gene expression [Citation35,Citation48]. The so-called Probabilistic Context Likelihood of Relatedness (PCLR) uses a resampling strategy for inference of the correlations. In each of the k iterations, 70% of the samples are randomly selected for calculating the correlations. Then, context likelihood of relatedness is used to estimate possible associations with the threshold automatically selected to keep the highest 30% of interactions [Citation41,Citation49,Citation50]. The result is a weighted network where edges represent a probabilistic measure of edge likeness. This is an interesting way of assessing the significance of associations in relation to the local background of each pair of metabolites instead of using the pair correlation value.
3. Molecular networking strategies for metabolite annotation
Metabolite annotation is one of the main bottlenecks for most untargeted metabolomics pipelines. The structure of nucleic acids and proteins, composed of discrete unities of a limited number of building blocks, namely nucleotides and amino acids, significantly facilitate the identification of such structures. Metabolites, on the other hand, occupy a much broader space of possible structures and therefore, metabolite identification is often a bewildering task even for an experienced analyst [Citation51]. Much of the knowledge regarding metabolite identification has been painstakingly accumulated over the years through complex procedures involving their isolation followed by further spectroscopic characterization and/or the synthesis of proposed structures. These strategies are powerful but even assuming access to cutting edge technologies such as LC-SPE-NMR systems, it still represents a time consuming and labor-intensive endeavor, limiting its scaling to the throughput necessary for most current metabolomics experiments. For these reasons, chromatographic separation coupled to mass spectrometry has become the preferred technique for metabolomics, providing the best compromise between metabolome coverage, structural information and throughput [Citation51]. Despite its limitations for de novo characterization, mass spectra and retention times still provide rich structural information, particularly useful for the identification of known compounds and assignment of putative metabolite classes and/or structures. Additionally, increasing accessibility to systems incorporating ion mobility spectrometry provides an additional dimension based on drift times that can be converted into collisional cross-sections [Citation52,Citation53]. This is a valuable complementary feature to conventional chromatography/mass spectrometry, however it will not be discussed in detail here since its integration within metabolomics data analysis pipelines is still in its infancy.
Considering all the interesting features of mass spectrometry as a metabolomics platform, extensive efforts have been directed toward improving its limitations for metabolite annotation. Molecular networking is a strategy that has shown outstanding potential to increase by several orders the number of signals assigned to a putative chemical structure in mass spectrometry-based metabolomics [Citation54]. Molecular networking relies on the assumption that related structures yield similar fragmentation patterns to generate a network of spectra similarity. The strategy is conceptually simple and current tools make it easy to implement and interpret with different datasets. Modules within these networks represent putatively related metabolites that can be identified by the association with other known metabolites. The concept was originally developed for the screening of secondary metabolites produced by microbial colonies [Citation55]. Following this initial application, it quickly became an integral part of most metabolomics workflows focused on metabolite annotation being successfully applied for the characterization of multiple microorganisms [Citation56,Citation57], plants [Citation56,Citation58] and human samples [Citation59,Citation60]. This initial approach is built upon a modification of the MS-Cluster algorithm [Citation61] originally developed for proteomics, which is used to simplify the original data by building consensus spectra. Pairs of spectra converted into unit vectors in n-dimensional space are compared by dot product calculation, representing the cosine angle between the two vectors, to generate a vector of spectra similarities where 1 represents an identical spectra [Citation62]. A cut off is then established (usually between 0.5 and 0.7) above which edges are set between the pair of consensus spectra.
The assignment of modules including analytes of similar mass spectra by itself already represents an interesting information for data interpretation; however, the real power of molecular networking for metabolite annotation is still ultimately dependent on spectra matching to previously known MS2 spectra in order to act as a ‘seed spectra’ for the propagation of putative identities based on the network. The ‘Global Natural Products Social Molecular Networking’ (GNPS) [Citation63], represents a great community effort into providing an open-source platform for sharing mass spectral data and data analysis based on molecular networking, and had an instrumental role on the popularization of this approach. Following the popularization of this platform, significant efforts have also been directed toward its integration to popular data processing tools including MS-DIAL [Citation64], mzMine2 [Citation65], OpenMS [Citation66] and XCMS [Citation67], by incorporating into these tools functionalities for exporting data into GNPS. Since the end of 2019, GNPS also incorporates ‘Feature-based Molecular Networking’ (FBMN) [Citation68]. This new feature integrates molecular networking through the GNPS platform directly with the aforementioned processing tools. Besides facilitating the analysis pipeline, it also allows for the incorporation of MS1 information such as natural isotopic pattern, retention time and ion mobility, significantly improving over the original approach relying exclusively upon MS2 information. Despite the increase in computational demand, the new approach has already proven useful to distinguish structural isomers that could not be resolved by the original algorithm.
Following the initial spectra matching and molecular networking performed by GNPS, the resulting networks provide identities of metabolites matched to the library and the association with similar spectra. Further metabolite annotation relies upon manual investigation of each MS/MS spectra and its connecting nodes individually. More recent efforts have focused on automating this part of the process by propagating the annotations using in silico fragmentation [Citation69]. This Network Annotation Propagation (NAP) tool is also accessible through the GNPS web-platform and it works by using the in silico prediction tool MetFrag [Citation70] in combination to a re-ranking strategy based on the resulting candidate structures using the MetFusion [Citation71] score and network topology. Additionally, GNPS platform also has included the MS2LDA strategy for identification of shared structures in unknown compounds based on spectra fragmentation [Citation72]. MS2LDA is a complementary approach to spectra similarity that uses text mining tools to extract common patterns of mass fragments and neutral losses from collections of fragmentation spectra. This tool can significantly enhance annotation by revealing the shared structural moieties across connected nodes in the molecular network.
Another interesting tool recently incorporated was the algorithmic learning for auto-deconvolution of GC-MS data to enable molecular networking within GNPS [Citation73]. The initial molecular networking strategies were developed with a focus on LC-MS2 data, which is considerably different from traditional GC-EI-MS data. In the former information regarding precursor ion, usually a molecular ion is linked to the MS2 spectra. In the latter, only the highly fragmented MS1 originating from the EI is available, which rarely includes the molecular ion. As an essential step for GC-MS data processing, the multiple signals from these highly fragmented spectra have to be deconvoluted into individual analyte mass spectra. Despite this seemingly disadvantage, GC-EI-MS exhibits considerably higher reproducibility within ionization and a higher resolution within the chromatography in comparison with any LC-MS technique currently available. For those reasons, GC-EI-MS is a much more well-established technique in metabolomics, with considerably more data publically available. Until recently, most GC-EI-MS data processing was performed by the myriad of software available incorporating local libraries, many of which freely available online, for spectra and retention index matching for the identification of compounds [Citation74]. The new functionality introduced in GNPS uses a machine-learning algorithm based on unsupervised non-negative matrix factorization to automatically select parameters for the deconvolution of GC-EI-MS data returning a ‘balance score’ that can be used to access how consistent the spectra is across the dataset. The strategy adopted makes data processing computationally efficient and more accessible to less experienced users, while also offering the direct integration with molecular networking available through GNPS [Citation73].
An alternative strategy that can be seen as complementary to molecular networking based on spectra similarity, is the use of mass shifts between fragments from different spectra, matching against the differences expected from relevant biochemical reactions. Identifying relevant mass shifts is an efficient way of interpreting small modifications over a common structure often observed across multiple classes of metabolites. This approach has been successfully applied in several instances such as the characterization of plant secondary metabolism in multiple plant species [Citation75,Citation76] as well as the metabolome of coral reefs [Citation77]. Indeed, Hartmann, Petras [Citation77] integrated molecular networking based on spectra similarity to the mass shift approach, which not only facilitated the interpretation of the metabolic changes within network modules, but also highlighted interesting modification specificities across different coral reef types of holobionts. Calculating a matrix of mass shifts and matching it against a reference list of biologically relevant shifts is relatively simple to implement. However, there are a few tools available that are also simple to use and integrate in the preferred pipeline while providing some extra functionalities. An interesting example is MetNet [Citation78], an R package available through Bioconductor. It can be easily integrated with the XCMS/CAMERA [Citation67,Citation79] pipeline commonly used for data processing within this platform. MetNet creates an adjacency matrix based on the structural information by matching absolute mass differences to a user-defined list of biologically relevant differences. Additionally, it can also generate a consensus adjacency matrix by combining multiple statistical models that can be combined with the structural information.
Most mass spectrometry metabolomics experiments rely on the hyphenation with chromatographic techniques to reduce matrix effects and obtain additional information in the form of retention times. However, even the best-hyphenated systems based on GC-EI-MS, orbitrap and qTOF technologies need to compromise mass accuracy, ultimately essential for molecular formula determination, in detriment of the higher scan rates necessary to cope with the chromatographic separation. Forcisi et al. [Citation80] developed an interesting strategy based on mass difference networks to combine datasets from highly accurate direct infusion electrospray ionization Fourier transform ion cyclotron resonance/mass spectrometry (DI-ESI-FTICR-MS) data and UHPLC-MS, taking advantage of both. Despite being much less popular than LC-MS, the resolution provided by FTICR/MS and the simplicity of DI-ESI analysis provide a significant contribution to the identification of unknown compounds within other more common approaches previously described.
4. Integrating metabolomics data into metabolic pathways
The organization of metabolites into metabolic pathways is perhaps the most intuitive representation of metabolism. Such networks try to capture and map the direct relationship between known substrates and products of individual reactions in metabolism providing a blueprint for the categorization of certain metabolites into specific pathways. The mapping of metabolomics data into such metabolic maps can provide valuable insights into the shifts in metabolic fluxes upon specific perturbations.
4.1. Enrichment analysis
There are several strategies to integrate metabolomics data in such context and extract useful information, most of them based on mapping metabolites to pre-defined metabolic models followed by investigating it through enrichment analysis. As for correlation networks, much of such pathway enrichment analysis has been originally developed through modifications over commonly used transcriptomic tools. Two common approaches include metabolite set enrichment analysis (MSEA) and over representation analysis (ORA). In short, MSEA uses quantitative data to analyze the changes in pre-defined groups of functionally related metabolites across conditions, rather than relying on individual metabolites [Citation81–Citation83]. ORA on the other hand looks at the enrichment of a set of metabolites selected based on any chosen criteria against a list of metabolites, ideally representing the metabolic space evaluated within the experiment [Citation84].
The most basic approach for pathway analysis is simply mapping identified metabolites into some pre-defined pathway, usually obtained from reference metabolic pathway databases such as KEGG [Citation85] or MetaCyc [Citation86]. This approach presents the obvious limitation of requiring previous data processing; however, the analysis and interpretation are straightforward once all input metabolites are known. An infinity of tools extensively described in recent reviews are available for performing such analysis including different data input and statistical tests used for the comparison [Citation41,Citation84,Citation87,Citation88]. Some of these tools providing interesting functionalities to map metabolites to pre-defined metabolic models include PAPi [Citation89], MetaboAnalyst [Citation90], MetExplore [Citation91], MetScape [Citation28] and PathVisio [Citation92].
4.2. Challenges for conventional pathway analysis
It is important to highlight here some fundamental limitations of pathway analysis arising both from technical and conceptual challenges faced when investigating metabolism. We will follow this discussion with some interesting strategies that try to circumvent these challenges. A first clear drawback arises from our incomplete coverage of the metabolome and the interactions between metabolites represented in pathway databases and metabolic models [Citation93]. As it has already been discussed here, the vast majority of signals detected by current metabolomics platforms remain unidentified. Moreover, it is evident that there is still a large gap of knowledge regarding all the intricate connections within the metabolic networks of any organism [Citation8]. As a consequence, much of the information contained in metabolomics datasets is simply not integrated by such approaches relying on predefined pathways. Another very important limitation arises from the definition of metabolic pathways itself. Metabolic pathways represent sub-networks from the complete metabolic network. Despite efforts in trying to formalize the definitions of metabolic pathways [Citation94], these are somehow subjective and can still significantly vary across multiple databases [Citation3,Citation95]. Additionally, several metabolites are present in multiple pathways complicating even further the interpretation of results based on pre-defined pathways.
4.3 Identifying metabolic sub-networks based on metabolomics data
An interesting but complex alternative to circumvent the bias introduced by using pre-defined pathways is representing the complete metabolic network containing all known and predicted reactions for a target organism as a graph and directly extracting the sub-networks based on the available data [Citation3,Citation8]. This strategy helps capturing possible variants and combinations of the reference pathways as well as to detect novel pathways. Metabolic graphs are usually represented by compound graphs where all pairs of metabolites belonging to a reaction are connected by a single edge. This is less intuitive than its representation by hypergraphs or bipartite graphs since a single reaction may be represented by several edges [Citation96]. However, by having nodes only representing metabolites it facilitates further computational steps necessary to extract the sub-networks. The approaches for such unbiased sub-network extraction are far from trivial and many new challenges arise. Once metabolites of interest are mapped into the large metabolic networks there is an infinity of possible pathways to connect these nodes. A multitude of strategies has been developed with the goal of reducing the search space and extracting only the most likely biologically meaningful sub-networks. These strategies have been recently covered in detail [Citation3]; therefore, we will just briefly discuss some of the main relevant concepts.
The most basic approach is to simply search for the shortest paths between two nodes [Citation97]. Whilst simple, shortest path search is severely limited by the frequent presence of side compounds such as energy carriers and proton donors leading to the detection of many irrelevant pathways [Citation98]. A great deal of effort in this field concentrates toward finding alternative ways of dealing with this issue. Removing such compounds may help to mitigate the issue and there are procedures to identify them based on network topology, however they introduce other drawbacks. Common assumptions to define side compounds such as the use of node degree in the network may also apply to other highly connected relevant metabolites such as pyruvate and acetyl-CoA [Citation4]. Additionally, certain metabolites such as ATP that are often a side compound can act as a substrate/product in other specific pathways. Alternatively, it is possible to use the topological features to weight the nodes or edges and search for the ‘lightest pathway,’ hence avoiding the exclusion of side compounds [Citation99].
Some more promising strategies that do not rely solely on network topology involve introducing extra biochemical information into the network based on the chemical structures of metabolites. Mapping atom transitions between metabolites, for instance, allows for selecting only those pathways in which transfer of carbons between pairs of nodes occur [Citation100,Citation101]. Tracking structural changes based on structural similarity metrics such as the Tanimoto coefficient, can also be used for minimizing structural differences across each step of the pathway [Citation102,Citation103]. Both strategies have proven to be more efficient than relying exclusively on network topology for identifying biologically meaningful pathways and dealing with side compounds, besides providing relevant information for further data interpretation. Several recent tools allow for the incorporation of atom mapping and molecular similarity into network analysis such as Reaction Decoder Tool [Citation104], SimIndex, and SimZyme [Citation102] just to mention a few.
Finally, all these strategies concern finding optimal paths between two nodes. Their application to real metabolomics datasets composed of dozens to hundreds of metabolites would involve calculating every possible pairwise paths and merging the results. However, there are several common situations such as branching points that may lead to the optimal paths between individual pairs differing from that considering all combined metabolites [Citation3]. Once again, several alternatives have been suggested including uses of centrality measures, Steiner Tree computation [Citation105] and metabolic stories [Citation106]. In summary, when compared to other network approaches for metabolomics data analysis previously discussed, we observe a much greater variety of alternatives based on very different strategies for the graph-based extraction of pathways from metabolic networks. This kind of analysis is much less widespread than pathway-based enrichment analysis, mostly due to its complexity, lack of well-established protocols easily implemented by non-experts, and computational burden. Most of these alternatives are built around specific assumptions that handle better or worse some of the different drawbacks intrinsic to the process, often finding complementary application. Next, we will briefly discuss a couple of applications, that whilst being far from comprehensive may provide the reader with an overview of the possible outcomes of such analysis applied to real metabolomics datasets. MetaboRank implements a centrality-based approach constructed around Google’s PageRank algorithm in the freely accessible web server MetExplore [Citation91,Citation103]. The output of MetaboRank returns a ranked list of metabolites suggested to be relevant to any particular pre-defined subnetwork, in a similar way to how social media platform suggests new friends based on one’s current social network. As an example, the authors validate their methodology by incorporating new biologically relevant metabolites into a metabolic fingerprint developed to identify patients with hepatic encephalopathy (HE) disease [Citation107]. An interesting feature of MetaboRank implementation is that it allows for the incorporation of structural information about the substrate–product transitions such as chemical similarities and atom transitions, as well as data from transcriptomics and proteomics. Metabolomic Modularity Analysis (MMA) is an approach that uses a community detection algorithm that identifies modules of reactions based on the relationships between selected metabolites [Citation108]. The input metabolic network for MMA uses a less usual reaction-centric network where metabolites are represented by the edges instead of the nodes of the network. This different perspective is particularly interesting to observe the role of high-degree metabolites that in this arrangement are not restrictively assigned to one pathway. Another interesting feature is its hierarchical output which allows for the ready interpretation of the relationships between modules based on its structure.
4.4 Integration of annotation strategies and pathway mapping
A common limitation of both pathway enrichment analysis and sub-network identification approaches is that they are unable to handle metabolites absent from the metabolic models. As such, much of the new interesting developments in pathway analysis have tried to integrate additional information, particularly those based on metabolite annotation and association network strategies previously discussed here. Network-based annotation of metabolites fits particularly well to this goal, potentially providing tools to expand our current knowledge regarding pathway interactions based on the untargeted integration of metabolites into known pathways. Some of the most interesting pathway-related tools for untargeted metabolomics have incorporated the principle of going from untargeted mass spectrometry features directly to pathways [Citation87]. The approach implemented by the computational algorithm Mummichog was one of the first to explore the modular structure of metabolic networks to validate annotations obtained through spectra matching [Citation109]. Mummichog adopts the assumption that correct matches could be identified through the enrichment of specific classes of metabolites within each module. PIUMet works on a similar assumption with an algorithm that facilitates further integration of multi-omics data [Citation110]. The BioCAn [Citation111] workflow incorporates metabolite annotation steps using five different annotation tools: Metfrag [Citation70], CFM-ID [Citation112], NIST17, Metlin [Citation113], and HMDB [Citation114]. Moreover, it is flexible with regard to the metabolic model used for matching identified metabolites. By default, it assembles a metabolic model using enzymes and gene orthology from KEGG based on the organism of interest. However, other published or manually curated models can also be used. In a similar way, metabolic reaction network-based recursive algorithm (MetDNA) [Citation115] initially builds a metabolic reaction network based on known pairs of substrate and products, which is further used to match seed spectra prior to recursive propagation of the annotations.
The aforementioned tools provide interesting strategies for expanding our knowledge on the direct interactions within known pathways and some newly identified compounds. However, they still depend upon seed metabolites being present within the metabolic model used as a reference for the propagation of annotations. Consequently, these strategies work well for primary metabolites included within pathway databases such as KEGG. Nevertheless, its applications for the integration of new metabolic pathways that are not highly integrated in such global metabolic models is limited. This is often the case of specialized metabolites in plants and microorganisms, which are highly specific and often not well represented in pathway databases. Therefore, another important step forward in pathway analysis is the capacity of deducing new metabolic interactions to expand pathways beyond what is currently available. A limitation of previously mentioned enrichment analysis, is the need of identifiers to group metabolites, which limits its application to extended networks including new metabolites. BiNChE is a useful webtool for enrichment analysis that uses ChEBI ontology to link ontology classes to biological entities, considerably expanding the chemical space covered in relation to traditional pathway databases [Citation116]. In a similar line, the ClassyFire tool converts traditional molecular descriptors such as SMILES or InchiKeys into hierarchical chemical ontology terms [Citation117]. In fact, the incorporation of such classification into annotation pipelines such as those used for molecular networking can already bring the results much closer to the topological structures of metabolic pathways, allowing its direct integration with enrichment analysis strategies. A recent pipeline, MolNetEnhancer, has been developed exactly with this goal, combining GNPS molecular networking tools to ClassyFire in a single pipeline [Citation118]. Another interesting approach on this direction include ChemRich which uses MeSH annotations and Tanimoto indexes to define modules of related molecules independently from pathways, followed by enrichment test using Kolmogorov–Smirnov (KS) test [Citation93].
5. Conclusion
Metabolomics data represents complex interaction networks rather than a collective of individual components. Therefore, trying to conceptualize data analysis from a network perspective has the potential to reveal meaningful information not captured through differential analysis of individual metabolites. Indeed, recent efforts in developing network approaches for the analysis of metabolomics data from different perspectives, including quantitative association networks, as well as structural and biochemical relationships, has shown promising results in expanding our knowledge of how these metabolites are intricately related. Finally, all individual strategies currently used for metabolomics data analysis suffer from some limitations. These arise from multiple factors including technical limitations of instrumental setups, incomplete coverage of the metabolome within both compound and pathway databases, and the complexity in defining metabolites relationships itself, amongst many other. The integration of multiple different approaches has shown great complementarity, and currently represent the best alternative for minimizing these individual limitations and achieving a better understanding of these complex datasets.
6. Expert opinion
The final goal of metabolomics is to describe an organism’s metabolism at a global level. It is evident, however, that the results of such experiments are frequently evaluated using reductionist approaches where the analyst focus on selecting and identifying individual components associated with specific conditions. We demonstrated here, that while still a valid approach, this is often unable to capture changes that a more global view could detect. This has been observed since the earliest experiments using correlation networks in metabolomics, and since them, we achieved significant progresses in our understanding of how metabolic networks are organized. Still such global analysis of metabolomics data is usually restricted to the simplest assumptions such as that related metabolites should exhibit linear relationships, which is often not the case. The use of more sophisticated methods for data analysis capable of capturing non-linear relationships between the different components of these networks, may reveal interesting and unexpected features of these systems [Citation119]. In addition, most current strategies are focus only on establishing pairwise associations between metabolites. Whilst developments such as the use of partial correlation to try capturing causal relationships are a great step forward, there is still space for exploration on strategies to infer directionality within these networks. Some works have suggested the adoption of complex time series and multi-condition experiments to increase the information content within the experiment and assign this directionality, but so far few studies have obtained promising insights from these approaches applied to typical metabolomics datasets [Citation120,Citation121].
One of the major hindrances limiting the interpretation of mass spectrometry-based metabolomics experiments is the limited fraction of signals assigned to a known metabolite [Citation122]. Whilst unambiguous identification still largely depends on the laborious characterization of purified compounds the development of unified platforms for depositing mass spectral information are an essential part of the efforts to fulfill this gap. As the size of public spectral libraries, and the number of annotated spectra increase, network strategies such as those described here will increase even further their potential for rapid dereplication of known metabolites and facilitate the rapid characterization of unknowns. Moreover, the recent success of molecular networking strategies has fired an exciting search for new methods of establishing structural relationships between mass spectra features. The recent development of MS2LDA [Citation72] is a great example of how alternative metrics can be complementary to the already well-established spectra similarity, and the popularization of machine learning algorithms is providing some promising results in this area [Citation123,Citation124].
Facilitating the integration of multiple complementary approaches into single platforms or the integration across different platforms is a strong tendency in metabolomics, which should facilitate the exploration and interpretation of data from different perspectives. Molecular networking, for instance, has been proven to be of great utility for metabolite annotation; however, little has been done in terms of analyzing the structure of the resulting metabolic networks. Moreover, the incorporation of extra layers of information within these networks have the potential to reveal unanticipated features, as it has been observed with the specificity of certain classes of compounds detectable by GC-MS in regard to frogs, cheese, and beer samples [Citation73], revealed simply by the integration of multiple datasets and addition of metadata. The incorporation of FBMN into GNPS represents a great step forward in this sense, adding a layer of quantitative information in the networks. The incorporation of ion mobility information is also of great interest. This technique is still not often integrated within well-established metabolomics platforms, but it is quickly growing in popularity due to its complementarity to traditional LC-MS systems [Citation125]. It will be exciting to follow developments as to how the addition of collisional cross-section (CCS) information into these databases and networks may contribute to the annotation of metabolite structures and what it may reveal from network structures.
Finally, visualization of metabolomics data within the context of known biochemical pathways provides a great and intuitive representation for data analysis. The organization of data in this way allows for the use of enrichment analysis that can be of great assistance in summarizing these typically extensive datasets into biologically relevant information. However, one of the great limitations of such approaches is its limitation toward known metabolites and pathways. It is exciting to see several recent attempts into incorporating metabolite annotation and pathway prediction tools in an attempt to extend the current knowledge from untargeted metabolomics data. Indeed, we can observe a tendency of merging several of the different approaches discussed here with the final goal of assembling putative metabolic networks incorporating biochemical relationships directly from untargeted metabolomics data. A great example is the recent released MolNetEnhancer, which combines molecular networking, annotation propagation, chemical class classification, and enrichment analysis in a single pipeline [Citation118]
Article highlights
The shear amount of metabolites measured by metabolomics platforms carries information beyond single metabolite levels that can be accessed with the use of network analysis.
Different information extracted from metabolomics can be visualized as networks.
Correlation networks can reveal co-regulated metabolites that are not directly related as substrate/precursors in the same pathway.
Correlation networks can detect differences across samples that may not be detected by statistical tests on individual metabolite levels.
Mass spectral similarity networks have been shown to considerably extend the proportion of signals assigned to putative metabolites in untargeted metabolomics.
Molecular ion mass differences and to a lesser extent retention times can be used to establish putative substrate/product relationships including unknown signals in untargeted metabolomics.
Mapping metabolite levels to metabolic models are a helpful way of interpreting the metabolic phenotype of an organism at a deeper systemic level.
Declaration of interest
The authors have no relevant affiliations or financial involvement with any organization or entity with a financial interest in or financial conflict with the subject matter or materials discussed in the manuscript. This includes employment, consultancies, honoraria, stock ownership or options, expert testimony, grants or patents received or pending, or royalties.
Reviewer disclosures
Peer reviewers on this manuscript have no relevant financial or other relationships to disclose.
Additional information
Funding
References
- Toubiana D, Fernie AR, Nikoloski Z, et al. Network analysis: tackling complex data to study plant metabolism. Trends Biotechnol. 2013 January 1;31(1):29–36.
- Beleggia R, Omranian N, Holtz Y, et al. Comparative analysis based on transcriptomics and metabolomics data reveal differences between emmer and durum wheat in response to nitrogen starvation. bioRxiv. 2020. https://doi.org/10.1101/2020.02.03.931717.
- Frainay C, Jourdan F. Computational methods to identify metabolic sub-networks based on metabolomic profiles. Brief Bioinform. 2016;18(1):43–56.
- Jeong H, Tombor B, Albert R, et al. The large-scale organization of metabolic networks. Nature. 2000 October 01;407(6804):651–654.
- Barabási A-L, Oltvai ZN. Network biology: understanding the cell’s functional organization. Nat Rev Genet. 2004 Feb 1;5(2):101–113.
- Arita M. The metabolic world of Escherichia coli is not small. Proc Natl Acad Sci U S A. 2004;101(6):1543–1547.
- Batushansky A, Matsuzaki S, Newhardt MF, et al. GC–MS metabolic profiling reveals fructose-2,6-bisphosphate regulates branched chain amino acid metabolism in the heart during fasting [journal article]. Metabolomics. 2019 January 28;15(2):18.
- Faust K, Croes D, van Helden J. Prediction of metabolic pathways from genome-scale metabolic networks. Biosystems. 2011 August 1;105(2):109–121.
- Yuan J, Bennett BD, Rabinowitz JD. Kinetic flux profiling for quantitation of cellular metabolic fluxes. Nat Protoc. 2008 August 1;3(8):1328–1340.
- Orth JD, Thiele I, Palsson BØ. What is flux balance analysis? Nat Biotechnol. 2010 March 1;28(3):245–248.
- Töpfer N, Kleessen S, Nikoloski Z. Integration of metabolomics data into metabolic networks [Review]. Front Plant Sci. 2015 February 17;6(49). DOI:10.3389/fpls.2015.00049
- Basler G, Fernie Alisdair R, Nikoloski Z. Advances in metabolic flux analysis toward genome-scale profiling of higher organisms. Biosci Rep. 2018;38(6). DOI:10.1042/BSR20170224
- Bordbar A, Monk JM, King ZA, et al. Constraint-based models predict metabolic and associated cellular functions. Nat Rev Genet. 2014 Feb 1;15(2):107–120.
- Nikoloski Z, Perez-Storey R, Sweetlove LJ. Inference and prediction of metabolic network fluxes. Plant Physiol. 2015;169(3):1443–1455.
- Lisec J, Schauer N, Kopka J, et al. Gas chromatography mass spectrometry–based metabolite profiling in plants. Nat Protoc. 2006 Jun 01;1(1):387–396.
- Tohge T, Fernie AR. Combining genetic diversity, informatics and metabolomics to facilitate annotation of plant gene function. Nat Protoc. 2010 Jun 10 online;5(6):1210.
- Šimura J, Antoniadi I, Široká J, et al. Plant hormonomics: multiple phytohormone profiling by targeted metabolomics. Plant Physiol. 2018;177(2):476–489.
- Morgenthal K, Weckwerth W, Steuer R. Metabolomic networks in plants: transitions from pattern recognition to biological interpretation. Biosystems. 2006;83(2):108–117.
- Weckwerth W, Loureiro ME, Wenzel K, et al. Differential metabolic networks unravel the effects of silent plant phenotypes. Proc Natl Acad Sci U S A. 2004;101(20):7809–7814.
- Angelovici R, Batushansky A, Deason N, et al. Network-guided GWAS improves identification of genes affecting free amino acids. Plant Physiol. 2017;173(1):872–886.
- Steuer R. Review: on the analysis and interpretation of correlations in metabolomic data. Brief Bioinform. 2006;7(2):151–158.
- Usadel B, Obayashi T, Mutwil M, et al. Co-expression tools for plant biology: opportunities for hypothesis generation and caveats. Plant Cell Environ. 2009;32(12):1633–1651.
- Wisecaver JH, Borowsky AT, Tzin V, et al. A global coexpression network approach for connecting genes to specialized metabolic pathways in plants. Plant Cell. 2017;29(5):944–959.
- Almquist J, Cvijovic M, Hatzimanikatis V, et al. Kinetic models in industrial biotechnology – improving cell factory performance. Metab Eng. 2014;24:38–60.
- Camacho D, de la Fuente A, Mendes P. The origin of correlations in metabolomics data. Metabolomics. 2005;1(1):53–63.
- Krumsiek J, Suhre K, Illig T, et al. Gaussian graphical modeling reconstructs pathway reactions from high-throughput metabolomics data. BMC Syst Biol. 2011;5(1):21.
- de la Fuente A, Bing N, Hoeschele I, et al. Discovery of meaningful associations in genomic data using partial correlation coefficients. Bioinformatics. 2004;20(18):3565–3574.
- Basu S, Duren W, Evans CR, et al. Sparse network modeling and metscape-based visualization methods for the analysis of large-scale metabolomics data. Bioinformatics. 2017;33(10):1545–1553.
- Schäfer J, Strimmer K. Learning large‐scale graphical gaussian models from genomic data. AIP Conf Proc. 2005;776(1):263–276.
- Müller-Linow M, Weckwerth W, Hütt M-T. Consistency analysis of metabolic correlation networks. BMC Syst Biol. 2007 Sep 24;1(1):44.
- Friedman J, Hastie T, Tibshirani R. Sparse inverse covariance estimation with the graphical lasso. Biostatistics. 2007;9(3):432–441.
- Song L, Langfelder P, Horvath S. Comparison of co-expression measures: mutual information, correlation, and model based indices. BMC Bioinformatics. 2012;13(1):328.
- Suarez-Diez M, Saccenti E. Effects of sample size and dimensionality on the performance of four algorithms for inference of association networks in metabonomics. J Proteome Res. 2015 Sep 4;14(12):5119–5130.
- DiLeo MV, Strahan GD, den Bakker M, et al. Weighted correlation network analysis (WGCNA) applied to the tomato fruit metabolome. PloS One. 2011;6(10):e26683–e26683..
- Saccenti E, Suarez-Diez M, Luchinat C, et al. Probabilistic networks of blood metabolites in healthy subjects as indicators of latent cardiovascular risk. J Proteome Res. 2015 Feb 6;14(2):1101–1111.
- Fukushima A. DiffCorr: an R package to analyze and visualize differential correlations in biological networks. Gene. 2013;518(1):209–214.
- Roessner U, Luedemann A, Brust D, et al. Metabolic profiling allows comprehensive phenotyping of genetically or environmentally modified plant systems. Plant Cell. 2001;13(1):11–29.
- Obata T, Florian A, Timm S, et al. On the metabolic interactions of (photo)respiration. J Exp Bot. 2016;67(10):3003–3014.
- Perez de Souza L, Garbowicz K, Brotman Y, et al. The acetate pathway supports flavonoid and lipid biosynthesis in Arabidopsis. Plant Physiol. 2020; 182(2):857–869.
- Szymanski J, Jozefczuk S, Nikoloski Z, et al. Stability of metabolic correlations under changing environmental conditions in Escherichia coli–a systems approach. PloS One. 2009;4(10):e7441–e7441.
- Rosato A, Tenori L, Cascante M, et al. From correlation to causation: analysis of metabolomics data using systems biology approaches [journal article]. Metabolomics. 2018 Feb 27;14(4):37.
- Batushansky A, Toubiana D, Fait A. Correlation-based network generation, visualization, and analysis as a powerful tool in biological studies: a case study in cancer cell metabolism. Biomed Res Int. 2016;2016:9.
- Shannon P, Markiel A, Ozier O, et al. Cytoscape: a software environment for integrated models of biomolecular interaction networks. Genome Res. 2003 Nov 1;13(11):2498–2504.
- Fukushima A, Kusano M, Redestig H, et al. Metabolomic correlation-network modules in Arabidopsis based on a graph-clustering approach. BMC Syst Biol. 2011;5(1):1.
- Langfelder P, Horvath S. WGCNA: an R package for weighted correlation network analysis. BMC Bioinformatics. 2008;9(1):559.
- Wen B, Mei Z, Zeng C, et al. metaX: a flexible and comprehensive software for processing metabolomics data. BMC Bioinf. 2017;18(1):183.
- Ma J, Karnovsky A, Afshinnia F, et al. Differential network enrichment analysis reveals novel lipid pathways in chronic kidney disease. Bioinformatics. 2019;35(18):3441–3452.
- Faith JJ, Hayete B, Thaden JT, et al. Large-scale mapping and validation of Escherichia coli transcriptional regulation from a compendium of expression profiles. PLoS Biol. 2007;5(1):e8–e8.
- Jahagirdar S, Suarez-Diez M, Saccenti E. Simulation and reconstruction of metabolite–metabolite association networks using a metabolic dynamic model and correlation based algorithms. J Proteome Res. 2019 Mar 1;18(3):1099–1113.
- Vignoli A, Tenori L, Giusti B, et al. Differential network analysis reveals metabolic determinants associated with mortality in acute myocardial infarction patients and suggests potential mechanisms underlying different clinical scores used to predict death. J Proteome Res. 2020;19(2):949–961.
- Wolfender J-L, Nuzillard J-M, van der Hooft JJJ, et al. accelerating metabolite identification in natural product research: toward an ideal combination of liquid chromatography–high-resolution tandem mass spectrometry and NMR profiling, in silico databases, and chemometrics. Anal Chem. 2019;91(1):704–742.
- Paglia G, Williams JP, Menikarachchi L, et al. Ion mobility derived collision cross sections to support metabolomics applications. Anal Chem. 2014;86(8):3985–3993.
- Zhang X, Quinn K, Cruickshank-Quinn C, et al. The application of ion mobility mass spectrometry to metabolomics. Curr Opin Chem Biol. 2018;42:60–66.
- Fox Ramos AE, Evanno L, Poupon E, et al. Natural products targeting strategies involving molecular networking: different manners, one goal [10.1039/C9NP00006B]. Nat Prod Rep. 2019;36(7):960–980.
- Watrous J, Roach P, Alexandrov T, et al. Mass spectral molecular networking of living microbial colonies. Proc Nat Acad Sci. 2012;109(26):E1743–E1752.
- Allard P-M, Péresse T, Bisson J, et al. Integration of molecular networking and in-Silico MS/MS fragmentation for natural products dereplication. Anal Chem. 2016 Mar 15;88(6):3317–3323.
- Ueoka R, Uria AR, Reiter S, et al. Metabolic and evolutionary origin of actin-binding polyketides from diverse organisms. Nat Chem Biol. 2015 Sep 1;11(9):705–712.
- Matsuda F, Nakabayashi R, Yang Z, et al. Metabolome-genome-wide association study dissects genetic architecture for generating natural variation in rice secondary metabolism. Plant J. 2015;81(1):13–23.
- Bouslimani A, Porto C, Rath CM, et al. Molecular cartography of the human skin surface in 3D. Proc Nat Acad Sci. 2015;112(17):E2120–E2129.
- Kwon Y-K, Ha IJ, Bae H-W, et al. Dose-dependent metabolic alterations in human cells exposed to gamma irradiation. Plos One. 2014;9(11):e113573.
- Frank AM, Bandeira N, Shen Z, et al. Clustering millions of tandem mass spectra. J Proteome Res. 2008;7(1):113–122.
- Yang JY, Sanchez LM, Rath CM, et al. Molecular networking as a dereplication strategy. J Nat Prod. 2013 September 27;76(9):1686–1699.
- Wang M, Carver JJ, Phelan VV, et al. Sharing and community curation of mass spectrometry data with global natural products social molecular networking. Nat Biotechnol. 2016;34(8):828–837.
- Tsugawa H, Cajka T, Kind T, et al. MS-DIAL: data-independent MS/MS deconvolution for comprehensive metabolome analysis. Nat Methods. 2015 May 4 online;12(6):523.
- Pluskal T, Castillo S, Villar-Briones A, et al. MZmine 2: modular framework for processing, visualizing, and analyzing mass spectrometry-based molecular profile data. BMC Bioinformatics. 2010;11(1):395.
- Röst HL, Sachsenberg T, Aiche S, et al. OpenMS: a flexible open-source software platform for mass spectrometry data analysis. Nat Methods. 2016 Sep 1;13(9):741–748.
- Smith CA, Want EJ, O’Maille G, et al. XCMS: processing mass spectrometry data for metabolite profiling using nonlinear peak alignment, matching, and identification. Anal Chem. 2006 Feb 1;78(3):779–787.
- Nothias LF, Petras D, Schmid R, et al. Feature-based molecular networking in the GNPS analysis environment. bioRxiv. 2019.DOI: https://doi.org/10.1101/812404
- da Silva RR, Wang M, Nothias L-F, et al. Propagating annotations of molecular networks using in silico fragmentation. PLoS Comput Biol. 2018;14(4):e1006089.
- Ruttkies C, Schymanski EL, Wolf S, et al. MetFrag relaunched: incorporating strategies beyond in silico fragmentation [journal article]. J Cheminform. 2016 January 29;8(1):3.
- Gerlich M, Neumann S. MetFusion: integration of compound identification strategies. J Mass Spectrom. 2013;48(3):291–298.
- van der Hooft JJJ, Wandy J, Barrett MP, et al. Topic modeling for untargeted substructure exploration in metabolomics. Proc Nat Acad Sci. 2016;113(48):13738–13743.
- Aksenov A, Laponogov I, Zhang Z, et al. Algorithmic Learning for Auto-deconvolution of GC-MS Data to Enable Molecular Networking within GNPS. bioRxiv. 2020. https://doi.org/10.1101/2020.01.13.905091
- Perez de Souza L, Naake T, Tohge T, et al. From chromatogram to analyte to metabolite. How to pick horses for courses from the massive web resources for mass spectral plant metabolomics. GigaScience. 2017;6(7). DOI:10.1093/gigascience/gix037.
- Morreel K, Saeys Y, Dima O, et al. Systematic structural characterization of metabolites in arabidopsis via candidate substrate-product pair networks. Plant Cell. 2014;26(3):929–945.
- Perez de Souza L, Scossa F, Proost S, et al. Multi-tissue integration of transcriptomic and specialized metabolite profiling provides tools for assessing the common bean (Phaseolus vulgaris) metabolome. Plant J. 2019;97(6):1132–1153.
- Hartmann AC, Petras D, Quinn RA, et al. Meta-mass shift chemical profiling of metabolomes from coral reefs. Proc Nat Acad Sci. 2017;114(44):11685–11690.
- Naake T, Fernie AR. MetNet: metabolite network prediction from high-resolution mass spectrometry data in R aiding metabolite annotation. Anal Chem. 2019 Feb 5;91(3):1768–1772.
- Kuhl C, Tautenhahn R, Böttcher C, et al. CAMERA: an integrated strategy for compound spectra extraction and annotation of liquid chromatography/mass spectrometry data sets. Anal Chem. 2012 Jan 3;84(1):283–289.
- Forcisi S, Moritz F, Lucio M, et al. Solutions for low and high accuracy mass spectrometric data matching: a data-driven annotation strategy in nontargeted metabolomics. Anal Chem. 2015 Sep 1;87(17):8917–8924.
- Kankainen M, Gopalacharyulu P, Holm L, et al. MPEA—metabolite pathway enrichment analysis. Bioinformatics. 2011;27(13):1878–1879.
- Xia J, Wishart DS. MSEA: a web-based tool to identify biologically meaningful patterns in quantitative metabolomic data. Nucleic Acids Res. 2010;38(suppl_2):W71–W77.
- Chagoyen M, Pazos F. MBRole: enrichment analysis of metabolomic data. Bioinformatics. 2011;27(5):730–731.
- Marco-Ramell A, Palau-Rodriguez M, Alay A, et al. Evaluation and comparison of bioinformatic tools for the enrichment analysis of metabolomics data [journal article]. BMC Bioinformatics. 2018 Jan 2;19(1):1.
- Kanehisa M, Furumichi M, Tanabe M, et al. KEGG: new perspectives on genomes, pathways, diseases and drugs. Nucleic Acids Res. 2016;45(D1):D353–D361.
- Caspi R, Billington R, Keseler IM, et al. The metaCyc database of metabolic pathways and enzymes - a 2019 update. Nucleic Acids Res. 2020;48(D1):D445–D453.
- Ivanisevic J, Want EJ. From samples to insights into metabolism: uncovering biologically relevant information in LC-HRMS metabolomics data. Metabolites. 2019;9(12):308.
- Stanstrup J, Broeckling CD, Helmus R, et al. The metaRbolomics toolbox in bioconductor and beyond. Metabolites. 2019;9(10):200.
- Aggio RBM, Ruggiero K, Villas-Bôas SG. Pathway activity profiling (PAPi): from the metabolite profile to the metabolic pathway activity. Bioinformatics. 2010;26(23):2969–2976.
- Chong J, Soufan O, Li C, et al. MetaboAnalyst 4.0: towards more transparent and integrative metabolomics analysis. Nucleic Acids Res. 2018;46(W1):W486–W494.
- Cottret L, Frainay C, Chazalviel M, et al. MetExplore: collaborative edition and exploration of metabolic networks. Nucleic Acids Res. 2018;46(W1):W495–W502.
- Kutmon M, van Iersel MP, Bohler A, et al. PathVisio 3: an extendable pathway analysis toolbox. PLoS Comput Biol. 2015;11(2):e1004085.
- Barupal DK, Fiehn O. Chemical similarity enrichment analysis (ChemRICH) as alternative to biochemical pathway mapping for metabolomic datasets. Sci Rep. 2017 November 06;7(1):14567.
- Schilling CH, Schuster S, Palsson BO, et al. Metabolic pathway analysis: basic concepts and scientific applications in the post-genomic Era. Biotechnol Prog. 1999 Jan 1;15(3):296–303.
- Ginsburg H. Caveat emptor: limitations of the automated reconstruction of metabolic pathways in plasmodium. Trends Parasitol. 2009;25(1):37–43.
- Lacroix V, Cottret L, Thébault P, et al. An introduction to metabolic networks and their structural analysis. IEEE/ACM Trans Comput Biol Bioinform. 2008;5(4):594–617.
- Arita M. Metabolic reconstruction using shortest paths. Simul Pract Theory. 2000 April 15;8(1):109–125.
- Holme P. Model validation of simple-graph representations of metabolism. J Royal Soc Interface. 2009;6(40):1027–1034.
- Croes D, Couche F, Wodak SJ, et al. Inferring meaningful pathways in weighted metabolic networks. J Mol Biol. 2006 Feb 10;356(1):222–236.
- Blum T, Kohlbacher O. MetaRoute: fast search for relevant metabolic routes for interactive network navigation and visualization. Bioinformatics. 2008;24(18):2108–2109.
- Latendresse M, Krummenacker M, Karp PD. Optimal metabolic route search based on atom mappings. Bioinformatics. 2014;30(14):2043–2050.
- Pertusi DA, Stine AE, Broadbelt LJ, et al. Efficient searching and annotation of metabolic networks using chemical similarity. Bioinformatics. 2014;31(7):1016–1024.
- Frainay C, Aros S, Chazalviel M, et al. MetaboRank: network-based recommendation system to interpret and enrich metabolomics results. Bioinformatics. 2018;35(2):274–283.
- Rahman SA, Torrance G, Baldacci L, et al. Reaction decoder tool (RDT): extracting features from chemical reactions. Bioinformatics. 2016;32(13):2065–2066.
- Faust K, Dupont P, Callut J, et al. Pathway discovery in metabolic networks by subgraph extraction. Bioinformatics. 2010;26(9):1211–1218.
- Milreu PV, Klein CC, Cottret L, et al. Telling metabolic stories to explore metabolomics data: a case study on the yeast response to cadmium exposure. Bioinformatics. 2013;30(1):61–70.
- Weiss N, Barbier Saint Hilaire P, Colsch B, et al. Cerebrospinal fluid metabolomics highlights dysregulation of energy metabolism in overt hepatic encephalopathy. J Hepatol. 2016 Dec 1;65(6):1120–1130.
- Sridharan VG, Bruinsma GB, Bale SS, et al. Metabolomic modularity analysis (MMA) to quantify human liver perfusion dynamics. Metabolites. 2017;7(4):58.
- Li S, Park Y, Duraisingham S, et al. Predicting network activity from high throughput metabolomics. PLoS Comput Biol. 2013;9(7):e1003123.
- Pirhaji L, Milani P, Leidl M, et al. Revealing disease-associated pathways by network integration of untargeted metabolomics. Nat Methods. 2016 Sep 1;13(9):770–776.
- Alden N, Krishnan S, Porokhin V, et al. Biologically consistent annotation of metabolomics data. Anal Chem. 2017 December 19;89(24):13097–13104.
- Allen F, Greiner R, Wishart D. Competitive fragmentation modeling of ESI-MS/MS spectra for putative metabolite identification [journal article]. Metabolomics. 2015 Feb 1;11(1):98–110.
- Tautenhahn R, Cho K, Uritboonthai W, et al. An accelerated workflow for untargeted metabolomics using the METLIN database. Nat Biotechnol. 2012 Sep 1;30(9):826–828.
- Wishart DS, Feunang YD, Marcu A, et al. HMDB 4.0: the human metabolome database for 2018. Nucleic Acids Res. 2017;46(D1):D608–D617.
- Shen X, Wang R, Xiong X, et al. Metabolic reaction network-based recursivemetabolite annotation for untargeted metabolomics. Nat Commun. 2019 April 3;10(1):1516.
- Moreno P, Beisken S, Harsha B, et al. BiNChE: A web tool and library for chemical enrichment analysis based on the ChEBI ontology. BMC Bioinformatics. 2015 Feb 21;16(1):56.
- Djoumbou Feunang Y, Eisner R, Knox C, et al. ClassyFire: automated chemical classification with a comprehensive, computable taxonomy. J Cheminform. 2016 Nov 4;8(1):61.
- Ernst M, Kang KB, Caraballo-Rodríguez AM, et al. MolNetEnhancer: enhanced molecular networks by integrating metabolome mining and annotation tools. Metabolites. 2019;9(7):144.
- Schwahn K, Beleggia R, Omranian N, et al. Stoichiometric correlation analysis: principles of metabolic functionality from metabolomics data [Original research]. Front Plant Sci. 2017 Dec 18;8(2152). DOI:10.3389/fpls.2017.02152.
- Öksüz M, Sadıkoğlu H, Çakır T. Sparsity as cellular objective to infer directed metabolic networks from steady-state metabolome data: a theoretical analysis. PloS One. 2013;8(12):e84505–e84505.
- Sontag E, Kiyatkin A, Kholodenko BN. Inferring dynamic architecture of cellular networks using time series of gene expression, protein and metabolite data. Bioinformatics. 2004;20(12):1877–1886.
- Alseekh S, Fernie AR. Metabolomics 20 years on: what have we learned and what hurdles remain? Plant J. 2018;94(6):933–942.
- Nguyen DH, Nguyen CH, Mamitsuka H. ADAPTIVE: leArning DAta-dePendenT, concIse molecular VEctors for fast, accurate metabolite identification from tandem mass spectra. Bioinformatics. 2019;35(14):i164–i172.
- Ji H, Xu Y, Lu H, et al. Deep MS/MS-aided structural-similarity scoring for unknown metabolite identification. Anal Chem. 2019 May 7;91(9):5629–5637.
- Gabelica V, Marklund E. Fundamentals of ion mobility spectrometry. Curr Opin Chem Biol. 2018 Feb 1;42:51–59.