
 ?Mathematical formulae have been encoded as MathML and are displayed in this HTML version using MathJax in order to improve their display. Uncheck the box to turn MathJax off. This feature requires Javascript. Click on a formula to zoom.
Abstract
Objective: This study aimed to evaluate a more energy-efficient dynamic current focussing (DCF) speech-processing strategy after long-term listening experience. In DCF, tripolar stimulation is used near the threshold and loudness is controlled by the compensation coefficient σ. A recent acute pilot study showed improved spectral-temporally modulated ripple test (SMRT) scores at low loudness levels, but battery life was reduced to 1.5–4 hours.
Design: Within-subject comparisons were made for the clinical versus. DCF strategy after 5 weeks of at-home usage. Speech intelligibility in noise, spectral ripple discrimination, temporal modulation detection, loudness growth, and subjective ratings were assessed.
Study sample: Twenty HiRes90K (Advanced Bionics, Valencia, USA) cochlear implant (CI) users.
Results: Average battery life was 9 hours with the newly implemented DCF compared to 13.4 hours with the clinical strategy. Compared with measurements made at the beginning of the study, SMRT-scores and speech intelligibility in noise were significantly improved with DCF. However, both measures suffered from unexpected learning effects over time. The improvement disappeared and speech intelligibility in noise declined significantly relative to the final control measurement with the clinical strategy.
Conclusion: Most CI users can adapt to the DCF strategy in a take-home setting. Although DCF has the potential to improve performance on the SMRT test, learning effects complicate the interpretation of the current results.
Introduction
Although speech perception is relatively good with current cochlear implants (CIs), especially in a quiet environment, there can be great variability in performance between subjects using the same device (Firszt et al. Citation2004). Specifically, performance declines when listening conditions become more difficult, such as in noisy environments. In addition to patient-specific factors, this deterioration is likely caused by a large current spread throughout the cochlea (Bierer Citation2010). This broad current spread, particularly with monopolar (MP) stimulation, leads to channel interactions, which decrease the number of functional spectral channels and spectral resolution (Jones et al. Citation2013). These aspects are essential for sound perception in difficult listening conditions (Shannon, Fu, and Galvin Citation2004). As a result, current focussing stimulation modes have been developed to avert this broad current spread by shaping the electric current field (Bonham and Litvak Citation2008; Srinivasan, Landsberger, and Shanon Citation2010; Vellinga et al. Citation2017b). In focussed stimulation schemes, the active electrode delivers the intended current waveform and flanking electrode contacts, which carry the opposite polarity of current to close the circuit loop, serve as the return electrodes. One example is partial tripolar (TP) stimulation, which decreases the current spread, improves spatial selectivity, and improves spectral resolution and speech performance in many CI patients (Bierer Citation2007; Zhu et al. Citation2012; Srinivasan et al. Citation2013; Padilla and Landsberger Citation2016). A major challenge in the clinical applicability of these stimulation modes is power consumption. Since the opposite polarities of the centre and adjacent electrodes act to cancel each other, large currents are required to reach threshold and comfortable listening levels (Bierer Citation2007; Frijns, Dekker, and Briaire Citation2011; van den Honert and Kelsall Citation2007). Full loudness growth is not always accomplished within the compliance limits of the implant, especially in patients with high electrode impedances.
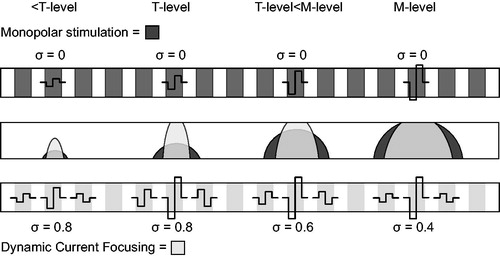
To resolve this issue, a novel loudness encoding strategy called dynamic current focussing (DCF) was developed at Leiden University Medical Centre (LUMC) in the Netherlands (de Jong, Briaire, and Frijns Citation2018). The DCF strategy was designed to retain the advantageous effects of current focussing with partial TP stimulation near threshold, while remaining energy efficient and optimally focussed at the most comfortable level (M-level) (). The amplitudes of the active and flanking electrode contacts of the partial tripole are increased equally up to the threshold level (T-level) with a constant level of current focussing, expressed as current compensation coefficient σ (equal to 0.8, 0.9 or 1.0), which denotes the fraction of the return current going through the flanking electrodes. To further increase the loudness from the T-level, σ is gradually decreased, resulting in a broader excitation pattern and, consequently, a higher perceived loudness level. In a pilot study of 11 CI users, spectral-temporally modulated ripple test (SMRT) scores at lower presentation levels were significantly improved with the DCF strategy compared with the scores using their regular clinical speech coding strategy (de Jong, Briaire, and Frijns Citation2018). In each subject, the SMRT scores improved at one or both of the presentation levels. Speech intelligibility in noise remained the same even though the subjects had at least 9 months of experience with their clinical strategy and just a few hours of experience with the DCF strategy. In addition, the clinical and DCF strategies were rated equally when the subjects were asked if they preferred the DCF strategy, their own clinical programme, or had no preference. This is promising, as CI users often prefer their known strategy over a novel (for them) speech coding strategy in an acute setting. Moreover, in a recently published study with another dynamic TP strategy, in which T-levels were fitted with a σ of 0.8 and M-levels with a σ of 0.5, a beneficial effect was found on vowel identification in noise (Arenberg et al. Citation2018). Considering the data from our pilot study and the available literature, we hypothesised that a beneficial effect on speech perception and SMRT scores would be achieved if CI users employed the DCF strategy long term.
Figure 1. The concept of loudness coding with dynamic current focussing (DCF) and monopolar (MP) stimulation. The upper bar for each loudness step shows the auditory nerve with the excitation pattern in grey. The lower bars show the implanted electrode array with the electrode contacts in grey. In the DCF strategy, the amplitudes of the main and neighbouring electrode contacts are increased equally up to the threshold level (T-level). To increase the loudness from the T-level, σ is decreased as a function of the stimulus level, resulting in a broader excitation pattern and higher loudness level. In MP mode, the amplitude of the main electrode contact is increased as a function of the stimulus level, resulting in broad current spreads at all loudness levels. M-level, most comfortable level.
To allow subjects to acclimatise to the DCF strategy in a take-home study, further development was needed. Although the power consumption of the DCF strategy was decreased relative to full TP stimulation and DCF stimulation always remained within the compliance limits of the device, the battery usage was still significantly increased compared with MP stimulation in the pilot study. To increase the clinical applicability of this strategy, power-saving adjustments were made as described in the Materials and Methods. One relevant change was that the degree of current focussing at the T-level was decreased to a sigma of 0.8 for all electrode contacts in all participants. This decreased the battery consumption, though it also potentially weakened the beneficial effects of the novel speech coding strategy.
The current study was a take-home trial in which participants had 5 weeks to adjust to the optimised version of the DCF strategy. Performances regarding speech intelligibility in noise, spectral ripple discrimination, and temporal modulation detection were examined at different presentation levels and compared with the participants’ clinical speech coding strategies. Although previous research has shown that learning effects in psychophysical measures are extinguished after 5-week test intervals (Won, Drennan, and Rubinstein Citation2007), a measurement was made with the clinical speech coding strategy after completing the trial to determine if any learning effect was present.
Materials and methods
Subjects
Twenty post-lingually deaf adults (12 women and 8 men, aged 34 to 70 years) participated in this study. All were unilaterally implanted with an Advanced Bionics CI (Sylmar, CA) at least 9 months before inclusion. The speech coding strategies used clinically were the HiResolution (HiRes; n = 1) (Firszt Citation2003), HiRes Fidelity 120 (HiResF120; n = 2) (Büchner et al. Citation2012), and HiRes Optima (n = 17) (Advanced Bionics Citation2012). The patients’ clinical characteristics are presented in . The DCF strategy uses multipolar stimulation; therefore, only CI users with 16 active electrode contacts in their normal programme were included in the study. Subjects 7 and 10 voluntarily dropped out due to difficulties adjusting to the novel strategy and underestimating the burden of participation in a clinical trial. Subject 14 completed the trial but was excluded from the analysis because of technical issues with the CI that interfered with the results but were unrelated to the trial. Due to time constraints and fatigue, the baseline spectral ripple measurement at 45 dB was missing for Subject 11. The modulation detection threshold (MDT) measurements were also missing for Subjects 11 and 16. Subject 1 did not fill in the quality section of the SSQ and Subject 20 did not fill in the entire SSQ questionnaire. No other data were missing. The study protocol was approved by the Committee for Medical Ethics of the Leiden University Medical Centre (P02.106).
Table 1. Characteristics of the study subjects.
Study design
The current trial consisted of three sessions with an interval of 5 weeks between test days. In session 1, the subject’s clinical strategy and the DCF strategy were fitted on a Harmony sound processor dedicated to research purposes. The baseline performance was then assessed with their usual clinical strategy. In the first 5 weeks, the subjects became familiar with the DCF strategy. If the subjects had complaints, an extra fitting was offered in the first week. During this extra fitting, the programmed settings or MAPs (including T- and M-levels, stimulation rate, and other parameters) were adjusted. Eight of the 17 subjects requested this extra fitting, after which most of them considered the subjective quality of sound to be improved. During the trial, subjects were allowed to use their clinical speech processor but were instructed to use the DCF strategy as much as possible. Thirteen of the 17 subjects reported using the DCF strategy in the same way as their clinical strategy, two other subjects started using the DCF strategy full-time after the extra fitting in the first week (Subjects 2 and 6), Subject 16 used the strategy every other day because of dissatisfaction, and Subject 1 barely used the DCF strategy during the 5-week accommodation period because of dissatisfaction. In session 2, subjects performed the psychophysical tasks with the DCF strategy (after the 5-week accommodation period). Then, their clinical strategy was fitted on a Harmony research processor for the next 5 weeks. In session 3 (after five weeks of home usage), the psychophysical measures were performed again with the clinical strategy to check for learning effects. The subjects were not blinded to the tested speech coding strategy, as they could easily detect their normal strategy.
Fitting procedures
Clinical strategy
The MAPs from each subject’s last clinical visit were copied from the SoundWave™ programme (Advanced Bionics, Valencia, CA, USA) and fitted on a Harmony research processor. If the noise cancellation features were active, they were turned off throughout the study.
Research strategy
The concept of the DCF strategy is clarified in . The DCF programme was created for each subject using BEPS + software (Advanced Bionics, Valencia, CA, USA). As the pilot study revealed a decrease in the DCF battery life to 1.5-4 hours (de Jong, Briaire, and Frijns Citation2018), some alterations to the fitting parameters were necessary to make the strategy suitable for the current take-home trial. Instead of aiming for a high σ at T-level, T-levels were determined for each electrode contact by slowly increasing the total amount of current with a σ of 0.8, which means that 80% of the current was returned equally to the two flanking electrodes and 20% was returned to the extra-cochlear ground electrode. In the current study this was true for all subjects. In the pilot study, however, σ at T-level was increased to 0.9 or 1.0 when the T-level was below 300 clinical units to ensure full loudness growth before σ was reduced to zero. As with the pilot DCF version, the M-levels were determined by gradually decreasing σ in steps of 0.01. This means that the current level on each main contact was kept constant while the current levels on the flanking electrode contacts were decreased. In this way, the excitation pattern was broadened and the loudness level increased. As a result, the dynamic range of the DCF strategy was defined by variations in σ. Another relevant difference to the pilot study was that a negative σ value was allowed to ensure full loudness growth (i.e. flanking electrodes could have the same polarity as the centre electrode contact). Subjects 1, 4, and 20 needed negative σ values at multiple electrode contacts to reach sufficient loudness. The mean σ at M-level for all subjects and electrode contacts was 0.17 [−0.22 – 0.39] (). To optimise the subjective quality of the sound, M-levels were manually adjusted per electrode contact after turning on the speech mode and, therefore, no loudness balancing per electrode contact was performed. The overall loudness with the DCF strategy was adjusted until the subjects indicated that it had the same loudness as their clinical speech coding strategy. In contrast to the pilot study, low-power modes were turned on (the target tank value was automated and the maximum power that can be supplied to the device was lowered) and the target voltage was set to 6.5 V instead of 7.3 V to avoid system voltage fluctuations. Noise reduction algorithms were switched off. Because three physical electrode contacts are required to create one current focussing channel, the two outer electrodes of the array could not be used. Therefore, the DCF strategy had only 14 effective spectral channels, whereas the clinical strategy had 16 for the HiRes programme and 120 virtual spectral channels for the current steered speech coding strategies. The stimulation rates were significantly lower with the DCF strategy (929 pulses per second (pps) on average) than the clinical ones (2491 pps on average) ().
Psychophysical tasks
Loudness growth functions
As in the pilot study, a loudness scaling experiment was performed in this take-home trial at three different locations along the electrode array (electrodes 3, 9, and 14) for both stimulation strategies. The stimuli for the loudness growth experiment were acoustically administered via a direct connection to the speech processor and, therefore, processed with either the DCF or clinical strategy. The stimuli were sine waves with frequencies corresponding to the centre frequencies of electrodes 3, 9, and 14, which were generated by a custom MATLAB programme. The stimulus levels were calculated as follows:
(Eq.1)
(Eq.1)
where
was the administered voltage and
was calibrated for each electrode using the peak calculation of BEPS + software so the digital stimuli approximately matched the microphone output with the same sound pressure level. To avoid overstimulation at the initiation of the measurement, only ascending scaling was performed in steps of 2 dB, starting from 0 dB to a maximum of 100 dB. As in previous studies (Kalkman, Briaire, and Frijns Citation2015; Vellinga et al. Citation2017a, Citation2017b), loudness was subjectively rated on an 8-point loudness scale that ranged from the T-level (1) to the most comfortable loudness (5) and the upper limit of comfortable loudness (8). When the upper limit was reached, the experiment was terminated (Potts et al. Citation2007). The procedure was repeated three times per electrode contact, and the average voltage per loudness level was calculated.
As in the pilot study, the areas under the curves (AUCs) from loudness points 2 to 5 (from “very soft sound” to “most comfortable loudness”) were calculated to quantify the slope of the loudness growth curves. Loudness points 2 to 5 were chosen because they correspond to regular speech levels and were considered the most important for understanding speech.
(Eq.2)
(Eq.2)
In EquationEquation (2)(Eq.2)
(Eq.2) ,
is the subjective level from EquationEquation (1)
(Eq.1)
(Eq.1) ,
is the subjective loudness level, and
is the difference in loudness level between
and
(in dB). Differences in the AUC (
) between the two strategies were calculated as follows:
(Eq.3)
(Eq.3)
where
is the AUC for the clinical strategy and
is the AUC for the DCF strategy.
Psychophysical tasks - sound booth testing
The following tasks were performed in the free field in a double-walled sound-attenuating booth. Subjects were facing a single loudspeaker at a distance of 1 m. To avoid learning effects of the psychophysical tasks, the subjects went through at least one dry run before the actual test runs were performed.
Spectral ripple test
The Spectral-temporally Modulated Ripple Test (SMRT) (Aronoff and Landsberger Citation2013) was used to determine spectral ripple density thresholds at 45 dB and 65 dB. This spectral ripple test was chosen because it deals with potential confounders, such as loudness cues. Although it is unclear whether the SMRT scores represent frequency resolution or other perceptual abilities (Dinino and Arenberg 2018), the scores correlate with speech understanding under multiple listening conditions (Holden et al. Citation2016; Lawler, Yu, and Aronoff Citation2017; Zhou Citation2017). The SMRT is a three-alternative forced choice (3AFC) task that determines the maximum ripples per octave (RPO) that a listener can distinguish from two reference stimuli with unresolvable high ripple densities of 20 RPO. The listeners were asked to discriminate the adaptive spectrally rippled stimulus from the two reference stimuli, and no feedback about the correct answer was provided. The task was repeated six times per test condition and the average SMRT score was computed.
Temporal modulation detection test
Since stimulation rates decrease with the DCF strategy (), the effect on temporal resolution was measured. The temporal modulation detection test adapted from Won et al. (Citation2011) was used to examine the MDTs with each speech coding strategy. In this two-alternative, forced choice, adaptive measure, two 1-secondwide band noise stimuli were presented; one was amplitude modulated with a frequency of 100 Hz. Subjects were instructed to choose the amplitude-modulated stimulus, the modulation depth of which was adapted using a 2-down 1-up procedure. To help the subjects remember which of the two intervals was the target stimulus, visual feedback about the correct answer was provided. A modulation frequency of 100 Hz was chosen because this task, along with the spectral ripple thresholds, accounts for the highest amount of variance in consonant nucleus consonant word scores (Won et al. Citation2011). The task was performed at 65 dB and repeated six times, and average MDTs were calculated in decibels relative to 100% modulation ().
Speech-in-noise test
A Dutch version of the matrix sentence test was used to measure the speech reception thresholds (SRTs) for each test condition. This speech-in-noise test uses 50 unique words combined into 200 grammatically equivalent sentences (Houben et al. Citation2014). Ten balanced lists with 20 randomly selected sentences are available for testing. The task was carried out using the APEX 3 programme (Leuven, Belgium) (Francart, van Wieringen, and Wouters Citation2008) installed on a personal computer. After the presentation of each sentence, the subjects were instructed to repeat the five words and to guess if they were unsure. Testing was done at a fixed speech level of 65 dB(A) or 45 dB(A) and with an adaptive speech-shaped noise starting from a −4 dB signal-to-noise ratio (SNR). Two training runs of 20 sentences each were performed prior to each test condition, as recommended by Kollmeier et al. (Citation2015). An average SNR was calculated over three repetitions to determine the final SRT score for each loudness level and speech coding strategy.
Subjective ratings
To evaluate the subjective ratings of the clinical and DCF speech coding strategies, the Speech, Spatial, and Qualities of Hearing Scale (SSQ) was used (Gatehouse and Noble Citation2004). This is a measure for evaluating various aspects of hearing disabilities, and the domains “quality of hearing” and “speech understanding” were assessed. In addition, all subjects were asked whether their overall rating of the DCF strategy was better, equal to, or worse than their clinical programme. Subjects also kept a daily log about the time (in hours) they had turned on the DCF strategy each day.
Statistical analysis
Repeated measurements within subjects were obtained in all experiments. Therefore, two-way repeated measures analysis of variance (ANOVA) and linear mixed effects models were run using IBM® SPSS Statistics for Windows, Version 23.0. Both models control for the within-subject nature of the tasks by including random effects for subject and subject-task interactions. Moreover, the mixed-model design accounts for missing data. The fixed factors “test session” and “presentation level” were included in the linear mixed model, and “test session” and “repetition number in each test session” (1–3 for the Dutch Matrix test and 1–6 for the SMRT and the MDT) were used in the two-way repeated measures ANOVA to determine whether repetition number and the interaction between test session and repetition number had main effects.
Results
Loudness growth functions
The individual loudness growth functions with the clinical and DCF strategies are shown in . The loudness scores are plotted as a function of the presentation level in decibels, and the AUCs are represented by the filled areas. The average AUC was 22.1 for the clinical strategies and 31.0 (i.e. more shallow curves) for the DCF strategy. A 2-way repeated measures ANOVA with “strategy” and “electrode number” as factors revealed that this difference was significant (F(1,16)=9.645, p = 0.007). Individual ΔAUCs per electrode contact are shown in . In all but one subject and one electrode contact (Subject 20, electrode 14), sufficient loudness was achieved to reach the most comfortable level. In 8 of the 17 subjects (Subjects 4, 8, 9, 11, 12, 13, 16, and 20), we were unable to reach the highest acceptable loudness with the DCF strategy, within the limits described in the Material and Methods.
Figure 2. Individual loudness growth functions on an 8-point loudness scale (y-axes). The stimulus levels were calculated as follows: where
was calibrated for each electrode contact using BEPS + software. For understanding speech, the loudness levels “2” (very soft sound) to “5” (the most comfortable loudness) were considered the most relevant. This loudness range is shaded in grey. The areas under the curves (AUCs) are indicated for the two strategies. DCF: dynamic current focussing.
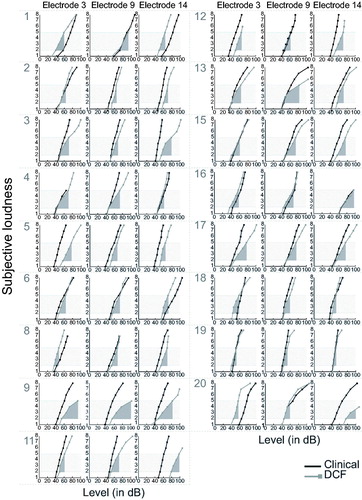
Table 2. Differences in the areas under the loudness curves (ΔAUCs) between the two strategies for each subject at the indicated electrodes.
Spectral ripple test
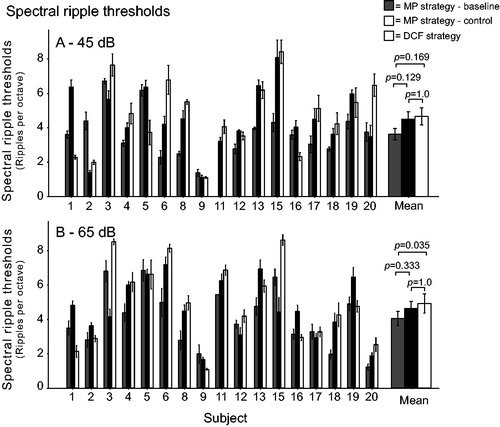
The individual and mean SMRT results at 45 and 65 dB are depicted in . A linear mixed model with the fixed factors “test session”, “presentation level”, and “test session * presentation level” showed that the overall performance on the SMRT (45 and 65 dB combined) was significantly influenced by the test session (F(2,16) = 4.260, p = 0.033). A pairwise comparison specified that the performance was significantly improved from 3.86 RPO at baseline to 4.80 RPO with the DCF strategy (Bonferroni-corrected p = 0.035). However, a marginal improvement also occurred from baseline to the control clinical measurement (4.56 RPO, with a nominal p-value of 0.042). Because DCF stimulation was expected to improve spectral resolution at lower loudness levels, the two scores at the two loudness levels were also evaluated separately. At 45 dB, the mean SMRT scores were 3.62, 4.49, and 4.66 RPO for the baseline, control clinical, and DCF strategies, respectively. A linear mixed model showed that test session had no effect on the SMRT scores at this loudness level (F(2,16 = 2.873, p = 0.086). At 65 dB, the mean SMRT scores were 4.05, 4.63, and 4.92 RPO for the baseline, control clinical, and DCF strategies, respectively. The linear mixed model showed a significant effect of test session (F(2,16)=5.062, p = 0.02), and the pairwise comparison showed that the mean improvement with the DCF strategy compared with the clinical baseline measurement was significant (Bonferroni-corrected p = 0.035). However, when the DCF SMRT scores were compared with the clinical control measurement, the difference was not significant (Bonferroni corrected p = 1.0). No significant improvement over time (baseline versus control clinical measurement) could be demonstrated (Bonferroni-corrected p = 0.333). The repetition number had a significant effect within test sessions (F(5,80)=3.58, p = 0.006), but there was no interaction between the repetition number and test session by two-way repeated measures ANOVA (F(10,160)=0.88, p = 0.552).
Figure 3. Individual and mean spectral ripple thresholds at 45 dB (a) and 65 dB (b) for the 17 study subjects using their monopolar (MP) clinical strategy (baseline and control measurements) and dynamic current focussing (DCF). Error bars represent ± 1 standard error of the mean.
In the pilot study, a small ΔAUC (i.e., a small difference between AUCs with the clinical and DCF strategies) predicted a better performance on the SMRT at 65 dB. In the current study, however, linear regression revealed that the ΔAUC did not significantly predict improvement in SMRT scores with the DCF strategy relative to both the baseline and control clinical measurements at 45 dB (p = 0.58 and p = 0.48, respectively) or 65 dB (p = 0.61 and p = 0.42, respectively).
Temporal modulation detection test
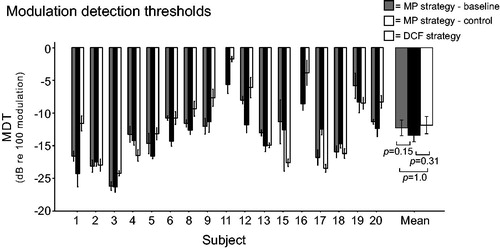
presents the individual and mean MDTs in decibels relative to 100% amplitude modulation. The mean MDTs for the clinical speech coding strategies were −12.30 dB at baseline and −13.45 dB at the control measurement. The mean MDT with the DCF strategy was −11.88 dB. The linear mixed model with the fixed factor “test session” showed that the test session had no significant effect (F(2,14)=2.442, p = 0.122). Linear regression revealed that the ΔAUC could not significantly predict improvement in MDT with the DCF strategy relative to both the baseline (p = 0.2) and control clinical measurements (p = 0.75).
Figure 4. Individual and mean modulation detection thresholds (MDTs) for the 17 study subjects at 65 dB SPL, using their monopolar (MP) clinical strategy (baseline and control measurements) and dynamic current focussing (DCF). Error bars represent ± 1 standard error of the mean.
Speech-in-noise test
The individual and mean SRTs are shown per presentation level in . The mean SRT (45 and 65 dB combined) was 2.42 dB SNR for baseline, −0.21 dB SNR for the control, and 1.36 dB SNR for the DCF strategy. A linear mixed model with the fixed factors “test session”, “presentation level”, and “test session * presentation level” revealed test session had a significant effect (F(2,16)=17.983, p = 0.001). A pairwise comparison showed that only the difference between the baseline and control clinical measurement was significant (Bonferroni-corrected p < 0.001), as the DCF SRT did not significantly differ from the baseline (Bonferroni-corrected p = 0.234) and control measurements (Bonferroni-corrected p = 1.0). As performance was expected to improve at lower loudness levels, the two measured loudness levels were also analysed separately.
Figure 5. Individual and mean speech intelligibility in noise (Dutch Matrix test) with fixed speech at 45 dB SPL (a) and 65 dB SPL (b) for the 17 study subjects using their monopolar (MP) clinical strategy (baseline and control measurement) and dynamic current focussing (DCF). The y-axis is the speech-to-noise ratio for which 50% of the words were repeated correctly. Error bars represent ± 1 standard error of the mean.
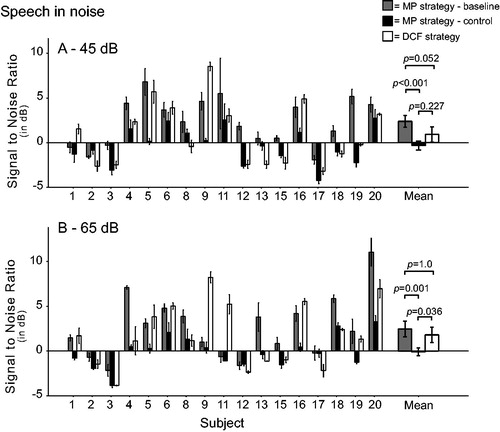
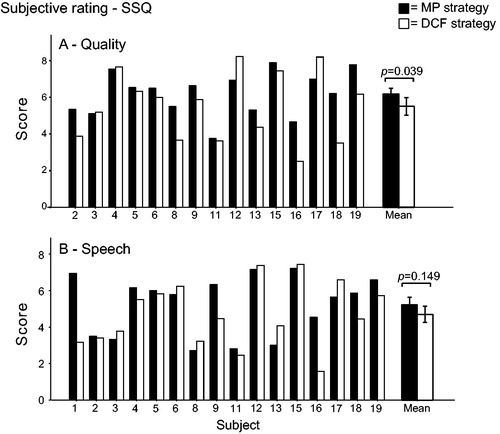
Figure 6. Subjective rating of processing strategies (SSQ) concerning quality of sound (a) and speech understanding under multiple listening conditions (b).
At 45 dB, the linear mixed model with the fixed factors “test session”, “presentation level”, and “test session*presentation level” showed that the mean score was significantly affected by test session (F(2,16)=15.256, p < 0.001). The SNR was improved with the DCF strategy (+0.92 dB SNR) when compared with the baseline measurement (+2.38 dB SNR; Bonferroni-corrected p = 0.052). When DCF was compared with the control clinical measurement (−0.32 dB SNR), the numerical decline in performance was not significant (Bonferroni-corrected p = 0.227). Despite the training sessions, the performance with the clinical strategy showed highly significant improvement from baseline to control testing (Bonferroni-corrected p < 0.001). A two-way repeated measures ANOVA showed no effect for repetition number (F(2,32)=2.03, p = 0.148) or the interaction between test session and repetition number (F(4,64)=0.59, p = 0.674).
At 65 dB, the speech-in-noise results were also significantly influenced by test session (F2,16)=14.656, p < 0.001). The DCF strategy SNR (+1.80 dB) was not significantly different from the baseline clinical measurement (+2.45 dB SNR; Bonferroni-corrected p = 1.0). However, the control clinical measurement (−0.10 dB SNR) was better than the DCF results (Bonferroni-corrected p = 0.036). In addition, at 65 dB there was a highly significant improvement from baseline to control (Bonferroni-corrected p = 0.001). A two-way repeated measures ANOVA revealed there was no effect from repetition number per test session (F(2,32)=2.07, p = 0.115) or the interaction between test session and repetition number (F(4,64)=0.26, p = 0.905). The improvement in speech understanding in noise at 45 dB with the DCF strategy compared with baseline (p = 0.35) and control (p = 0.20) was not predicted by the ΔAUC. However, linear regression analysis showed that ΔAUC could (borderline) significantly predict improvement in speech understanding in noise at 65 dB, with a weak correlation (R2= 0.24, p = 0.045).
This study intended to examine the effect of using the DCF strategy chronically; therefore, an extra analysis was performed where the subjects who did not use the strategy for at least 4 weeks were excluded (Subjects 1 and 16). In this post-hoc analysis of the SMRT data (45 dB and 65 dB combined), the improvement with DCF relative to the baseline measurement lost significance (from p = 0.035 to p = 0.254, both Bonferroni corrected). For the speech-in-noise data, the improvement with the DCF strategy compared with the baseline measurement at 45 dB gained significance (from p = 0.052 to p = 0.013), and the deterioration when compared with the control measurement (at 65 dB) lost significance (from p = 0.036 to p = 0.144). All other comparisons remained the same when Subject 1 and 16 were excluded from the analysis.
Subjective ratings
Subject 1 did not complete the quality section of the SSQ and Subject 20 did not complete the entire questionnaire (). A paired t-test revealed that, on average, the subjective rating of speech did not significantly differ between the clinical (5.2) and DCF (4.7) strategies (t(15) = 1.522, p = 0.149). However, the subjective quality significantly deteriorated from 6.2 to 5.5 (t(14) = 2.279, p = 0.039). Five of the 17 subjects preferred the DCF strategy over the clinical strategy, four had no preference, and eight preferred their regular clinical speech coding strategy. Seven subjects reported a continuous background noise at activation of the DCF strategy. In two of these subjects, the noise disappeared after a few minutes of listening (due to adaptation); whereas, in four subjects, the problem was solved by lowering the current at the T-level. A consequence of lowering the T-level current was that the loudness percept at the M-level also decreased. Therefore, the σ at M-level had to be decreased to maintain equal loudness. Subject 1 kept complaining about the continuous background noise, despite MAP adjustments, and was unable to use the DCF strategy on a daily basis. The eight subjects that asked for an extra fitting session reported that the incoming sound with the DCF strategy was shallow and/or echoing. This relative decrease in sound quality developed over the first few days after the fitting procedure and was easily solved by adjusting the MAPs by increasing the levels on the lower frequency electrodes and decreasing those at high frequency electrodes. Average battery life decreased from 13.4 hours with the clinical strategy to 9.0 hours with the DCF strategy, which is clinically acceptable.
Discussion
The current study evaluated a novel loudness encoding strategy in a 5-week take-home trial with 20 CI users. A recently published pilot study of the DCF strategy (de Jong, Briaire, and Frijns Citation2018) showed there was better performance on the SMRT with DCF, especially at lower loudness levels. Because the SMRT correlates with speech understanding (Holden et al. Citation2016; Lawler, Yu and Aronoff Citation2017; Zhou Citation2017), speech perception in noise was also expected to improve after some adaptation time. As the pilot study revealed a decrease in DCF battery life to 1.5–4 hours, some alterations to the fitting parameters were required to enhance clinical suitability. These energy-saving adjustments helped increase battery life to 9.0 hours on average. When the DCF scores were compared with measurements made at the beginning of the study, a marginally significant improvement was found in both speech intelligibility in noise at lower loudness levels (−1.5 dB SNR, Bonferroni-corrected p = 0.052) and SMRT scores at louder levels (+0.9 RPO, Bonferroni-corrected p = 0.035). However, when comparing the DCF results to the clinical control measurements, a significant deterioration was observed in speech intelligibility in noise at higher loudness levels (+1.9 dB SNR, Bonferroni-corrected p = 0.036), suggesting there was a learning effect. In line with our expectations, no significant differences were found for the MDT results.
Despite the 5-week interval between test sessions and multiple practice sessions on each test day, a learning effect over time was observed for the SMRT (at 45 dB, marginally significant with a nominal p-value of 0.042) and the speech in noise task (at 45 and 65 dB) while using the clinical speech coding strategy. A recent study in our clinic revealed that a learning effect was present for the SMRT when it was repeated every 2 weeks (de Jong, Briaire, and Frijns Citation2017). However, previous research did not find this effect after longer time intervals between tests (Won et al. Citation2007) and we assumed this learning effect fades out after longer time intervals. Yet, it still existed after a 5-week test interval, which complicates the interpretation of our results and signifies the importance of including a control measurement. Notably, repetition number within each test day had a significant effect on the SMRT, suggesting an acute learning effect. This finding is surprising, as multiple practice sessions were performed and such effects were not described previously (Won et al. Citation2007; Drennan et al. Citation2008, Citation2010). There was no interaction between strategies and repetitions on each test day; therefore, performances can be directly compared on different test days.
The learning effect could be caused by the transfer of speech cues over the course of the trial, as described previously (de Jong, Briaire, and Frijns Citation2017). This means that subjects adapted to new speech cues while using the experimental strategy and learned new auditory percepts. This so-called “perceptual learning” may have played a major role during the extra control measurements. Perceptual learning has been extensively studied in the field of vision (Liu and Weinshall Citation2000). In the field of CIs, Irvine (Citation2018) argued that the improvements in speech perception of CI users over the months and years following implantation are a form of perceptual learning. If perceptual learning played a role in this study, the study subjects learned new percepts that they can also use in their everyday life. Thus, participating in clinical trials might be beneficial for CI users, even when the involved experimental strategies have no beneficial effect.
It may be that an actual difference in performance was measured and not a learning effect for subjects who performed better or worse with the DCF strategy than both the baseline and control clinical measurements. Although the current study design does not support statistical analyzes on the individual level, approximately half the subjects improved and one fourth performed worse on the SMRT. In the pilot study, the mean improvement was more striking (+1.34 RPO at 45 dB and +0.8 RPO at 65 dB), but more importantly, only 9% and 18% of the subjects deteriorated at 45 dB and 65 dB, respectively (de Jong, Briaire, and Frijns Citation2018). On the speech-in-noise test at 45 dB, five of the 17 subjects performed better, eight performed the same, and four performed worse with the DCF when compared with both clinical strategy measurements (the measurements made at the beginning and end of the trial); while at 65 dB, five subjects performed better, five the same, and seven worse.
Although these results are below expectations, the current study showed that CI listeners can adapt to the present DCF strategy and that it potentially leads to a beneficial effect on SMRT scores, though smaller than expected based on the pilot study. However, four of the 20 included subjects were unable to adapt to this new speech coding strategy, and this was clear at the fitting session. This indicates it may be easy to detect patients who might not benefit from the DCF strategy. Unfortunately, the possible SMRT advantage did not translate into improved speech perception in noise. This could be because the temporal resolution, measured with the MDT test, deteriorated in half the subjects. These relatively poor MDT results are comparable to those in the pilot study and might be a consequence of using lower pulse rates (58% lower with the DCF strategy on average), which are necessary to achieve sufficient loudness with the DCF strategy. Büchner et al. (Citation2012) showed that Advanced Bionics CI users perform better with higher pulse rates. Among the nine subjects with deteriorated MDT scores in this study, five also had deteriorated speech intelligibility at the same loudness level and only two improved, supporting this hypothesis. On the other hand, some subjects in the current study (e.g., Subject 4) had improved SMRT scores and MDTs, but did not improve or deteriorate in speech understanding at 45 and 65 dB. This was unexpected, as both psychophysical measures are known to correlate independently with speech understanding (Fu Citation2002; Holden et al. Citation2016; Zhou Citation2017; Won et al. Citation2007, Citation2013). The adaptation period of 5 weeks may not have been long enough to completely adjust to the novel strategy, so the final performance was still not reached (Lawler, Yu, and Aronoff Citation2017). This study intended to examine the effect of using the DCF strategy chronically; thus, an extra analysis was performed excluding subjects who did not use the strategy for at least 4 weeks. The exclusion of these subjects minimally improved the speech-in-noise results with the DCF strategy at both loudness levels, but did not drastically change the interpretation of our results.
The comparison of the results from this study with other current focussing strategies is complex because different spectral ripple measures are often used. For example, Smith, Parkinson, and Long (Citation2013) found a 5.7 dB improvement in spectral ripple phase discrimination experiments at 2.0 cycles per octave when weighted TP stimulation was compared with MP stimulation. The effects of using the DCF strategy (measured in RPOs) and the weighted TP strategy are therefore hard to compare.
During the current trial, two subjects complained of continuous background noise, which faded after the strategy was turned on for a few minutes. Interestingly, other subjects stated that the overall loudness level decreased after a few days of using the DCF, resulting in decreased sound quality in certain cases. These subjects had an extra fitting, in which the M-levels were increased, solving the problem. These phenomena imply that neural adaptation occurred that could be a consequence of the below-threshold stimulation inherent to the DCF strategy. Previous studies have shown that continuous high rate stimulation of the auditory nerve leads to different refractory states of the individual nerve fibres (Rubinstein and Hong Citation2003). Though the electrical stimulation of deafened auditory nerves produces highly synchronised responses (Liberman Citation1978), this continuous electrical noise can cause desynchronisation of the responses of the different nerve fibres (Rubinstein and Hong Citation2003; Matsuoka et al. Citation2000). This mimics the spontaneous activity of a healthy auditory nerve and may increase the dynamic range (Hong and Rubinstein, Citation2003). Although the loudness level of the conditioning noise signals used in previous research was above threshold, the high current levels administered right below T-level (with high levels of current focussing) could have resulted in a similar effect. This would explain the shallower loudness growth curve, i.e. the increase in dynamic range, found with the DCF strategy in the current study.
Loudness growth is also influenced by the “interaction component K”, which is a DCF parameter that determines the rate of change for σ depending on the input level of the signal. The studies by Litvak, Spahr, and Emadi (Citation2007) and Arenberg et al. (Citation2018) thoroughly describe this K value. K is based on the degree of interaction between the three involved electrode contacts in DCF stimulation; K = 0 means there is only little interaction and K = 1 indicates the maximum amount of interaction. For the DCF strategy, this means that at high K values loudness growth is achieved by small decreases in σ, and at low K values larger decreases in σ are required to achieve full loudness growth. In the current study, K was assumed to be 1.0 for each electrode contact and subject; although, this does not necessarily correspond to the actual interaction since, for example, K is influenced by electrode-to-tissue distance (Litvak, Spahr, and Emadi Citation2007). It is hypothesised that loudness growth can be disturbed if the assumed K deviates from the actual K. To check this in the current study, K was calculated in six subjects using the following formula derived from Litvak, Spahr, and Emadi (Citation2007):
where TLMP is the number of clinical units (CUs) required to reach T-level in MP mode, and TL0.9 in TP mode when σ = 0.9. The average K was 0.83 (SD = 0.16), which is similar to the results of Arenberg et al. (Citation2018). This discrepancy between assumed K and actual K could have led to different loudness growth curves. It is hypothesised that loudness growth is improved when the assumed and actual K values are equal; thus, K values should be predicted for each individual electrode contact before fitting the DCF strategy.
The current implementation of the DCF strategy, although more energy efficient, has some characteristics that potentially minimised its beneficial effects. The decrease in σ at T-level caused a significant decline in σ at M-level from 0.49 on average in the pilot study to 0.17 in the current trial. A previous study demonstrated that current focussing coefficients below 0.5 resemble MP stimulation (Landsberger, Padilla, and Srinivasan Citation2012), implying that there would be no beneficial effect from DCF around the low coefficients at M-level in the current study. In the pilot study, however, the entire dynamic range was covered with effective current focussing, probably resulting in greater beneficial effects. In line with this theory, the beneficial effects found in this study were mostly present in the tasks at lower loudness levels (45 dB) and, thus, at higher levels of current focussing. The future focus of this strategy will be on the quality of the sound instead of energy efficiency. The DCF MAPs of both the pilot and take-home trial subjects revealed that, if current levels at T-level 400 CU or higher, none of the electrode contacts had a negative σ at M-level, and the average σ at M-level was 0.54 [0.12–0.86]. Therefore, future research should aim for current levels ≥400 CU at T-level for the DCF strategy. This will be achieved by increasing the σ at T-level if current levels are too low.
Moreover, the DCF strategy may only be suitable for a specific group of CI users, particularly subjects who are implanted with a lateral wall electrode array. In this study, most subjects were implanted with a HiFocus Mid-Scala (MS) electrode array, whereas in the pilot study most subjects were implanted with a HiFocus 1 J (lateral wall) electrode array. The HiFocus MS electrode array is designed to enable closer placement to the modiolus compared with the HiFocus 1 J electrode array, requiring less current while achieving more specific stimulation of the auditory nerve (van der Jagt et al. Citation2016). For current focussing techniques, however, a certain distance between the electrodes and auditory neurons is necessary to enable electrical field shaping. In a computational model of the human cochlea, Kalkman, Briaire, and Frijns (Citation2015) predicted that current focussing does not achieve increased spatial selectivity to the same degree for perimodiolar electrodes as it does for lateral wall electrodes. In addition, the close proximity of the electrodes to the auditory neurons can cause neuronal excitation by the non-centre contacts in multipolar stimulation, resulting in so-called side lobes, which can negatively affect performance. This mechanism is expected in the DCF strategy tested here because of the allowance for negative σ values at the M-level, i.e. positively stimulating the non-centre contacts. Nevertheless, no correlation was found between the type of electrode array and performance for any of the tasks (R2 ranged from 0.003 to 0.11). Sufficient data were not collected in the current study to confirm this theory; therefore, the hypothesis should be studied in more detail in a larger cohort.
Conclusion
Most CI users can adapt to the DCF strategy and use it on a daily basis. The strategy has the potential to improve performance on the SMRT test, though the present implementation resulted in insufficient levels of current focussing across the dynamic range. In future DCF research, the aim will be to cover the entire dynamic range with effective levels of current focussing for each electrode contact to increase the advantageous effects of DCF stimulation. Because learning effects in psychophysical measurements are prominent, even after 5-week intervals, a randomised study design is essential for future research utilising these measurements.
Acknowledgements
We would like to thank all the CI patients who participated in these experiments.
Disclosure statement
No potential conflict of interest was reported by the authors.
Additional information
Funding
References
- Advanced Bionics. 2012. “HiResTM Optima Clinical Results.” Advanced Bionics White Paper Sylmar, California 1–2.
- Arenberg, J. G., W. S. Parkinson, L. Litvak, C. Chen, H. A. Kreft., A. J. Oxenham. 2018. “A Dynamically Focusing Cochlear Implant Strategy Can Improve Vowel Identification in Noise.” Ear and Hearing, 39 (6):1136–1145.
- Aronoff, J. M., and D. M. Landsberger. 2013. “The Development of a Modified Spectral Ripple Test.” The Journal of Acoustical Society of America 134 (2):217–222.
- Bierer, J. A. 2007. “Threshold and Channel Interaction in Cochlear Implant Users: Evaluation of the Tripolar Electrode Configuration.” The Journal of Acoustical Society of America 121 (3):1642–1653. doi:10.1121/1.2436712.
- Bierer, J. A. 2010. “Probing the Electrode-Neuron Interface with Focused Cochlear Implant Stimulation.” Trends in Amplification 14 (2):84–95. doi:10.1177/1084713810375249
- Bonham, B. H., and L. M. Litvak. 2008. “Current Focusing and Steering: modeling, Physiology, and Psychophysics.” Hearing Research 242 (1–2):141–153. doi:10.1016/j.heares.2008.03.006.
- Büchner, A., T. Lenarz, P.-P. Boermans, J. H. M. Frijns, P. Mancini, R. Filipo, C. Fielden., et al. 2012. “Benefits of the HiRes 120 Coding Strategy Combined with the Harmony Processor in an Adult European Multicentre Study.” Acta Otolaryngologica 132 (2):179–187. doi:10.3109/00016489.2011.630015.
- de Jong, M. A. M., J. J. Briaire, and J. H. M. Frijns. 2017. “Learning Effects in Psychophysical Tests of Spectral and Temporal Resolution.” Ear and Hearing 39 (3):475–481. doi:10.1097/AUD.0000000000000499.
- de Jong, M. A. M., J. J. Briaire, and J. H. M. Frijns. 2018. “Dynamic Current Focusing: A Novel Approach to Loudness Coding in Cochlear Implants.” Ear and Hearing., epub ahead of print.
- DiNino, M., and J. G. Arenberg. 2018. ‘Age-Related Performance on Vowel Identification and the Spectral-temporally Modulated Ripple Test in Children With Normal Hearing and With Cochlear Implants.’ Trends in Hearing epub ahead of print. doi:10.1177/2331216518770959
- Drennan, W. R., J. K. Longnion, C. Ruffin, and J. T. Rubinstein. 2008. “Discrimination of Schroeder-Phase Harmonic Complexes by Normal-Hearing and Cochlear-Implant Listeners.” Journal of the Association for Research in Otolaryngology 9 (1):138–149. doi:10.1007/s10162-007-0107-6.
- Drennan, W., J. Won, K. Nie, E. Jameyson, and J. T. Rubinstein. 2010. “Sensitivity of Psychophysical Measures to Signal Processor Modifications in Cochlear Implant Users.” Hearing Research 262 (1–2):1–8. doi:10.1016/j.heares.2010.02.003.
- Firszt, J. B. 2003. “HiResolution TM Sound Processing.” Advanced Bionics White Paper Sylmar, California 1–4.
- Firszt, J. B., L. K. Holden, M. W. Skinner, E. A. Tobey, A. Peterson, W. Gaggl, C. L. Runge-Samuelson., et al. 2004. “Recognition of Speech Presented at Soft to Loud Levels by Adult Cochlear Implant Recipients of Three Cochlear Implant Systems.” Ear and Hearing 25 (4):375–387. doi:10.1097/01.AUD.0000134552.22205.EE.
- Francart, T., A. van Wieringen, and J. Wouters. 2008. “APEX 3: A Multi-Purpose Test Platform for Auditory Psychophysical Experiments.” Journal of Neuroscience Methods 172 (2):283–293. doi:10.1016/j.jneumeth.2008.04.020.
- Frijns, J. H. M., D. M. T. Dekker, and J. J. Briaire. 2011. “Neural Excitation Patterns Induced by Phased-Array Stimulation in the Implanted Human Cochlea.” Acta Otolaryngologica 131 (4):362–370. doi:10.3109/00016489.2010.541939.
- Fu, Q. J. 2002. “Temporal Processing and Speech Recognition in Cochlear Implant Users.” Neuroreport 13 (13):1635–1639. doi:10.1097/00001756-200209160-00013.
- Gatehouse, S., and W. Noble. 2004. “The Speech, Spatial and Qualities of Hearing Scale (SSQ).” International Journal of Audiology 43 (2):85–99. doi:10.1080/14992020400050014.
- Holden, L. K., J. B. Firszt, R. M. Reeder, R. M. Uchanski, N. Y. Dwyer, and T. A. Holden. 2016. “Factors Affecting Outcomes in Cochlear Implant Recipients Implanted with a Perimodiolar Electrode Array Located in Scala Tympani.” Otology and Neurotology 37 (10):1662–1668. doi:10.1097/MAO.0000000000001241.
- Hong, R. S., and J. T. Rubinstein. 2003. “High-Rate Conditioning Pulse Trains in Cochlear Implants: dynamic Range Measures with Sinusoidal Stimuli.” The Journal of Acoustical Society of America 114 (6):3327–3342. doi:10.1121/1.1623785.
- Houben, R., J. Koopman, H. Luts, K. C. Wagener, A. van Wieringen, H. Verschuure, W. A. Dreschler., et al. 2014. “Development of a Dutch Matrix Sentence Test to Assess Speech Intelligibility in Noise.” International Journal of Audiology 53 (10):760–763. doi:10.3109/14992027.2014.920111.
- Irvine, D. R. F. 2018. “Auditory Perceptual Learning and Changes in the Conceptualization of Auditory Cortex.” Hearing Research (366):3–16. doi:10.1016/j.heares.2018.03.011.
- Jones, G. L., J. Ho Won, W. R. Drennan, and J. T. Rubinstein. 2013. “Relationship between Channel Interaction and Spectral-Ripple Discrimination in Cochlear Implant Users.” The Journal of Acoustical Society of America 133 (1):425–433. doi:10.1121/1.4768881.
- Kalkman, R. K., J. J. Briaire, and J. H. M. Frijns. 2015. “Current Focussing in Cochlear Implants: An Analysis of Neural Recruitment in a Computational Model.” Hearing and Research 322:89–98. doi:10.1016/j.heares.2014.12.004.
- Kollmeier, B., A. Warzybok, S. Hochmuth, M. A. Zokoll, V. Uslar, T. Brand, and K. C. Wagener. 2015. “The Multilingual Matrix Test: Principles, Applications, and Comparison across Languages: A Review.” International Journal of Audiology 54 (2):3–16. doi:10.3109/14992027.2015.1020971.
- Landsberger, D. M., M. Padilla, and A. G. Srinivasan. 2012. “Reducing Current Spread Using Current Focusing in Cochlear Implant Users.” Hearing Research 284 (1–2):16–24. doi:10.1016/j.heares.2011.12.009.
- Lawler, M., J. Yu, and J. M. Aronoff. 2017. “Comparison of the Spectral-Temporally Modulated Ripple Test with the Arizona Biomedical Institute Sentence Test in Cochlear Implant Users.” Ear and Hearing 38 (6):760–766. doi:10.1097/AUD.0000000000000496.
- Liberman, M. C. 1978. “Auditory-Nerve Response from Cats Raised in a Low-Noise Chamber.” The Journal of the Acoustical Society of America 63 (2):442–455. doi:10.1121/1.381736
- Litvak, L. M., A. J. Spahr, and G. Emadi. 2007. “Loudness Growth Observed under Partially Tripolar Stimulation: model and Data from Cochlear Implant Listeners.” The Journal of Acoustical Society of America 122 (2):967–981. doi:10.1121/1.2749414.
- Liu, Z., and D. Weinshall. 2000. “Mechanisms of Generalization in Perceptual Learning.” Vision Research 40 (1):97–109. doi:10.1016/S0042-6989(99)00140-6
- Matsuoka, A. J., P. J. Abbas, J. T. Rubinstein, and C. A. Miller. 2000. “The Neuronal Response to Electrical Constant-Amplitude Pulse Train Stimulation: Additive Gaussian Noise.” Hearing Research 149 (1–2):129–137. doi:10.1016/S0378-5955(00)00173-8.
- Padilla, M., and D. M. Landsberger. 2016. “Reduction in Spread of Excitation from Current Focusing at Multiple Cochlear Locations in Cochlear Implant Users.” Hearing Research 333:98–107. doi:10.1016/j.heares.2016.01.002.
- Potts, L. G., M. W. Skinner, B. D. Gotter, M. J. Strube, and C. A. Brenner. 2007. “Relation between Neural Response Telemetry Thresholds, T- and C-Levels, and Loudness Judgments in 12 Adult Nucleus 24 Cochlear Implant Recipients.” Ear and Hearing 28 (4):495–511. doi:10.1097/AUD.0b013e31806dc16e.
- Rubinstein, J. T., and R. Hong. 2003. “Signal Coding in Cochlear Implants: exploiting Stochastic Effects of Electrical Stimulation.” Annals of Otology, Rhinology & Laryngology 191:14–19. doi:10.1177/00034894031120S904.
- Shannon, R. V., Q. J. Fu, and J. Galvin. 2004. “The Number of Spectral Channels Required for Speech Recognition Depends on the Difficulty of the Listening Situation.” Acta Otolaryngologica 124 (0):50–54. doi:10.1080/03655230410017562.
- Smith, Z. M., W. S. Parkinson, and C. J. Long. 2013. “Multipolar Current Focusing Increases Spectral Resolution in Cochlear Implants.” Conference Proceedings. Annual International Conference of the IEEE Engineering in Medicine and Biological Society 2013:2796–2799.
- Srinivasan, A. G., D. M. Landsberger, and R. V. Shannon. 2010. “Current Focusing Sharpens Local Peaks of Excitation in Cochlear Implant Stimulation.” Hearing Research 270 (1–2):89–100. doi:10.1016/j.heares.2010.09.004.
- Srinivasan, A. G., M. Padilla, R. V. Shannon, and D. M. Landsberger. 2013. “Improving Speech Perception in Noise with Current Focusing in Cochlear Implant Users.” Hearing Research 299:29–36. doi:10.1016/j.heares.2013.02.004.
- van den Honert, C., and D. C. Kelsall. 2007. “Focused Intracochlear Electric Stimulation with Phased Array Channels.” The Journal of the Acoustical Society of America 121 (6):3703–3716. doi:10.1121/1.2722047.
- van der Jagt, M. A., J. J. Briaire, B. M. Verbist, and J. H. M. Frijns. 2016. “Comparison of the HiFocus Mid-Scala and HiFocus 1J Electrode Array: Angular Insertion Depths and Speech Perception Outcomes.” Audiology and Neurotology 21 (5):316–325. doi:10.1159/000448581.
- Vellinga, D., J. J. Briaire, D. M. van Meenen, and J. H. M. Frijns. 2017a. “Comparison of Multipole Stimulus Configurations with respect to Loudness and Spread of Excitation.” Ear and Hearing 38 (4):487–496. doi:10.1097/AUD.0000000000000416.
- Vellinga, D., S. Bruijn, J. J. Briaire, R. K. Kalkman, and J. H. M. Frijns. 2017b. “Reducing Interaction in Simultaneous Paired Stimulation with CI.” PLoS One 12 (2):1–11.
- Won, J. H., G. L. Jones, W. R. Drennan, E. M. Jameyson, and J. T. Rubinstein. 2013. “Evidence of across-Channel Processing for Spectral-Ripple Discrimination in Cochlear Implant Listeners.” The Journal of Acoustical Society of America 130 (4):2088–2097. doi:10.1121/1.3624820.
- Won, J. H., W. R. Drennan, and J. T. Rubinstein. 2007. “Spectral-Ripple Resolution Correlates with Speech Reception in Noise in Cochlear Implant Users.” Journal of the Association for Research in Otolaryngology 8 (3):384–392. doi:10.1007/s10162-007-0085-8.
- Won, J. H., W. R. Drennan, K. Nie, E. M. Jameyson, and J. T. Rubinstein. 2011. “Acoustic Temporal Modulation Detection and Speech Perception in Cochlear Implant Listeners.” The Journal of. Acoustical Society of America 130 (1):376–388. doi:10.1121/1.3592521.
- Zhou, N. 2017. “Deactivating Stimulation Sites Based on Low-Rate Thresholds Improves Spectral Ripple and Speech Reception Thresholds in Cochlear Implant Users.” The Journal of Acoustical Society of America 141 (3):243–248.
- Zhu, Z.,. Q. Tang, F.-G. Zeng, T. Guan, and D. Ye. 2012. “Cochlear-Implant Spatial Selectivity with Monopolar, Bipolar and Tripolar Stimulation.” Hearing Research 283 (1–2):45–58. doi:10.1016/j.heares.2011.11.005.