
 ?Mathematical formulae have been encoded as MathML and are displayed in this HTML version using MathJax in order to improve their display. Uncheck the box to turn MathJax off. This feature requires Javascript. Click on a formula to zoom.
Abstract
Objective
To estimate the equivalent threshold sound pressure levels (ETSPLs) for nine stimuli used today and in the future for universal newborn hearing screening and diagnostics delivered by the Interacoustics SnapPROBE™.
Design
The Click and eight variants of the CE-Chirp® were included to establish ETSPLs when delivered by the SnapPROBE™. The short duration stimuli were presented at a 20/s repetition rate for about 1–2 s following the international standards for establishing ETSPLs.
Study sample
50 ears from a total of 27 normal hearing young adult subjects (female/male = 16/11; age = 21–25 years, mean age = 23.1 years).
Results
Peak-to-peak equivalent signal levels and root mean square signal levels (at 20/s repetition rate) for the nine stimuli are stated.
Conclusions
The ETSPLs are in alignment overall with those found in previous studies, while some levels are about 2–6 dB higher for this study compared to the Interacoustics Titan IOW probe and the ER-3A insert earphone. The results are relevant for present and future universal newborn hearing screening and diagnostics carried out with the SnapPROBE™ to ensure that correct stimulation levels are applied.
Introduction
Universal newborn hearing screening (UNHS) programs are today implemented around the world to identify the approximately 1 out of 1000 infants born with a permanent hearing loss (Fortnum Citation2003; Fortnum et al. Citation2001; Sininger, Grimes, and Christensen Citation2010; Watkin and Baldwin Citation2012; Wood, Sutton, and Davis Citation2015; World Health Organization Citation2010). In UNHS it is widely agreed to utilise otoacoustic emissions (OAEs) and automatic auditory brainstem response (AABR) (Wood, Sutton, and Davis Citation2015; World Health Organization Citation2010). One important element when carrying out these measurements is the probe that goes into the infant’s ear canal. It has been observed in clinics how current probes can be difficult to fit in small ear canals and, furthermore, it is time consuming to clean the current types of probes. An optimal probe must be practical to handle (that is, small, lightweight, easy and fast to clean, and provide an uncomplicated fit) as well as providing valid and reliable measurements.
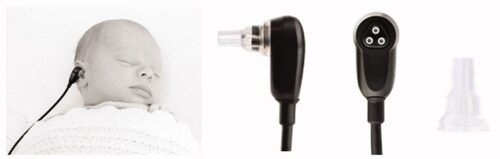
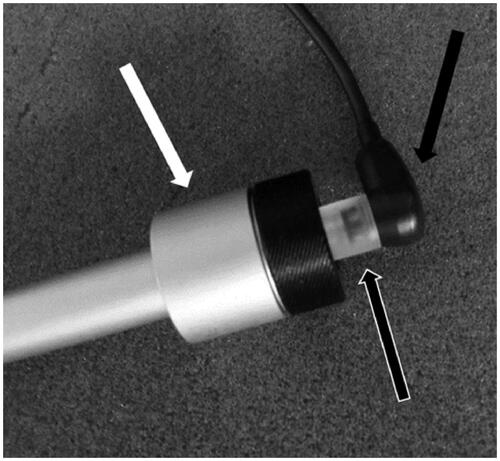
A probe that is designed to meet these needs is the small SnapPROBE™ which is lightweight and has a smooth surface, making cleaning easy. The SnapPROBE™ is designed for newborn hearing screening to 1) provide a better fit and seal in infant ear canals compared to existing probes and 2) be more resilient to ear wax/fetal fat by having designated ear tips (the clear plastic part in , right) that are designed to catch ear wax and other foreign objects. An additional safeguard is found in the disposable filters in the probe head, catching any ear wax that may get past the ear tips against the odds. In combination, this reduces the probe’s exposure to debris and thus limits the need for cleaning.
Figure 1. SnapPROBE™ inserted into an infant ear and close-ups, with and without the ear tip attached. Pictures from Interacoustics A/S.
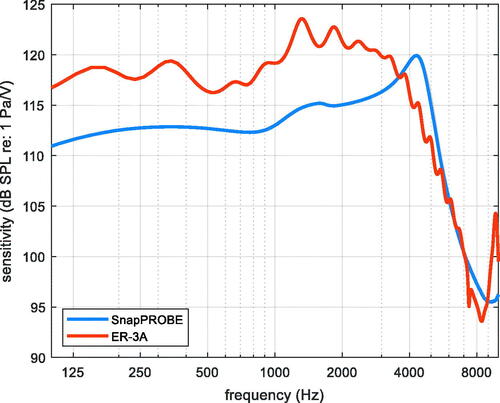
The frequency response for the SnapPROBE™ is presented in (together with that of the ER-3A insert earphone, for reference, see discussion). Both were measured in an ear simulator (711 coupler) using a repeated click stimulus. To ensure that correct stimuli levels are delivered into the infant’s ear canal and thus ensure validity of the recordings, it is important to calibrate the equipment according to the new probe. Traditionally, peak-to-peak equivalent signal levels are used as calibration values, but recently also root mean square (RMS) signal levels have been described (Elberling and Esmann Citation2017) and standardised (IEC 60645-3 Citation2020). The physical threshold values are subsequently used to define the stimulus-specific 0 dB nHL (Picton et al. Citation1977). The purpose of this study is to estimate the equivalent threshold sound pressure levels (ETSPLs) for nine stimuli used today and potentially in the future for UNHS and diagnostics, as delivered by the SnapPROBE™. The stimuli included are the Click and eight variants of the CE-Chirp®, specifically the full-bandwidth CE-Chirp®, NB500 CE-Chirp®, NB1000 CE-Chirp®, NB2000 CE-Chirp®, NB4000 CE-Chirp®, Low-frequency CE-Chirp®, Mid-frequency CE-Chirp® and High-frequency CE-Chirp® (Elberling, Cebulla, et al. Citation2007; Elberling, Don, et al. Citation2007; Elberling and Don Citation2008, Citation2010). The stimuli are described further in the methods section.
Figure 2. Frequency response of the SnapPROBE™ and an ER-3A insert earphone.
The methodology applied in this study is in line with that used in other studies showing psychoacoustic data for short duration stimuli for the purpose of calibration (Davis et al. Citation1984; Fedtke and Richter Citation2007; Gøtsche-Rasmussen, Poulsen, and Elberling Citation2012; Poulsen and Legarth Citation2008; Richter and Fedtke Citation2005; Stapells, Picton, and Smith Citation1982) and with the ISO standard (ISO 389-66, Citation2007).
Methods
Subjects
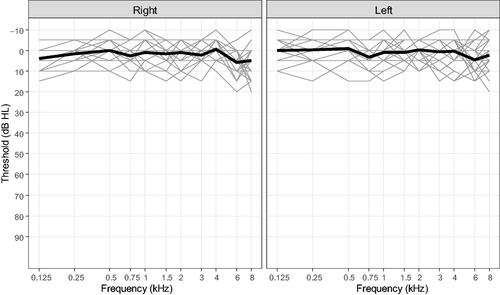
A total of 27 subjects (females/males = 16/11) participated in the study contributing with measurements from 50 (25 left and 25 right) ears, as four ears were excluded due to ear wax. The age criterion for participation was 18–25 years on the day of testing. The final age-range for the participating subjects was 21–25 years (mean age = 23.1 years, SD = 1.2). Another inclusion criterion was to have normal hearing and to be otologically normal, which was based on; a) otoscopy, b) tympanometry with a compliance peak within ± 50 daPa of ambient pressure, c) the Annexe A (normative) questionnaire for hearing tests (ISO 389-9, Citation2009), and d) pure tone air-conduction audiogram measured at 125, 250, 500, 750, 1000, 1500, 2000, 3000, 4000, 6000 and 8000 Hz with 35 dB hearing level (HL) as the maximum accepted HL to participate in the study (however, no subject had a dB HL measured at any frequency above 20 dB HL), see for pure tone audiograms.
Figure 3. Pure-tone audiograms for 50 (25 left and 25 right) ears measured with a RadioEar DD45 headset. Thick line illustrates the mean.
Equipment
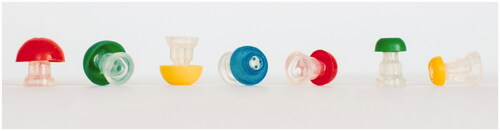
The pure tone audiograms were measured with an Interacoustics Affinity 2.0 and a RadioEar DD45 headset, while an Interacoustics Titan was used for the tympanometry. The same Affinity 2.0 was used for the threshold measurements with the SnapPROBE™ (), to which adult ear tips were custom-made by gluing together SnapPROBE™ tips (the clear component in ) and the top part of Titan IOW probe ear tips (the coloured parts in ).
Figure 4. SnapPROBE™ ear tips modified with coloured “mushroom” parts for the purpose of fitting the infant ear tips to the adult test subjects in the study.
Stimuli
A total of nine stimuli were applied for the threshold measurements with the SnapPROBE™. The nine stimuli were carefully selected to include some of the most common stimuli used in UNHS and in addition, variants of the CE-Chirp® that have potential to be applied more in the future. All stimuli were initially recorded in a 711 coupler with the results shown in . The SnapPROBE™ was attached to the 711 coupler, as described below and shown in .
Figure 5. Illustrations based on acoustic measurements in a 711 coupler of all stimuli used, as indicated in each left-hand panel. All stimuli were scaled to produce the same spectrum level within their respective bandwidth. Left: waveforms. Right: magnitude spectrum shown for a 60-dB range.
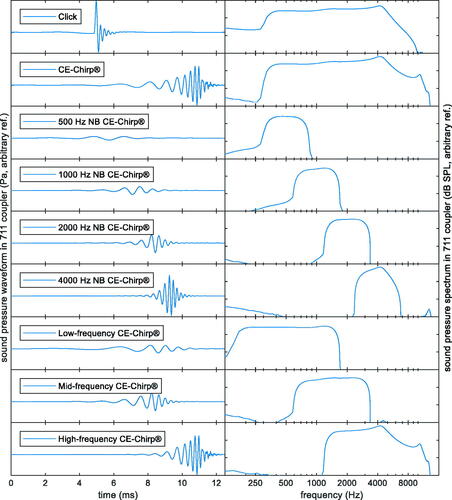
Figure 6. The ear simulator (711 coupler) (white arrow) with the SnapPROBE™ (black arrow) attached using the custom-made adaptor (black and white arrow).
The specific click stimulus (Serpanos, O'Malley, and Gravel Citation1997; Stapells, Picton, and Smith Citation1982) considered in this study is the so-called ‘optimised’ Click (Elberling and Don Citation2008, fig. 8), where the optimised Click is characterised by having the frequency components above the first spectral null at 10 kHz removed, see also below. In general, however, chirp stimuli have been shown to elicit higher amplitudes in ABR recordings (Dau et al. Citation2000). Specifically, the CE-Chirp® is a broadband level-independent stimulus developed to increase the temporal synchrony of neural excitation in the cochlea by taking into account the cochlear travelling wave delay (Elberling, Don, et al. Citation2007; Elberling and Don Citation2010). Further, the octave-wide narrow band (NB) CE-Chirp® stimuli with centre frequencies of 500, 1000, 2000, and 4000 Hz, respectively, are described in Elberling and Don (Citation2010). Lastly, the Low-frequency (180–1500 Hz, −3 dB cut-off frequencies specified), Mid-frequency (707–2828 Hz) and High-frequency (1500–8000 Hz) CE-Chirp® stimuli are variants of the CE-Chirp® which have the potential to be applied more in the future, as they provide more frequency-specific hearing screening than the broadband CE-Chirp®, while offering faster detection of responses than the NB CE-Chirps® due to their wider bandwidth of stimulation. The Mid-frequency CE-Chirp® was constructed specifically for this study due to its potential for screening in the frequency range most important for speech intelligibility (ANSI S3.5, Citation1997). These three stimuli are constructed using the cochlear delay model in a similar way as the NB CE-Chirp® stimuli (Elberling and Don Citation2010). A specific description of the Low- and High-frequency CE-Chirp® stimuli is given by Elberling, Cebulla et al. (Citation2007).
Design
The nine stimuli were presented in a cyclic order with the starting stimulus for each ear advanced by one relative to the previous ear. The Speech module in the Affinity 2.0 was used to present the grouped stimulus (20/s) to the subjects. Each stimulus was presented manually for about 1–2 s with alternating polarity to which the test subject pressed a response button when the stimulus was heard. The standard procedure for measuring hearing thresholds was applied with the shortened version of the ascending method (two out three responses) with a step size of 5 dB, as described in ISO 8253-1 (Citation2010). The same method was used for defining the pure tone air-conduction thresholds, after which the test subject was given a short break before continuing with the SnapPROBE™ measurements. During all measurements the test subject was positioned in a chair in a single-walled soundproof booth that met maximum permissible background noise as stated in (ISO 8253-1 Citation2010; ISO 8253-3 Citation2012). A window allowed the audiologist to observe whether the SnapPROBE™ moved. If so, the measurements were paused, and the SnapPROBE™ was reinserted. A test session lasted between one hour and one hour and 30 min and subjects were compensated with gift cards worth 200 DKK. In agreement with ISO 389-9 (Citation2009), the threshold used for each stimulus was the median value across the 50 ears tested.
The study was approved by the ethical committee of the capital region of Denmark (reference H-1-2013-138).
Determination of peak-to-peak equivalent signal level
The SnapPROBE™ was attached to a Brüel & Kjær ear simulator (711 coupler) with a custom-made adaptor, as shown in . The ear simulator was connected to a Brüel & Kjær measuring amplifier type 2636 (linear frequency weighting (dBZ) and bandpass filtering from 22.4 to 22400 Hz was applied), the output of which was routed to an RME Fireface UC soundcard running at a 48-kHz sampling rate. The soundcard was finally connected to a laptop PC running custom Matlab software for recording and analysis.
First, a Brüel & Kjær 4320 calibrator was attached to the ear simulator with a DB 2015 adaptor mounted on the ear simulator. The nominal sound pressure level for this coupling is 98.9 dB SPL, with the specific 94.2-dB SPL calibrator used, according to the Brüel & Kjær 4231 sound calibrator manual and Gøtsche-Rasmussen, Poulsen, and Elberling (Citation2012). Gain settings for the soundcard and the measurement amplifier were adjusted to reach close to maximal input level on the soundcard, and the calibration signal was then recorded and stored.
For the measurements of the stimuli, all stimuli were presented at a 90-dB dial setting to avoid noise-floor issues. The additional gain relative to the stimulus-respective dial setting determined from the threshold experiment was noted for each stimulus and later subtracted when determining the peak-to-peak equivalent sound pressure level (p-p.e.SPL) corresponding to threshold. The assumed linearity of the Affinity 2.0 was checked separately, see below.
Stimulus measurements
Each stimulus was originally created as a 1-s-long train of the respective short stimulus, repeated at a rate of 20/s; as specified in ISO 389-9 (Citation2009). For each measurement, a few of these stimulus trains were recorded, and a single train then manually selected according to criteria of minimum background noise and absence of other artefacts.
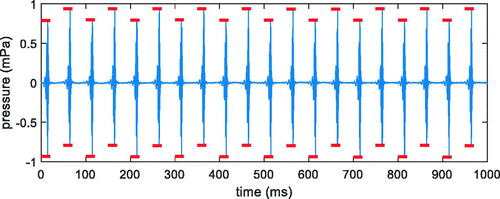
Using the calibration measurement, the recorded wav file was scaled to represent sound pressure in Pascal. Then, the maximum and minimum sound pressure for each short stimulus was determined to yield 20 individual estimates of the peak-to-peak sound pressure, see for an example. In this way, the procedure was able to handle stimulus trains with alternating polarity, as seen in . The variability across these 20 estimates was assessed; the variation was typically within ±0.1 dB. The final result was the median value among the 20 estimates, which was then finally converted into the p-p.e.SPL:
(1)
(1)
Figure 7. Example of sound-pressure waveform (blue line) of a stimulus train, with individually determined maximum and minimum peak sound pressures (bold red lines). The example is the Low-frequency CE-Chirp®.
Because calibration in terms of RMS signal level is becoming an established alternative to peak-to-peak equivalent signal level, the RMS signal levels were also computed, specific to the 20/s repetition rate used, as per (IEC 60645-3, Citation2020).
Linearity check
The Click stimulus was recorded at dial settings of 90, 80, 70, and 60 dB, and the threshold p-p.e.SPL was estimated from each recording as described above. The results were 37.3, 37.4, 37.3, and 37.6 dB, respectively. The deviation observed at the 60-dB dial setting is likely due to the effect of background noise which was becoming clearly visible in the recorded waveform. Otherwise, linearity appears to be satisfactory.
Results
The main results found as described above are summarised in as RMS signal levels as well as p-p.e.SPL values. In addition, the threshold data were subjected to a general linear model ANOVA with Stimulus, Test ear, and Sex as fixed effects. No higher-order model terms were included as there were no hypotheses about effect interactions. Significant effects were observed of Stimulus F(8,439) = 22, p < 0.0001 and Sex F(1,439) = 31, p < 0.0001, whereas no effect of Test ear was found F(1,439) = 2, p = 0.15. The effect of Sex was a mean difference in thresholds of 2.5 dB (thresholds were higher for the females), which is probably a coincidental consequence of the population sample and in any case hardly clinically important given the 5-dB step size typically used for threshold estimation. SDs across the individual Stimulus mean thresholds were computed and ranged between 4.3 and 5.4 dB, thus not indicating any significant differences in variance across stimuli. Hence, a single common SD of 4.6 dB is reported, found as the RMS residual error of the general linear model described above.
Table 1. ETSPL values for the specified stimuli presented through the SnapPROBE™, in terms of p-p.e.SPL and RMS signal levels and compared to ETSPL values (in terms of p-p.e.SPL) among different probes.
The SnapPROBE™ p-p.e.SPL values are furthermore compared to values from the Titan IOW probe (Interacoustics A/S Citation2020, p. 98) and the ER-3A insert earphone (Elberling and Esmann Citation2017), in both cases measured with an ear simulator (711 coupler) (IEC 60318-4, Citation2010) as in the present study. It was chosen to compare the values to the Titan IOW probe and the ER-3A insert earphone, as these probes carry some similarities to the SnapPROBE™ in terms of purpose, size, acoustic qualities etc. As seen in , the SnapPROBE™ ETSPL (p-p.e.SPL) values are greater (between 1.9 dB and 6.1 dB) in all cases except for the NB4000 CE-Chirp®, where the SnapPROBE™ ETSPL (p-p.e.SPL) is 1.6 dB smaller than that measured for the ER-3A insert earphone.
Discussion
ISO 389-9 (Citation2009, p. 5) describes that ETSPL values should be determined for groups of stimuli as well as single stimuli. However, single stimuli are not used clinically, and furthermore, in ISO 389-66 (Citation2007) the threshold levels are only reported as levels for groups of stimuli. Therefore, it was decided to measure each stimulus solely as a group of stimuli with a repetition rate of 20/s.
As a general comment, the SnapPROBE™ was designed to be used with the small ear canals of infants and thus not for the bigger ear canals of adults. However, for practical and ethical reasons, and according to ISO 389-9 (Citation2009), the present study was carried out with adult test subjects who used the modified ear tips described in the methods section. Thus, the SnapPROBE™ was with all probability delivering its output into a greater volume relative to when the SnapPROBE™ was connected to the ear simulator with the custom-made adaptor (). This would lead to a relatively higher sound pressure in the ear simulator and thus explain the higher ETSPL values found for the SnapPROBE™ relative to the Titan IOW probe, which for the respective ETSPL measurements was coupled to the ear simulator using an artificial ear canal and a suitable (adult) ear tip, likely creating additional volume in front of the ear simulator’s reference plane. The deviant pattern for the high-frequency-specific NB4000 CE-Chirp®, with lower ETSPL for the SnapPROBE™ remains unexplained. In any case, the deviations seen in are in the range of one 5 dB step used for the threshold determination.
As described in the Methods section, the click included for this study is the so-called optimised Click (Elberling and Don Citation2008, fig. 8). The same Click was used for the Titan IOW probe ETSPL measurements, whereas the click included in the ER-3A measurements (Elberling and Esmann Citation2017) was the standard version of the click (100 µs rectangular pulse). The difference between the two versions of the click concerns the frequency components above 10 kHz that were removed from the optimised Click. This difference is of no concern for the present study as the frequency responses of the SnapPROBE™ and the ER-3A insert phone have a pronounced roll-offs above 4.3 and 3.5 kHz, respectively, see .
It should be considered for future studies to make a replicate study with the purpose to achieve Reference Equivalent Threshold Sound Pressure Level (RETSPL) values from the current ETSPL values for Click and CE Chirp® stimuli, as delivered by the SnapPROBE™. Similarly, further studies into the effect on ETSPL values of variations in presentation rate are recommended. Data are already available for clicks, the broadband CE-Chirp®, and NB CE-Chirps®, see (Elberling and Esmann Citation2017) for a review, but more work is needed.
Conclusions
Hearing thresholds were measured from 50 normal-hearing ears from young adult test subjects to establish equivalent threshold sound pressure levels (ETSPLs) for Click and CE-Chirp® stimuli delivered by the SnapPROBE™. The peak-to-peak equivalent signal levels and RMS signal levels (at 20/s) values are presented in . The levels are in alignment overall with previous studies. The results are relevant for present and future universal newborn hearing screening and diagnostics applications of the SnapPROBE™.
| Abbreviations | ||
| AABR | = | automatic auditory brainstem response; ETSPL: equivalent threshold sound pressure level; HL: hearing level; NB: narrow band; OAE: otoacoustic emission; p-p.e.SPL: peak-to-peak equivalent sound pressure level; RMS: root mean square; SD: standard deviation; UNHS: universal newborn hearing screening |
Acknowledgement
The authors would like to thank Claus Elberling for advice regarding single versus grouped stimuli and Kren M. Nørgaard for coupler measurements, editorial comments, and discussions on differences among probes. The 27 test subjects are acknowledged for their contribution to the study under the challenges of Covid-19 restrictions and precautions.
Disclosure statement
No potential conflict of interest was reported by the author(s).
References
- ANSI S3.5. 1997. Methods for Calculation of the Speech Intelligibility Index. New York, NY: American National Standards Institute.
- Dau, T., O. Wegner, V. Mellert, and B. Kollmeier. 2000. “Auditory Brainstem Responses with Optimized Chirp Signals Compensating Basilar-Membrane Dispersion.” The Journal of the Acoustical Society of America 107 (3): 1530–1540. doi:https://doi.org/10.1121/1.428438.
- Davis, H., S. K. Hirsh, G. R. Popelka, and C. Formby. 1984. “Frequency Selectivity and Thresholds of Brief Stimuli Suitable for Electric Response Audiometry.” Audiology: Official Organ of the International Society of Audiology 23 (1): 59–74. doi:https://doi.org/10.3109/00206098409072822.
- Elberling, C., M. Cebulla, and E. Stürzebecher. 2007. “Simultaneous Multiple Stimulation of the ASSR.” 1st International Symposium on Auditory and Audiological Research (ISAAR): Auditory Signal Processing in Hearing-Impaired Listeners, edited by T. Dau, J. M. Buchholz, J. M. Harte, T. U. Christensen, 201–209. Centertryk A/S, Denmark.
- Elberling, C., and M. Don. 2008. “Auditory Brainstem Responses to a Chirp Stimulus Designed from Derived-Band Latencies in Normal-Hearing Subjects.” The Journal of the Acoustical Society of America 124 (5): 3022–3037. doi:https://doi.org/10.1121/1.2990709.
- Elberling, C., and M. Don. 2010. “A Direct Approach for the Design of Chirp Stimuli Used for the Recording of Auditory Brainstem Responses.” The Journal of the Acoustical Society of America 128 (5): 2955–2964. doi:https://doi.org/10.1121/1.3489111.
- Elberling, C., M. Don, M. Cebulla, and E. Stürzebecher. 2007. “Auditory Steady-State Responses to Chirp Stimuli Based on Cochlear Traveling Wave Delay.” The Journal of the Acoustical Society of America 122 (5): 2772–2785. doi:https://doi.org/10.1121/1.2783985.
- Elberling, C., and L. C. Esmann. 2017. “Calibration of Brief Stimuli for the Recording of Evoked Responses from the Human Auditory Pathway.” The Journal of the Acoustical Society of America 141 (1): 466–474. doi:https://doi.org/10.1121/1.4974145.
- Fedtke, T., and U. Richter. 2007. “Reference Zero for the Calibration of Air-Conduction Audiometric Equipment Using 'Tone Bursts' as Test Signals”. International Journal of Audiology 46 (1): 1–10. doi:https://doi.org/10.1080/14992020601050361.
- Fortnum, H. 2003. “Epidemiology of Permanent Childhood Hearing Impairment: Implications for Neonatal Hearing Screening.” Audiological Medicine 1 (3): 155–164. doi:https://doi.org/10.1080/16513860310001997.
- Fortnum, H. M., A. Q. Summerfield, D. H. Marshall, A. C. Davis, J. M. Bamford, A. Davis, C. Yoshinaga-Itano, and S. Hind. 2001. “Prevalence of Permanent Childhood Hearing Impairment in the United Kingdom and Implications for Universal Neonatal Hearing Screening: Questionnaire Based Ascertainment Study.” BMJ (Clinical Research ed.) 323 (7312): 536–536. doi:https://doi.org/10.1136/bmj.323.7312.536.
- Gøtsche-Rasmussen, K., T. Poulsen, and C. Elberling. 2012. “Reference Hearing Threshold Levels for Chirp Signals Delivered by an ER-3A Insert Earphone.” International Journal of Audiology 51 (11): 794–799. doi:https://doi.org/10.3109/14992027.2012.705901.
- IEC 60318-4. 2010. Electroacoustics – Simulators of Human Head and Ear – part 4: Occluded-Ear Simulator for the Measurement of Earphones Coupled to the Ear by Means of Ear Inserts. Charlottenlund, Denmark: IEC International Standard.
- IEC 60645-3. 2020. Electroacoustics—Audiometric Equipment—Part 3: Test Signals of Short Duration. Geneva, Switzerland: IEC International Standard.
- Interacoustics A/S. 2020. Instructions for use Titan. www.interacoustics.com/tympanometry/clinical-diagnostic/titan
- ISO 389-6. 2007. Acoustics—Reference Zero for the Calibration of Audiometric Equipment—Part 6: Reference Threshold of Hearing for Test Signals of Short Duration. Geneva, Switzerland: ISO European Standard.
- ISO 389-9. 2009. Acoustics—Reference Zero for the Calibration of Audiometric Equipment—Part 9: Preferred Test Conditions for the Determination of Reference Hearing Threshold Levels. Geneva, Switzerland: ISO European Standard.
- ISO 8253-1. 2010. Acoustics—Audiometric Test Methods—Part 1: Pure Tone Air and Bone Conduction Audiometry. Geneva, Switzerland: ISO European Standard.
- ISO 8253-3. 2012. Acoustics Audiometric Test Methods—Part 3: Speech Audiometry. Geneva, Switzerland: ISO European Standard.
- Picton, T. W., D. L. Woods, J. Baribeau-Braun, and T. M. Healy. 1977. “Evoked Potential Audiometry.” J Otolaryngol 6 (2): 90–119.
- Poulsen, T., and S. V. Legarth. 2008. “Reference Hearing Threshold Levels for Short Duration Signals.” International Journal of Audiology 47 (10): 665–674. doi:https://doi.org/10.1080/14992020802203330.
- Richter, U., and T. Fedtke. 2005. “Reference Zero for the Calibration of Audiometric Equipment Using 'Clicks' as Test Signals.” International Journal of Audiology 44 (8): 478–487. doi:https://doi.org/10.1080/14992020500060230.
- Serpanos, Y. C., H. O'Malley, and J. S. Gravel. 1997. “The Relationship between Loudness Intensity Functions and the Click-ABR Wave V Latency.” Ear and Hearing 18 (5): 409–419. doi:https://doi.org/10.1097/00003446-199710000-00006.
- Sininger, Y. S., A. Grimes, and E. Christensen. 2010. “Auditory Development in Early Amplified Children: Factors Influencing Auditory-Based Communication Outcomes in Children with Hearing Loss.” Ear and Hearing 31 (2): 166–185. doi:https://doi.org/10.1097/AUD.0b013e3181c8e7b6.
- Stapells, D. R., T. W. Picton, and A. D. Smith. 1982. “Normal Hearing Thresholds for Clicks.” The Journal of the Acoustical Society of America 72 (1): 74–79. doi:https://doi.org/10.1121/1.388026.
- Watkin, P., and M. Baldwin. 2012. “The Longitudinal Follow up of a Universal Neonatal Hearing Screen: The Implications for Confirming Deafness in Childhood.” International Journal of Audiology 51 (7): 519–528. doi:https://doi.org/10.3109/14992027.2012.673237.
- Wood, S. A., G. J. Sutton, and A. C. Davis. 2015. “Performance and Characteristics of the Newborn Hearing Screening Programme in England: The First Seven Years.” International Journal of Audiology 54 (6): 353–358. doi:https://doi.org/10.3109/14992027.2014.989548.
- World Health Organization. 2010. Newborn and Infant Hearing Screening, Geneva, Switzerland.