
ABSTRACT
Understanding mountain climates poses many challenges, because difficult terrain leads to a sparsity of weather stations and therefore poor data availability, meaning the detailed information required to understand these complex systems is lacking. Here, we analyze eleven years of half-hourly climate observations from the Joint International Laboratory LMI-TREMA (Télédétection et Ressources en Eau en Méditerranée semi-Aride) network of weather stations in the Marrakech High Atlas, Morocco, providing detailed information about the climate in this area. Our analysis shows the mean annual near-surface temperature lapse rate is −4.63°C km−1, with an uncertainty range of −4.39 to −4.85°C km−1, lower than the standard environmental temperature lapse rate. Mean temperature lapse rates vary from −3.67°C to −5.21°C km−1 monthly, and throughout the day from −2.75°C to −7.1°C km−1, which has important implications for understanding snowpack variations at the highest elevations. Understanding precipitation is inherently complex, but our analysis shows that mean annual precipitation increases by 166 mm km−1 (150.6 to 183.7 mm km−1) with a significant snow component at the highest elevations. This analysis improves our understanding of the mountain climate system with new regional temperate lapse rates and precipitation gradients, having the potential to improve gridded climatologies and climate models, with relevance for the wider High Atlas region.
Introduction
Mountain climates are complex systems, highly variable spatially and temporally, due to complex terrain (Barry Citation1992). Although the understanding of mountain climate systems is improving, it remains limited compared to other areas because observation stations tend to be sparse, with incomplete short-term records (Legates and Willmott Citation1990; Barry Citation1992). Some mountain systems have been observed since the eighteenth and nineteenth centuries (Coulter Citation1967; Barry Citation1978); however, for many areas, the coverage remains poor or has decreased since the mid-twentieth century (Eklund et al. Citation2016; Nicholson, Funk, and Fink Citation2018). The change in temperature with elevation is known as the temperature lapse rate. Typically, temperature will decrease with elevation, but inversions where there is an increase in temperature with elevation are also possible. For lapse rates, it is important to distinguish between the free air lapse rate (temperatures in the free atmosphere) and the near-surface lapse rate (temperatures near to the surface), because the latter can be highly variable spatially and temporally (Pepin and Losleben Citation2002; Blandford et al. Citation2008; Kattel et al. Citation2015). The change in precipitation with elevation is known as a precipitation gradient. Typically, precipitation will increase with elevation due to the orographic effect (Daly, Neilson, and Phillips Citation1994), but inversions where there is a decrease with elevation are also possible. Determining temperature lapse rates and precipitation gradients in mountain areas is crucial for understanding high mountain climates.
The sparsity of meteorological observations in mountain areas is a long-standing issue around the world and one that undermines global and regional gridded climatologies (Fiddes and Gruber Citation2014), which are often relied upon to understand climate in these areas. Temperature can be estimated using the standard environmental lapse rate (ELR) of −6.5°C km−1 (Brunt Citation1933; Stone and Carlson Citation1979; Barry and Chorley Citation2009). However, because near-surface lapse rates (NSLRs) can be influenced by the complex topography of mountain systems, as well as climatic factors such as solar radiation, diurnal temperature, wind, and humidity (Pepin and Losleben Citation2002; Rolland Citation2003; Blandford et al. Citation2008; Pepin and Lundquist Citation2008; Minder, Mote, and Lundquist Citation2010; Li et al. Citation2013; Kattel et al. Citation2015), detailed characterization of regional NSLRs can support a much greater understanding of local climates (Blandford et al. Citation2008). In contrast, free air lapse rates are less influenced by these topographic and climatic effects (Pepin and Seidel Citation2005). Mountain precipitation is notoriously difficult to ascertain because observations are scarce (Wortmann et al. Citation2018) and rainfall events can be highly localized and episodic. Accurately measuring snowfall and snow cover is also challenging in mountain environments (Dozier, Bair, and Davis Citation2016; Gugerli et al. Citation2021), which further compounds the difficulty in accurately monitoring precipitation.
The High Atlas is a mountain range in Northwest Africa, forming the largest part of the Atlas Mountain chain that stretches across Morocco and Algeria. The High Atlas is a vital water tower supplying water resources to the neighboring arid plains (Marchane et al. Citation2017) for use in agriculture and for major urban areas such as Marrakech (Hughes et al. Citation2020). Snowmelt from the mountains is thought to supply at least 25 percent of river discharge in the northern flanks of the Marrakech High Atlas and as much as 51 percent in some valleys, such as the Ourika valley (Boudhar et al. Citation2009; N’da et al. Citation2016). This water tower role is of high significance more widely in the drought-prone Mediterranean region (Viviroli et al. Citation2007) and in the context of global warming (Rangwala and Miller Citation2012; Immerzeel et al. Citation2020); thus, understanding of the water supply from precipitation is crucial. For these reasons, insights from new and recently established climate monitoring networks have a critical role to play in improving the understanding of climate dynamics in mountain regions (Pepin et al. Citation2015).
In Morocco, major weather stations are found in large cities in the lowlands, but until recently few climate observation stations were present in the mountains, largely due to very difficult terrain and poor access (Simonneaux et al. Citation2008). Consequently, the Marrakech High Atlas climate was poorly documented or understood at local to regional scales. However, since 2003 a network of automatic weather stations has been established in the Tensift and Rheraya watersheds, south of Marrakech, by the Joint International Laboratory LMI-TREMA (Télédétection et Ressources en Eau en Méditerranée semi-Aride) at Cadi Ayyad University (Jarlan et al. Citation2015). This network of stations now allows detailed monitoring of weather conditions in the region and underpins the climate analysis in this study.
The TREMA network has improved the understanding of climatological processes in the region, supporting numerous studies with a focus on hydrological monitoring of the watershed and snowmelt hydrology (e.g., Marchane et al. Citation2017; Baba et al. Citation2019; Zkhiri et al. Citation2019). However, there are still significant gaps in knowledge beyond the gauged station network (the highest of which is 3,230 masl), for highest parts of the Marrakech High Atlas, which reaches 4,167 masl at Jbel Toubkal. Significant challenges also remain in understanding precipitation at high elevations, in particular dealing with likely underestimations of snowfall (Tuel et al. Citation2008b). Elsewhere in the High Atlas, precipitation gradients have been examined in the M’Goun Massif (Schulz Citation2007; de Jong et al. Citation2008), some 150 km east of our study area. Baba et al. (Citation2019) also presented temperature lapse rate estimations for the Marrakech High Atlas of −6.8°C km−1 with high seasonal variation. However, their data were obtained from only four stations for eight months between 2008 to 2009, and new data now permit recalculation of the lapse rates over a longer elevation gradient with more stations. A comprehensive systematic analysis of temperature lapse rates and precipitation gradients is of fundamental importance to understanding not only catchment hydrology, which is the focus of most studies so far, but also geomorphological processes at the highest elevations (Vieira, Mora, and Faleh Citation2017; Hughes et al. Citation2020). Open questions remain about permafrost processes and snowpack dynamics for the present day, as well as the past.
This study focuses on the climate variations from the piedmont plains to summits on the northern flanks of the Marrakech High Atlas and aims to (1) determine temperature lapse rates at different temporal scales (half-hourly to annual), (2) determine precipitation gradients and account for snowfall contributions at high elevations, and (3) use these temperature lapse rates and precipitation gradients to make inferences about the high mountain climate (>3,000 masl) and cold-climate geomorphological processes.
Study area
The High Atlas is a major physiographic feature in central Morocco () and extends from near the Atlantic Ocean in the west toward the Saharan Atlas of Algeria. The Marrakech High Atlas () can be defined as the mountain area to the south of Marrakech, extending from the Tizi n’Test pass in the southwest to the Tizi n’Tichka pass in the northeast (Bernard and Reille Citation1987). The Marrakech High Atlas contains the highest peaks of the Atlas Mountains chain, with large areas above 3,000 masl and a maximum elevation of 4,167 masl at Jbel Toubkal. The terrain is very rugged and steep, with deep valleys contrasting with high plateaus, including the Tazaghart Plateau (3,980 masl), the largest area of high ground in North Africa (Hannah, Hughes, and Gibbard Citation2017). The central part of the Marrakech High Atlas includes the Toubkal National Park and the Tensift watershed, and the entire area is part of the Western High Atlas.
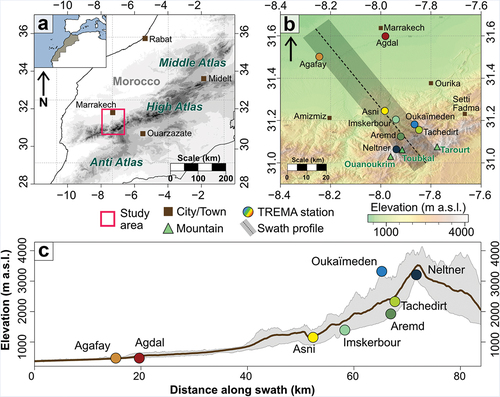
Figure 1. Location of the study area. (A) Location map of Morocco (inset) showing the Atlas Mountains chain and the study area (red box). (B) Study area map of the Marrakech High Atlas showing the location of LMI TREMA automatic weather stations. (C) Elevation profile (swath shown in B) for the LMI TREMA stations used in this study (min/max elevation shown as gray shaded area).
The Marrakech High Atlas is formed in Precambrian basement rocks that comprise a range of intrusive and extrusive volcanic rocks (granites to basalts; Pouclet et al. Citation2007) with Triassic sandstones and Cambrian limestones present locally. The mountains were glaciated in the Pleistocene with evidence of moraines and other glacial features in the high valleys and cirques (Hughes et al. Citation2018). No glaciers exist today, although semi-permanent snowpatches do survive in some sheltered localities because of strong local topo-climatic controls (Hughes et al. Citation2020). The region spans several bioclimatic vegetation stages, dominated by evergreen oaks between 800 and 2,400 masl, junipers from 2,400 to 3,000 masl, and alpine vegetation above 3,000 masl (Benabid Citation1982).
The climate of Morocco is typically Mediterranean in character, with a rainy season between October and April, and warm, dry summers (Lionello et al. Citation2006). The seasonal regime is governed primarily by extratropical (Atlantic) climate systems in the winter season and tropical–extratropical interactions in the summer and transitional seasons (Knippertz, Christoph, and Speth Citation2003; Born et al. Citation2008b; Fink et al. Citation2010). In wintertime, the mid-latitude Atlantic Westerlies bring cold and wet weather when the Azores high-pressure cell is at its weakest (Lamb, Hamly, and Portis Citation1997; Born, Fink, and Knippertz Citation2010), relating to a strong negative influence of the North Atlantic Oscillation on wintertime precipitation (Tuel and Eltahir Citation2018). In summertime, strengthening of the Azores High results in prevailing hot, dry weather. However, the high-pressure ridge is frequently located northward of Morocco, which permits a diversity of summer weather conditions, including Saharan easterlies (chergui), which are associated with extreme heat waves, as well as hot and stormy convective weather over the High Atlas along the trade winds front associated with southwesterly maritime air masses (Noin Citation1963). Summer is characterized by frequent cloudy conditions over the High Atlas, especially high cumulonimbus that develop in the late afternoon and evening, often leading to intense, localized convective storms (Noin Citation1963; Born, Fink, and Knippertz Citation2010). The summer season ends as perturbations associated with the polar front or trade winds reactivate, typically in October (Noin Citation1963). The transitional seasons are characterized by unstable weather systems, including springtime cyclogenesis resulting from the development of Saharan lows along the leeside of the High Atlas (Trigo, Osborn, and Corte-Real Citation2002) and high-intensity rainfall events with moisture sources in tropical West Africa, preferentially occurring in spring and autumn (Knippertz Citation2003).
Methods
Data sources and processing
Climate data, including temperature, rainfall, and humidity data, were obtained from eight LMI TREMA automatic weather stations (), although Asni station only records rainfall data (). Snow depth data are also available from Oukaïmeden station for the study period but are not available for the other high-elevation stations because snow monitoring was only recently installed at these stations. Because individual TREMA stations started operations at different times, for comparative purposes we focus on the period 1 January 2008 to 31 December 2018 for our analysis (eleven years). Automated measurements of weather conditions are taken continuously at 10-second intervals, which are averaged at half-hourly intervals for temperature, humidity, and snow depth, and the sum is taken for rainfall, to generate the half-hourly observations.
Table 1. LMI TREMA weather stations (arranged by altitude); location, site position, and monitoring equipment
Daily data were calculated from the half-hourly observations. The mean daily temperature and humidity are the mean of all half-hourly observations taken on that day (up to forty-eight). The minimum (maximum) daily temperature is the minimum (maximum) observed temperature from the half-hourly observations for that day. Rainfall is the sum of all observations taken on that day. Monthly and annual values were then calculated from the daily data to generate monthly and annual means for temperature (mean, mean minimum, and mean maximum) and humidity, whereas rainfall values are monthly and annual sums. For example, the monthly mean minimum temperature for January is the mean of the minimum temperature values for each day (from the daily data) for that month. Throughout the article, reference to mean monthly or mean annual values implies the averaging of daily values for that month or year, unless otherwise stated. Information about the coldest or hottest temperatures (extremes) can be found in the online supplementary material. Finally, the monthly and annual values were averaged over the eleven-year study period to provide the best available estimate of the typical climatological conditions.
Missing data in the half-hourly observations accounted for 5.4 percent of total observations when averaged across all stations and variables (). Generally, missing data were dispersed across the data set, and because the level of missing data was relatively low and the total number of observations (192,864 for each variable for each station) was high, the daily data (used for calculating monthly and annual data) were calculated by excluding the missing observations for temperature and humidity. However, because missing data can have a significant effect on the monthly or annual mean for rainfall, the mean monthly rainfall values for the eleven-year period were calculated by excluding months where missing data exceeded 10 percent of the possible observations for that month. Similarly, mean annual rainfall values were calculated by excluding years where missing data exceeded 10 percent of the possible observations for that year.
Imputation methods for the missing data (including interpolation, Kalman smoothing, moving average) were tested for temperature and rainfall. For temperature, we found these made little difference to the mean values (e.g., monthly, annual) when compared to the original data, whereas no improvements were found to the rainfall data due to the episodic nature of rainfall events, making it difficult to predict. Therefore, imputations were not used for the analysis.
For the precipitation gradient, we also compare our results (LMI TREMA data) to historic rainfall observations from the twentieth century (1940 to 1970), collected from a network of pluviometer rain gauges across the Tensift watershed (O.R.S.T.O.M. Citation1976), in which our study region is sited. The rain gauges were mounted on monopods 1.5 m from the ground, and readings were collected daily (manually), which were collated into monthly totals based on the methods described in Roche (Citation1963). These data have been digitized and are available in the online supplementary material.
Data quality
An initial check for anomalous data was carried out by manually reviewing observation values that fell outside 1.5 times the interquartile range. This criterion was set to avoid removing genuine extremes and to catch clear and obvious errors. For example, in the temperature data, this included more than 600 occurrences of −39.76°C at Oukaïmeden. Additional anomalous temperature and humidity readings would sometimes occur in up to two of the observations adjacent to missing data, where the observation would report a higher or lower value than expected. These errors were detected by comparing the difference in values between these observations and two of their adjacent observations (test 1 and test 2). If the difference exceeded a threshold of 1.5°C for temperature or 10 percent for humidity in both tests, that reading was considered unreliable and removed (converted to missing data).
Data analysis
All data handling and statistical analysis were carried out using R v4.1.1 (R Core Team Citation2021). Temperature lapse rates were determined using simple linear regression (temperature versus elevation), with models cross-validated using leave-one-out cross-validation (LOOCV) using the “caret” package (Kuhn et al. Citation2021), and 95 percent confidence intervals were calculated for the model using all station data (all inputs model). In order to determine the level of uncertainty in the reported lapse rates resulting from the influence of individual stations, lapse rates were also calculated for each LOOCV model (seven models with six inputs) and the main model (all inputs). LOOCV was chosen because this ensured at least 80 percent of the original inputs went into each model; this follows the recommendations and methodology of Lute and Abatzoglou (Citation2021). The reported lapse rate is the median result of all of the regression models, with the minimum and maximum results as the lapse rate uncertainty.
Lapse rate analysis was performed on mean, mean minimum, and mean maximum temperatures for monthly and annual intervals (as described in the previous section), using all available data from the study period. For example, the mean minimum temperature lapse rate for January was calculated using the mean of all January daily minimum temperature data between 2008 and 2018. Half-hourly temperature lapse rates were also calculated to analyze diurnal lapse rate evolution. Half-hourly temperature means were calculated for monthly, seasonal, and annual periods using all available data from the study period. For example, half-hourly lapse rates for January use a mean of all available half-hourly data for January between 2008 and 2018 for each half-hourly interval.
The precipitation gradient was calculated using simple linear regression (precipitation versus elevation), using the same approach as the temperature lapse rates, with the precipitation change (mm km−1) calculated for each regression model, where we report the median result and the minimum and maximum results as uncertainty. The precipitation gradient model inputs were mean annual rainfall, except for Oukaïmeden station, which used the sum of mean annual rainfall and mean annual snow. Neltner was excluded from the gradient calculation due to lack of snow data, which is likely to make up a large proportion of precipitation for this station. At Oukaïmeden, snow depth was used to calculate snow water equivalent (SWE) using the formula SWE (mm) = Snow depth (cm) * Density (kg m−3/100), using a density of 150 kg m−3 (Boudhar et al. Citation2016). Because snow depth changes with each half-hourly observation (either increase or decrease), we calculated daily snow accumulation based on the difference between each half-hourly observation for each day, where increases (assumed to indicate snow fall and accumulation) were summed.
Results and discussion
General climate
All climate observations from the LMI TREMA stations used in this study were analyzed, and annual, monthly, and daily summaries were generated for each station, which contribute to a detailed overview of the climate of the Marrakech High Atlas region. This includes temperature, rainfall, and humidity, as well as additional information regarding frost days, diurnal temperature range, and snowfall. This information is available in the online supplementary material.
To summarize, the lowland areas in the region are warm and arid, with a mean annual temperature of ~18°C and between 200 and 300 mm annual rainfall; they can also experience extreme summer (JJA) temperatures of up to ~46°C. In contrast, the alpine areas in the region are cool and wet, with a mean annual temperature of ~5.5°C and more than 500 mm rainfall, which has a significant snow contribution during the winter (DJF) months. Summer temperature extremes are more moderate, reaching ~24°C. Lowland areas experience few annual frost days (where temperature falls below 0°C), typically fewer than 15 days. In contrast, alpine areas experience significantly more, typically exceeding 130 days. The mean diurnal temperature range (DTR) is high in lowland areas at ~16°C, whereas alpine areas have a lower DTR of ~6.5°C. DTR varies throughout the year, with highest values during the summer. In general, climate conditions are similar for stations within the same elevation zones (). Through time, interannual temperatures for lowland and alpine areas have remained relatively stable (mean standard deviation of 0.87°C); however, interannual rainfall is highly variable across the region (mean standard deviation of 173.7 mm).
Temperature lapse rates
Annual and monthly lapse rates
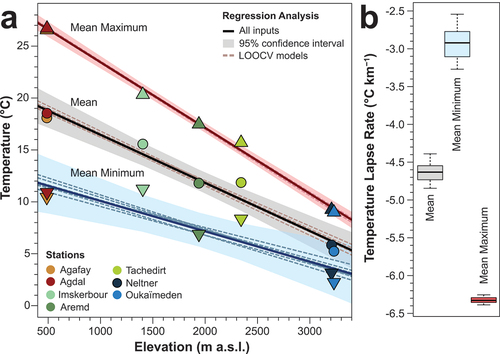
The mean annual temperature lapse rate for the Marrakech High Atlas is −4.63°C km−1, with an uncertainty range of −4.39°C to −4.85°C km−1 (). The mean minimum annual temperature lapse rate is −2.92°C km−1 (−2.54°C to −3.27°C km−1), and the mean maximum annual temperature lapse rate is −6.33°C km−1 (−6.26°C to −6.39°C km−1). The strongest relationship between annual temperature and elevation was with mean maximum temperature (r2 = 0.995, root mean square error [RMSE] = 0.4837), followed by mean temperature (r2 = 0.95, RMSE = 1.1610), whereas mean minimum temperature had a weaker relationship and the greatest uncertainty (r2 = 0.70, RMSE = 1.9034). All of the LOOCV models fall within the 95 percent confidence interval for the all inputs regression model ().
Table 2. Monthly and annual lapse rates for the Marrakech High Atlas (°C km−1) for mean, mean minimum, and mean maximum temperature calculated for the study period: 1 January 2008 to 31 December 2018
Figure 2. Results of temperature lapse rate analysis for the Marrakech High Atlas TREMA stations. (A) Mean annual temperature versus elevation for the LMI TREMA stations, showing mean (black line, circles), minimum (blue line, inverted triangles), and maximum (red line, triangles), calculated from daily data for the study period 2008 to 2018. Shaded area shows the 95 percent confidence intervals for the all-inputs regression model, and the dashed lines show the LOOCV regression models used to calculate the lapse rate uncertainty range. (B) Box plots showing the lapse rates calculated from all regression models for each temperature variable (mean, minimum, maximum).
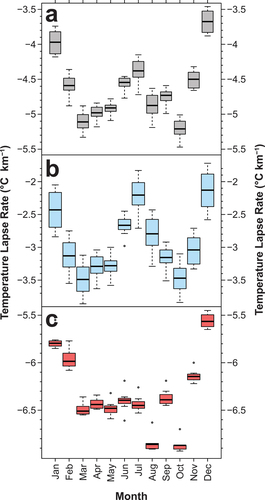
Temperature lapse rates change throughout the year. For mean temperature, monthly lapse rates vary from −3.67°C to −5.21°C km−1, with a mean uncertainty range of 0.43°C (, ). For mean minimum temperature, monthly lapse rates vary from −2.13°C to −3.49°C km−1, with a mean uncertainty range of 0.72°C (). For mean maximum temperature, monthly lapse rates vary from −5.57°C to −6.87°C km−1, with a mean uncertainty range of 0.26°C (). For mean temperature and mean minimum temperature, we observe a bimodal pattern where steeper lapse rates occur in the spring (MAM) and autumn (SON), whereas shallow lapse rates occur during summer and winter. For mean maximum temperature, the shallow lapse rates only occur during the winter. The month of December has the shallowest lapse rates for all temperature variables, and October has the steepest lapse rates for mean and mean maximum temperature, whereas for mean minimum temperature, the steepest lapse rates occur in March. The strongest relationships between monthly temperatures and elevation are for mean maximum temperature for all months (r2 > 0.98) and mean temperature (r2 > 0.88). Mean minimum temperature has weaker relationships for some months (December, January, July and August), where r2 < 0.58, whereas other months have a relatively stronger relationship with elevation (r2 > 0.71). The full results of the regression analysis are available in the online supplementary material.
Figure 3. Box plots showing monthly temperature lapse rates calculated from all regression models for (A) mean temperature, (B) mean minimum temperature, and (C) mean maximum temperature. Monthly temperature means were calculated from daily data for the study period 2008 to 2018.
Lapse rates for this region were previously modeled using temperature data for 2008 to 2009 from Aremd, Imskerbour, Neltner, and Oukaïmeden stations by Baba et al. (Citation2019), who reported monthly lapse rates varying from −4.40°C km−1 in January to −8.2°C km−1 in June, with a mean annual temperature lapse rate of −6.87°C km−1. Schulz (Citation2007) reported a mean annual lapse rate of −7.07°C km−1 for the M’Goun Massif in the central High Atlas, with winter having shallower lapse rates of −5.94°C km−1 and summer having steeper lapse rates of −8.0°C km−1. These rates are steeper overall than the lapse rates we report, but they are similar to our maximum monthly temperature lapse rates and the lapse rates for the hottest part of the day (discussed in the next section). However, those studies did not include lowland stations in their temperature gradients; thus, the lapse rates were calculated from a smaller elevation range, which has been shown to increase errors and uncertainty (Lute and Abatzoglou Citation2021). Our estimates benefit from a longer observation period and a longer elevation gradient and thus should provide a more robust estimate of lapse rates and their variability in this region.
The mean annual lapse rate for the Marrakech High Atlas is similar to that reported for the semi-arid Baetic mountain range, Spain, at −4.83°C km−1 (Navarro-Serrano et al. Citation2018), which is the most comparable climatic region of Spain to our study area. Other mountain ranges in Spain have lapse rates varying from −5.17°C km−1 in the Pyrenees to −5.78°C km−1 in the Central range (Navarro-Serrano et al. Citation2018). All of the Spanish mountain ranges, in common with our findings, yield lapse rates below the standard ELR of −6.5°C km−1. In the Alps, across the range, mean annual lapse rates are typically in the region of −5.6°C km−1 (mean of reported lapse rates reviewed in Rolland Citation2003) but can vary significantly between regions, with lapse rates in Italy reported from −3.9°C to – 8.0°C km−1 (Cortemiglia Citation1989; Rolland Citation2003). In contrast, the Himalayas present much steeper lapse rates of −8.2°C km−1 annually, with monthly lapse rates varying from −6.1°C to −10.3°C km−1 (Kattel et al. Citation2015). Each of these regions has different topography and climatic conditions, which have previously been suggested to influence lapse rates (Pepin and Losleben Citation2002; Rolland Citation2003; Blandford et al. Citation2008; Li et al. Citation2013; Kattel et al. Citation2015). These comparisons underline the strong regional differences in NSLRs and how they often deviate from the standard ELR of −6.5°C km−1, further highlighting the importance of establishing regional NSLRs (Blandford et al. Citation2008).
Lapse rate changes throughout the day
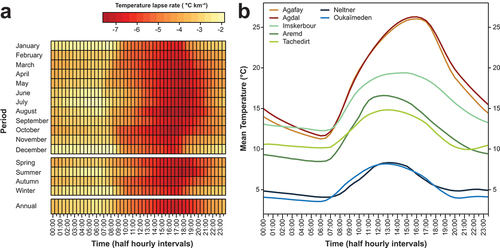
The monthly and annual temperature lapse rates point to complexities in the daily temperature regime in the region, because the greatest uncertainty is with minimum temperatures, which will generally occur overnight and in the early morning. There is lower uncertainty for maximum temperatures, which are most likely to occur in the afternoon. Throughout the course of the day, half-hourly temperature lapse rates vary from −2.75°C to −7.1°C km−1 (for mean annual temperatures), with further variations to this regime throughout the year (). The steepest lapse rates (>5°C) occur between 11:00 and 21:00, which is when the relationship between temperature and elevation is strongest (r2 > 0.9), because temperature decreases with elevation along the entire gradient (). However, between 00:00 and 07:00, temperature inversions are a common occurrence between Imskerbour and the lowland stations (Agafay and Agdal) and between Tachedirt and the lowland stations. These inversions lead to the greater uncertainty in our lapse rates overnight (and, correspondingly, minimum temperature lapse rates). Between Imskerbour and the lowland stations, there are on average 261 days in a year where a temperature inversion occurs, whereas between Tachedirt and the lowland stations this increases to 321 days in a year.
Figure 4. Half-hourly temperature analysis for the Marrakech High Atlas TREMA stations. (A) Heat map showing half-hourly mean temperature lapse rates for different periods (monthly, seasonal, and annual). Darker reds indicate steeper lapse rates, and lighter yellows indicate shallower lapse rates. (B) Mean annual half-hourly temperatures at each LMI TREMA station.
Lapse rate influences and controls
Several studies have highlighted important seasonal variability in NSLRs (Rolland Citation2003; Blandford et al. Citation2008). In many regions, winter lapse rates are shallower than summer lapse rates, associated with radiative heat loss due to snow cover extending down to low elevations (Barry and Chorley Citation2009). Our results show a more complex, biannual pattern, with low monthly lapse rates occurring both in the winter (DJF) and in the summer months of June and July (, ). A key factor in reducing the wintertime lapse rates may be katabatic winds, which are strongly developed in the High Atlas during the winter months due to snow cover at high elevation (Abatzoglou et al. Citation2021). Furthermore, in the winter months, reduced solar radiation leads to cooler temperatures, which reduces convection and convective cloud cover in the mountains; thus, lower differential heating and shallower afternoon (maximum temperature) lapse rates are found compared to other seasons (). During the early summertime, low lapse rates may result from prevailing stable atmospheric conditions and weak convective activity, associated broadly with the seasonal strengthening of the Azores High. Localized cold air drainage processes may be maximized during relatively stable conditions in both winter and summer, which may lead to more shallowing of the lapse rate in the predawn hours and weaken the statistical relationships in our minimum temperature lapse rates, as similarly observed in northern Italy (Rolland Citation2003). It is during December and July that we observed the greatest amplitude of temperature inversions in the temperature series, notably at Imskerbour and Tachedirt stations, which can be observed even in the mean diurnal temperature data around dawn (). Steepening of the lapse rates in spring may be driven by late-lying snow at high elevation in springtime, maximizing albedo contrasts between greening lowlands and snow-covered alpine zones (Blandford et al. Citation2008) with enhanced high-elevation cooling due to melting snow, a phenomenon reported in the Tianshan Mountains (Shen et al. Citation2016). In general, unstable atmospheric conditions associated with enhanced cyclogenesis and convective activity may be influential in both spring and autumn, consistent with enhanced extratropical–tropical activity focused along the High Atlas range (Trigo, Osborn, and Corte-Real Citation2002; Knippertz Citation2003).
We note that this pattern of steepest lapse rates during the equinoctial (spring and autumn) seasons has previously been reported for the Iberian Peninsula, and the annual profile is remarkably similar to the synthesis of all mountain areas in continental Spain (Figure 5 in Navarro-Serrano et al. Citation2018). The marked summertime shallowing of lapse rates observed in the High Atlas data is especially characteristic of the Baetic range, attributed to heating in warm inland valleys (Navarro-Serrano et al. Citation2018), further highlighting important similarities in the temperature lapse rate dynamics of these areas. The marked wintertime shallowing is somewhat less pronounced in the Baetic range but well developed in the Central range, Iberian range, and Pyrenees, where stable atmospheric conditions and thermal inversions are implicated. Overall, the strong similarities in seasonal changes in lapse rates identify the High Atlas as part of a western Mediterranean geographical “family” alongside the Iberian mountain ranges, sharing a biannual lapse rate pattern that is not widely observed in other studies. Bimodal annual lapse rate profiles have also been reported in the Ecuadorian Andes, albeit of very low amplitude (Córdova et al. Citation2016); in Bhutan (Dorji et al. Citation2016); and in the central Himalaya (Kattel et al. Citation2015), but in these cases the pattern relates to monsoonal dynamics.
Humidity also plays a role in influencing vertical temperature gradients, and there is a general expectation that as humidity increases, lapse rates should become shallower due to the liberation of latent heat from condensation in moist air (Barry and Chorley Citation2009). This relationship has been noted in several studies of lapse rates in different regions (e.g., Marshall et al. Citation2007; Blandford et al. Citation2008; Li et al. Citation2013; Kattel et al. Citation2015; He and Wang Citation2020). In contrast, we observed an inverted pattern between lapse rates and humidity over the alpine zone (). Relative humidity is high in the mountain areas during the spring and autumn, when lapse rates are shallow, and low during the summer and winter, when lapse rates are steeper (). The lowland stations (Agafay, Agdal) do not display the same bimodal pattern of relative humidity as mountain areas, showing highest humidity during the winter. Correlation analysis reveals a positive relationship between monthly humidity and lapse rates at lowland stations and a negative relationship for the mountain stations. However, only Neltner has a statistically significant monthly correlation between relative humidity and lapse rates (r = −0.71, p = .009). Overall, this inverted pattern may be linked to a stronger influence of atmospheric subsidence in both wintertime and summertime and enhanced convective activity in the spring and autumn. In wintertime, subsidence may be enhanced by radiative cooling over snow-covered areas and intense katabatic winds, which are highly characteristic of the Atlas (Abatzoglou et al. Citation2021). Generally, snow-free conditions at lower elevations and greater moisture content of warm air may underline the stronger elevation contrasts in humidity, possibly also linked to enhanced frontal activity and precipitation in the lowlands. In summertime, low humidity may prevail due to high-pressure synoptic conditions and high temperatures. These scenarios in turn contrast with strengthening of ascending air motions and increased convection associated with unstable meteorological conditions in the transitional seasons. As such, the unexpected phasing of temperature and humidity regimes may originate fundamentally in the seasonal characteristics of the regional climate, rather than adiabatic dynamics, which may be more influential in areas with more humid climate types (e.g., monsoon regions).
Figure 5. Analysis of humidity data for the Marrakech High Atlas TREMA stations. (A) Mean monthly relative humidity at each LMI TREMA station (solid lines) and mean monthly temperature lapse rates (black dashed line; shaded area shows uncertainty). (B) Mean annual half-hourly relative humidity at each LMI TREMA station (solid lines) and mean annual half-hourly temperature lapse rates (black dashed line; shaded area shows uncertainty).
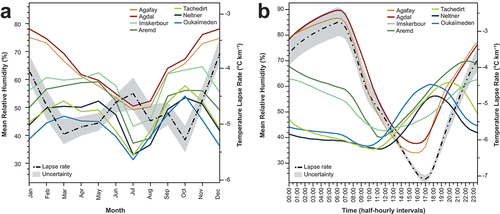
Many of the dynamics inferred for the annual cycle may also be expressed in the diurnal cycle. Over the course the day, relative humidity is high (>80 percent) in the lowlands between 00:00 and 07:00 when lapse rates are shallowest and lower (<50 percent) in the lowlands between 11:00 and 19:00 when lapse rates are steepest; alpine areas show an inverse pattern (). Correlation analysis of half-hourly humidity data with lapse rates show a significant positive correlation between humidity and lapse rates for the lowland stations (r = 0.98, p < .001 and r = 0.96, p < .001 for Agafay and Agdal, respectively); however, there is a negative correlation for the alpine stations (r = −0.63, p < .001 and r = 0.76, p < .001 for Neltner and Oukaïmeden, respectively). This daily lapse rate regime in the Marrakech High Atlas may be influenced by several different factors. Overnight, katabatic winds draw cool air downslope into the bottom of the valleys trapping warmer air above (Barry and Chorley Citation2009), associated with localized temperature inversions. As predawn temperatures drop in the lowlands (), relative humidity increases (), and because the temperature difference between the lowlands and alpine areas is now reduced, lapse rates are shallow. After sunrise, high solar radiation and clear skies rapidly warm the lowlands, lowering relative humidity. As temperature rises, convection increases and lapse rates become steeper (Houston and Niyogi Citation2007). Warm and humid air moves up the mountains, increasing relative humidity here. In the late morning to early afternoon (11:00 to 14:00), convective cloud cover begins to form over the mountains, reflecting solar radiation, so mountain temperatures reach their peak. However, temperature continues to rise in the lowlands, and this differential heating further promotes steeper lapse rates and cloud formation in the mountains (Rabin et al. Citation1990). By the evening, temperatures start to drop and lapse rates become shallower, and the cycle repeats.
Station location
Because near-surface temperature lapse rates are influenced by topography, among other factors, the location of the weather stations may contribute to some of the uncertainty in the lapse rates we report. Although all of the weather stations used in this study are within the same macroregion and same windward setting, not all stations are within the same valley, which may introduce some microscale climate variations.
In the lowlands, Agdal station is situated in an urban public garden (green space) within the city of Marrakech. Temperature readings here are an average 0.5°C higher compared to Agafay, which is sited at a similar elevation but situated within farmland. This difference may relate to a documented urban heat island effect in Moroccan cities that particularly affects vegetated cities (Fathi, Bounoua, and Messouli Citation2019). In the alpine areas, Oukaïmeden minimum temperature extremes are greater by 1°C compared to Neltner (sited at a similar elevation) because Oukaïmeden station is located on an exposed mountain ridge, whereas Neltner is within a valley. This contrast in setting will influence solar radiation across diurnal and annual cycles. Furthermore, roof-mounted stations could potentially influence the recorded temperature due increased air mixing, heat system exhausts, and radiative heating from the roof, particularly during the summer, which may account for higher minimum temperatures (Griffith and McKee Citation2000; De Podesta, Bell, and Underwood Citation2018). However, the temperature sensors at the TREMA stations are mounted away from any heat source and located at the edge of the roof, which should minimize these effects (Lagouvardos et al. Citation2017). For example, high minimum temperatures are observed at Imskerbour and Tachedirt station but not at Nelter and Aremd, all of which are roof-mounted stations (). Despite the differences in station site locations, our lapse rate results are quite robust to the influence of individual stations, as supported by the LOOCV analysis. The greatest uncertainty is in the minimum temperature lapse rates, which can be explained by the temperature inversions previously discussed.
Implications
As previously noted in other studies on near-ground temperature regime, regionally specific lapse rates have important implications in several disciplines, including glaciology, hydrology, ecology, forestry, and agriculture (Kattel et al. Citation2015). In the Marrakech High Atlas, temperature gradients have particularly important implications for understanding snowmelt, which is a significant source of potable water underpinning agriculture and economy (Diao et al. Citation2008). Historical variability in snowpack, and hence in water resources, is also of considerable research interest and requires deeper understanding of temperature regime variability (Hughes et al. Citation2020). Our overall findings of shallow mean annual and summer temperature lapse rates would suggest a potentially higher snowmelt and greater exposure to rising regional temperatures compared to previous estimates using the ELR suggested. However, the generally steeper afternoon lapse rates and steep springtime lapse rates equate to more strongly cooler temperatures with elevation; thus, melt rates will be mitigated in the hottest part of the day during the spring melt season. This is particularly important to note because though the mean and minimum temperature daily lapse rates are shallower than the standard ELR, this is not the case for the maximum daily temperatures, which are higher. Furthermore, the daily and monthly complexity poses challenges for estimating daily melt rates using temperature index models such as the degree-day model, which are valuable for current and past reconstructions and modeling (Hannah, Hughes, and Gibbard Citation2017; Hughes et al. Citation2020). Nevertheless, the insights into daily and monthly lapse rates will help improve future melt models for this region, and the uncertainty analysis will help us to understand the range of possible melt, important for understanding the variations in snowpacks for hydrological purposes (Marchane et al. Citation2017; Baba et al. Citation2019b; Tuel et al. Citation2008a). Furthermore, our data indicate that there is differential heating between the lowlands and mountains, which is the cause of the shallow afternoon lapse rates. Climate change has been reported to be amplifying the warming effect in the mountains relative to lowlands (Pepin et al. Citation2015); thus, differential heating would be reduced, impacting lapse rates. In addition, because lapse rates also vary temporally (Li et al. Citation2013), continued monitoring of lapse rates through time will be important for understanding past, present, and future responses of snowpacks to climate change in the High Atlas (Hughes et al. Citation2020).
Precipitation elevation gradient
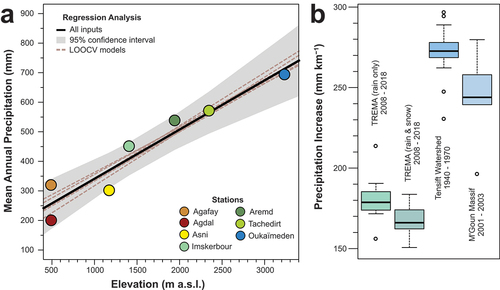
Precipitation increases with elevation in the Marrakech High Atlas. For mean annual precipitation, precipitation increases by 166.0 mm km−1, with an uncertainty range of 150.6 to 183.7 mm km−1 (r2 = 0.84, RMSE = 66.16), which falls within the 95 percent confidence interval of the all-inputs regression model ().
Figure 6. Precipitation gradient analysis for the Marrakech High Atlas TREMA stations. (A) Mean annual precipitation versus elevation for the LMI TREMA stations (excluding Neltner). Black line shows the all-inputs regression with shaded area showing the 95 percent confidence interval. The dashed lines show the LOOCV regression models (used to calculate the gradient uncertainty range). (B) Box plots showing a comparison of precipitation gradients in the region. From left to right, the first shows precipitation gradients calculated from the LMI TREMA stations using rainfall only (excluding Neltner and Oukaïmeden). The second shows the LMI TREMA stations using rainfall and snowfall. The third shows a gradient calculated from historic rainfall data from the wider watershed area (see Methods), and the fourth shows gradients calculated from the M’Goun Massif in the northeast High Atlas.
Due to the episodic nature of precipitation events, the relationships between monthly precipitation and elevation are weaker compared with mean annual precipitation. In the Marrakech High Atlas, snow is a significant source of precipitation throughout much of the year for alpine areas. Baba et al. (Citation2019) stated that the lower elevation montane stations rarely receive snow compared to the alpine stations; however, it is likely that there is at least some snow component to precipitation for all areas above 1,500 masl based on minimum observed temperatures (see supplementary material), with an increasing snow component with elevation. In May and June, the relationship between precipitation and elevation is relatively strong: May r2 = 0.71, RMSE = 5.11; June r2 = 0.71, RMSE = 5.48. Because snowfall is least likely to occur during these months in the mountains, with almost all precipitation falling as rain, the precipitation total is almost fully captured at every station along the gradient. Correspondingly, the weaker relationships experienced in autumn (SON) and winter (DJF) may be due to the lack of snow monitoring at lower elevation stations. For July and August when there is also little snowfall, strong convective storms are common in the High Atlas (Knippertz, Christoph, and Speth Citation2003), which we observe in our region, with stronger storms (higher precipitation) in montane areas and relatively weaker storms in alpine areas, therefore resulting in weaker precipitation gradients during these months.
A further cause for uncertainty with our gradient is due to snow density. Although fresh falling snow has been measured at Oukaïmeden station as 150 kg m−3 (Boudhar et al. Citation2016), snow density can vary with climate conditions such as temperature and wind strength and thus will vary between seasons (Roebber et al. Citation2003; Meløysund et al. Citation2007; Bormann et al. Citation2013). Because we calculate SWE using a single density value, we may not fully capture these seasonal variations (if snow density were higher) and therefore could underpredict precipitation. Furthermore, wind can affect the accuracy of standard tipping-bucket rain gauges at higher elevations, recording lower rainfall amounts than actual (Jevons Citation1861), which further suggests that our precipitation gradient underpredicts precipitation, especially for areas above 1,500 masl, with increasing uncertainty with increasing elevation.
New precipitation monitoring equipment (Geonor T-200) has recently been installed at Oukaïmeden and Neltner stations, which will allow improvements to precipitation monitoring going forward. Using just the rainfall data from the TREMA stations and excluding Neltner and Oukaïmeden stations would suggest that precipitation increases by 181.1 mm km−1 with an uncertainty range of 156.4 to 214.1 mm km−1 (). Because a significant proportion of precipitation in the alpine zone falls as snow, the rainfall figures for the alpine stations are low, and a gradient calculated using rainfall data from every station in our study area would incorrectly suggest a precipitation inversion. The gradient based on rainfall only is higher than our precipitation gradient, which further supports that there is underprediction of precipitation by our gradient due to incomplete capture and estimation of snow at stations in the montane and subalpine zones. Previous research in the Sierra Nevada (peak height 3,478 masl) of southern Spain did observe an inversion between 1,500 to 2,000 masl where precipitation decreased toward higher elevations (Collados-Lara et al. Citation2018). Nethertheless, in our region, when snow contributions are factored in, we do not observe a similar shallowing or inversion of the precipitation gradient. Our precipitation gradient is also similar to that reported for the M’Goun Massif in the central High Atlas (Schulz Citation2007; de Jong et al. Citation2008), where precipitation increases by 243.5 mm km−1 with an uncertainty range of 196.6 to 279.7 mm km−1 (when calculated using the same methodology in this article; ). Significantly, their gradient is linear to 3,800 masl near the highest summits of that area (peak height 4,001 masl), with no evidence of any inversion or reduced gradient at high elevations, further supporting our assumption of a linear precipitation gradient for the Marrakech High Atlas.
Further precipitation gradient comparisons are possible using historic rainfall data from the Tensift watershed for the period 1940 to 1970 (O.R.S.T.O.M Citation1976), which suggest precipitation increased by 272.5 mm km−1 with an uncertainty range of 230.8 to 297.2 mm km−1 (). These results are also consistent with the range of gradients reported by Michalet (Citation1991) for Moroccan data sets spanning 1933 to 1963. It is well known that Morocco has become drier since the 1970s (Born et al. Citation2008b; Rhanem Citation2011; Nicholson, Funk, and Fink Citation2018). The higher precipitation gradient compared to the one we report may therefore suggest that as precipitation decreases, so does the precipitation gradient. With future predictions of decreased precipitation and increased drought in the region (Zkhiri et al. Citation2019), further decreases to the precipitation gradient are a possibility, with implications for snowmelt hydrology and alpine ecology. However, further research is necessary to confirm this.
Climate extrapolations
Understanding the climate at Jbel Toubkal (4,167 masl), Morocco’s highest peak, is a target of interest, particularly for understanding past glaciation and snowpack variations and snowmelt dynamics in the highest parts of the High Atlas. However, this understanding has been hindered due to lack of observational data. Because our LOOCV regression analysis does not reveal any stations that have undue influence on our all-inputs regression models (temperature and precipitation), we can use those models to extrapolate climate beyond the gradient to Toubkal. Here, we report the 95 percent confidence intervals as the uncertainty because they reveal the uncertainty within the linear model and because the uncertainty will increase the further away from the gradient we extrapolate.
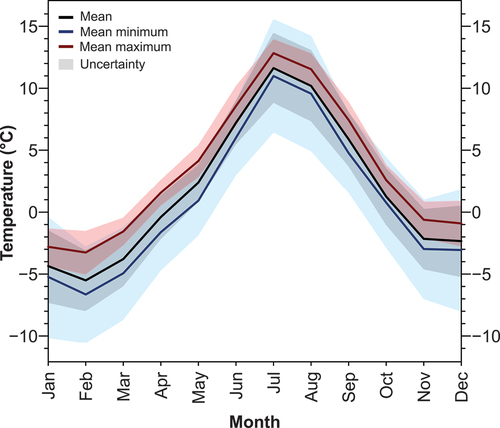
At the summit of Toubkal, we estimate the mean annual temperature to be 1.8°C ± 2.4°C, the mean minimum temperature to be 0.8°C ± 3.9°C and the mean maximum temperature to be 3.4°C ± 1.1°C. Mean monthly temperatures range from −5.5°C to 11.6°C, mean minimum from −6.6°C to 11°C, and the mean maximum from −3.3°C to 12.8°C (). For six months of the year, mean monthly temperatures are below 0°C. We also estimate mean annual precipitation at Toubkal to be 872 mm ± 161.0 mm. However, precipitation at Toubkal may actually be higher than our upper uncertainty range due to possible underprediction, as previously discussed.
Figure 7. Extrapolated monthly temperature at Jbel Toubkal, based on the all-inputs regression models. Black line shows mean daily temperature for each month, blue line shows mean daily minimum temperature, and red line shows mean daily maximum temperature. Shaded area is the 95 percent confidence interval and indicates the uncertainty.
The temperature at the summit of Toubkal is higher than assumed in previous studies (e.g., Hannah, Hughes, and Gibbard Citation2017; Hughes Citation2018; Hughes, Fink, and Fletcher Citation2021). These relied on extrapolation from temperature observed at Marrakech using lapse rates in close approximation to the standard ELR. However, because our data show the lapse rate to be generally shallower, the higher extrapolated temperatures we report for Toubkal suggest that melting potential is likely to be greater. Our findings therefore suggest that conditions in the Marrakech High Atlas area may be even more marginal for glacier and snow patch survival than previously thought as well as for discontinuous permafrost, which occurs when mean annual temperatures are below −2°C (Haeberli Citation1985). However, the uncertainty in our lapse rate and the paradox of perennial and late-lying snow patches that we observe in this mountain region today indicate that in niche settings, local topo-climatic conditions produce sufficiently cold microclimates for long-lasting snowpack (Hughes et al. Citation2020).
Indeed, periglacial processes are known to have been active in recent times. Couvreur (Citation1966) identified features such as solifluction lobes, rasentrappen, thufurs, polygons, stone stripes, and felsenmeer, some of which may be presently active, at elevations above 2,000 masl in the High Atlas. A study by Vieira, Mora, and Faleh (Citation2017) looked at subsurface temperatures measured over a one-year period (2015 to 2016) near the summit of Toubkal. Ground surface (2 to 3 cm depth) temperatures measured at an elevation of 3,815 masl were below 0°C for six months of the year from October to March, with the coldest temperatures from December to March (−4.5°C to −6°C), at which time the area was also under a continuous snow cover. These readings are comparable to our climate extrapolations for near-ground air temperatures and represent a good indicator of the probable presence of sporadic permafrost at greater subsurface depths in the highest parts of the Marrakech High Atlas (Vieira, Mora, and Faleh Citation2017), both at present and certainly in the recent past, such as the Little Ice Age, when climate is likely to have been cooler and wetter in the region (Ait Brahim et al. Citation2017; Esper, Cook, and Schweingruber Citation2002; Hughes et al. Citation2020; Bell et al. Citation2022). The occurrence of isolated permafrost occurring even today in the Marrakech High Atlas has important implications for geomorphological processes, including the formation of talus rock glaciers and other periglacial forms, as well as for the interrelation between ground temperatures and semi-permanent snow patches that are present in these mountains (cf. Hughes Citation2018; Hughes et al. Citation2020). A detailed knowledge of modern climate of the wider Marrakech High Atlas and accurate extrapolation, to the highest elevations, via the near-surface temperature lapse rates and precipitation gradients established in this study is crucial toward understanding the contemporary processes active in this mountain range.
Conclusions
This article uses half-hourly climate data spanning an eleven-year period between 2008 to 2018 from eight climate stations in the Marrakech High Atlas to establish temperature lapse rates and precipitation gradients for the region. The results provide new insights into the climate of the Marrakech High Atlas, specifically:
1.The mean annual temperature lapse rate is −4.63°C km−1 (−4.39°C to −4.85°C km−1), and there is significant daily and monthly variation in near-surface temperature lapse rates, ranging from −2.75°C to −7.1°C km−1 throughout the course of a day, and mean monthly temperature lapse rates vary from −3.67°C to −5.21°C km−1. These lapse rates are lower than the standard ELR, although our maximum temperature lapse rates are much closer to the ELR. The lapse rates display strong seasonality with a pattern of spring and autumn steepening that is shared with mountain ranges of continental Spain and that points to a prevailing control of atmospheric climate regime on lapse rates.
2.The mean annual precipitation gradient is 166.0 mm km−1 (150.6 to 183.7 mm km−1). There is likely an underestimation of annual precipitation totals in the High Atlas, in part due to lack of consistent snow monitoring at every station. Snow depth data reveal as much as 88 percent of precipitation could be falling as snow in the coldest months at high elevations. Accordingly, recording of snowfall in the mountains is crucial for understanding total precipitation and water supply, which includes stations at lower elevations in the subalpine zone where minimum temperature data suggests the possibility of snowfall.
3.The high mountain climate in the Marrakech High Atlas above 3,000 masl is characterized by cold and wet alpine climate with more than six months of the year with the potential for snowfall. For the highest areas above 4,000 masl we estimate mean annual temperatures to be 1.8°C ± 2.4°C, and mean annual precipitation is 872 mm ± 161.0 mm, suggesting that sporadic permafrost is likely to be present in the highest cirques.
Our study highlights the value of dense meteorological station networks (like LMI TREMA) for understanding climate variability in high-relief mountain areas. These regional insights are crucial for understanding and modeling high mountain climate in the Marrakech High Atlas and contribute to the global understanding of the diversity of mountain climates. These findings are important for modeling snowmelt contributions to catchment hydrology and for understanding climate-related processes in the high mountains (especially nival and wider periglacial processes).
Data availability
Half-hourly climate observations used in this study are available from LMI TREMA (https://www.lmi-trema.ma).
Supplemental Material
Download Zip (1.9 MB)Acknowledgments
This study was made possible thanks to the Joint International Laboratory LMI-TREMA of Cadi Ayyad University, which provided the climate data. We thank A. C. Lute and two anonymous reviewers for their constructive feedback and suggestions that have improved this article.
Disclosure statement
No potential conflict of interest was reported by the authors.
Supplementary material
Supplemental material for this article can be accessed on the publisher’s website.
Additional information
Funding
Related Research Data
References
- Abatzoglou, J. T., B. J. Hatchett, P. Fox-Hughes, A. Gershunov, and N. J. Nauslar. 2021. Global climatology of synoptically-forced downslope winds. International Journal of Climatology 41:31–50. doi:10.1002/joc.6607.
- Ait Brahim, Y., H. Cheng, A. Sifeddine, J. A. Wassenburg, F. W. Cruz, M. Khodri, and L. Bouchaou. 2017. Speleothem records decadal to multidecadal hydroclimate variations in southwestern Morocco during the last millennium. Earth and Planetary Science Letters 476:1–10. doi:10.1016/j.epsl.2017.07.045.
- Baba, M. W., S. Gascoin, C. Kinnard, A. Marchane, and L. Hanich. 2019. Effect of digital elevation model resolution on the simulation of the snow cover evolution in the High Atlas. Water Resources Research 55:5360–78. doi:10.1029/2018WR023789.
- Barry, R. G. 1978. H.-B. de Saussure: The first mountain meteorologist. Bulletin of the American Meteorological Society 59:702–05. doi:10.1175/1520-0477(1978)059<0702:HBDSTF>2.0.CO;2.
- Barry, R. G. 1992. Mountain climatology and past and potential future climatic changes in mountain regions: A review. Mountain Research and Development 12:71–86. doi:10.2307/3673749.
- Barry, R. G., and R. J. Chorley. 2009. Atmosphere, weather, and climate, 516. 9th ed. Abingdon: Routledge.
- Bell, B. A., W. J. Fletcher, P. D. Hughes, H. L. Cornelissen, D. Fink, and A. Rhoujjati. 2022. Palynological evidence from a sub-alpine marsh of enhanced Little Ice Age snowpack in the Marrakech High Atlas, North Africa. Vegetation History and Archaeobotany 31:49–66. doi:10.1007/s00334-021-00837-y.
- Benabid, A. 1982. Bref aperçu sur la zonation altitudinale de la végétation climacique du Maroc. Ecologia Mediterranea 8:301–15. doi:10.3406/ecmed.1982.1956.
- Bernard, J., and M. Reille. 1987. Nouvelles analyses polliniques dans l’Atlas de Marrakech, Maroc. Pollen et Spores 29:225–40.
- Blandford, T. R., K. S. Humes, B. J. Harshburger, B. C. Moore, V. P. Walden, and H. Ye. 2008. Seasonal and synoptic variations in near-surface air temperature lapse rates in a mountainous basin. Journal of Applied Meteorology and Climatology 47:249–61. doi:10.1175/2007JAMC1565.1.
- Bormann, K. J., S. Westra, J. P. Evans, and M. F. McCabe. 2013. Spatial and temporal variability in seasonal snow density. Journal of Hydrology 484:63–73. doi:10.1016/j.jhydrol.2013.01.032.
- Born, K., A. H. Fink, P. Knippertz. 2010. Meteorological processes influencing the weather and climate of Morocco. In Impacts of global change on the Hydrological Cycle in West and Northwest Africa, ed. P. Speth, M. Christoph, M. Diekkruger, B. M, A. H. Fink, T. Goldbach, and M. Rossler, 150–63. Berlin: Springer. doi:10.1007/978-3-642-12957-5.
- Born, K., A. H. Fink, and H. Paeth. 2008a. Dry and wet periods in the northwestern Maghreb for present day and future climate conditions. Meteorologische Zeitschrift 17:533–51. doi:10.1127/0941-2948/2008/0313.
- Born, K., K. Piecha, A. H. Fink, O. Schulz, M. Judex. 2008b. Shifting climate zones in the northwestern Maghreb. In IMPETUS Atlas Morocco, ed. O. Schulz and M. Judex, 13–14. Germany: Department of Geography, University of Bonn.
- Boudhar, A., G. Boulet, L. Hanich, J. E. Sicart, and A. Chehbouni. 2016. Energy fluxes and melt rate of a seasonal snow cover in the Moroccan High Atlas. Hydrological Sciences Journal 61:931–43. doi:10.1080/02626667.2014.965173.
- Boudhar, A., L. Hanich, G. Boulet, B. Duchemin, B. Berjamy, and A. Chehbouni. 2009. Evaluation du modèle snowmelt runoff dans le Haut Atlas Marocain en utilisant deux estimations des surfaces enneigées. Hydrological Sciences Journal 54:1094–113. doi:10.1623/hysj.54.6.1094.
- Brunt, D. 1933. The adiabatic lapse-rate for dry and saturated air. Quarterly Journal of the Royal Meteorological Society 59:351–60. doi:10.1002/qj.49705925204.
- Collados-Lara, A. J., E. Pardo-Igúzquiza, D. Pulido-Velazquez, and J. Jiménez-Sánchez. 2018. Precipitation fields in an alpine Mediterranean catchment: Inversion of precipitation gradient with elevation or undercatch of snowfall? International Journal of Climatology 38:3565–78. doi:10.1002/joc.5517.
- Córdova, M., R. Célleri, C. J. Shellito, J. Orellana-Alvear, A. Abril, and G. Carrillo-Rojas. 2016. Near-surface air temperature lapse rate over complex terrain in the southern Ecuadorian Andes: Implications for temperature mapping. Arctic, Antarctic, and Alpine Research 48:673–84. doi:10.1657/AAAR0015-077.
- Cortemiglia, G. C. 1989. Validitadell’elaborazione statistica nel calcolo del gradiente termico verticale in valle Scrivia. Julia Dertona 68:63–84.
- Coulter, J. D. 1967. Mountain Climate. New Zealand Ecological Society 14:40–57.
- Couvreur, G. 1966. Les formations périglaciaires du Haut Atlas central marocain. Revue de Géographie Du Maroc 10:47–50.
- Daly, C., R. P. Neilson, and D. L. Phillips. 1994. A statistical-topographic model for mapping climatological precipitation over mountainous terrain. Journal of Applied Meteorology 33:140–58. doi:10.1175/1520-0450(1994)033<0140:ASTMFM>2.0.CO;2.
- de Jong, C., S. Cappy, M. Finckh, and D. Funk. 2008. A transdisciplinary analysis of water problems in the mountainous karst areas of Morocco. Engineering Geology 99:228–38. doi:10.1016/j.enggeo.2007.11.021.
- De Podesta, M., S. Bell, and R. Underwood. 2018. Air temperature sensors: Dependence of radiative errors on sensor diameter in precision metrology and meteorology. Metrologia 55:229–44. doi:10.1088/1681-7575/aaaa52.
- Diao, X., A. Dinar, T. Roe, and Y. Tsur. 2008. A general equilibrium analysis of conjunctive ground and surface water use with an application to Morocco. Agricultural Economics 38:117–35. doi:10.1111/j.1574-0862.2008.00287.x.
- Dorji, U., J. E. Olesen, P. K. Bøcher, and M. Solveig Seidenkrantz. 2016. Spatial variation of temperature and precipitation in Bhutan and links to vegetation and land cover. Mountain Research and Development 36:66–79. doi:10.1659/MRD-JOURNAL-D-15-00020.1.
- Dozier, J., E. H. Bair, and R. E. Davis. 2016. Estimating the spatial distribution of snow water equivalent in the world’s mountains. WIREs Water 3:461–74. doi:10.1002/wat2.1140.
- Eklund, L., C. Romankiewicz, M. Brandt, M. Doevenspeck, and C. Samimi. 2016. Data and methods in the environment-migration nexus: A scale perspective. Erde 147:139–52. doi:10.12854/erde-147-10.
- Esper, J., E. R. Cook, and F. H. Schweingruber. 2002. Low-frequency signals in long tree-ring chronologies for reconstructing past temperature variability. Science 295:2250–53. doi:10.1126/science.1066208.
- Fathi, N., L. Bounoua, and M. Messouli. 2019. A satellite assessment of the urban heat island in Morocco. Canadian Journal of Remote Sensing 45:26–41. doi:10.1080/07038992.2019.1601007.
- Fiddes, J., and S. Gruber. 2014. TopoSCALE v.1.0: Downscaling gridded climate data in complex terrain. Geoscientific Model Development 7:387–405. doi:10.5194/gmd-7-387-2014.
- Fink, A. H., M. Christoph, K. Born, T. Brucher, K. Piecha, S. Pohle, O. Schulz, and V. Ermert. 2010. Climate. In Impacts of global change on the hydrological cycle in West and Northwest Africa, ed. P. Speth and B. Diekkruger, 54–58. Heidelberg, Germany: Springer.
- Griffith, B. D., and T. B. McKee. 2000. Rooftop and ground standard temperatures: A comparison of physical differences. Climatology Report 00-2.
- Gugerli, R., M. Guidicelli, M. Gabella, M. Huss, and N. Salzmann. 2021. Multi-sensor analysis of monthly gridded snow precipitation on alpine glaciers. Advances in Science and Research 18:7–20. doi:10.5194/asr-18-7-2021.
- Haeberli, W. 1985. Creep of mountain permafrost: internal structure and flow of alpine rock glaciers. Mitteilungen Der Versuchsanstalt Für Wasserbau. Hydrologie Und Glaziologie Der ETH Zürich 77:1–142.
- Hannah, G., P. D. Hughes, and P. L. Gibbard. 2017. Pleistocene plateau ice fields in the High Atlas, Morocco. Geological Society, London, Special Publications 433:25–53. doi:10.1144/SP433.12.
- He, Y., and K. Wang. 2020. Contrast patterns and trends of lapse rates calculated from near-surface air and land surface temperatures in China from 1961 to 2014. Science Bulletin 65:1217–24. doi:10.1016/j.scib.2020.04.001.
- Houston, A. L., and D. Niyogi. 2007. The sensitivity of convective initiation to the lapse rate of the active cloud-bearing layer. Monthly Weather Review 135:3013–32. doi:10.1175/MWR3449.1.
- Hughes, P. D. 2018. Little Ice Age glaciers and climate in the Mediterranean mountains: A new analysis. Geographical Research Letters 44:15–45. doi:10.18172/cig.3362.
- Hughes, P. D., D. Fink, W. J. Fletcher. 2021. Late Pleistocene glaciers and climate in the High Atlas, North Africa. In Untangling the Quaternary Period—A Legacy of Stephen C. Porter, ed. R. B. Waitt, G. D. Thackray, and A. R. Gillespie, eds., pp.155–174. Boulder: The Geological Society of America, Inc. doi:10.1130/2020.2548(08).
- Hughes, P. D., D. Fink, Á. Rodés, C. R. Fenton, and T. Fujioka. 2018. 10Be and 36Cl exposure ages and palaeoclimatic significance of glaciations in the High Atlas, Morocco. Quaternary Science Reviews 180:193–213. doi:10.1016/j.quascirev.2017.11.015.
- Hughes, P. D., W. J. Fletcher, B. A. Bell, R. J. Braithwaite, H. L. Cornelissen, D. Fink, and A. Rhoujjati. 2020. Late Pleistocene glaciers to present-day snowpatches: A review and research recommendations for the Marrakech High Atlas. Mediterranean Geoscience Reviews 2:163–84. doi:10.1007/s42990-020-00027-4.
- Immerzeel, W. W., A. F. Lutz, M. Andrade, A. Bahl, H. Biemans, T. Bolch, and J. E. M. Baillie. 2020. Importance and vulnerability of the world’s water towers. Nature 577:364–69. doi:10.1038/s41586-019-1822-y.
- Jarlan, L., S. Khabba, S. Er-Raki, M. Le Page, L. Hanich, Y. Fakir, and R. Escadafal. 2015. Remote sensing of water resources in semi-arid Mediterranean areas: The joint international laboratory TREMA. International Journal of Remote Sensing 36:4879–917. doi:10.1080/01431161.2015.1093198.
- Jevons, W. S. 1861. On the deficiency of rain in an elevated rain-gauge, as caused by wind. The London, Edinburgh, and Dublin Philosophical Magazine and Journal of Science 22:421–33. doi:10.1080/14786446108643180.
- Kattel, D. B., T. Yao, W. Yang, Y. Gao, and L. Tian. 2015. Comparison of temperature lapse rates from the northern to the southern slopes of the Himalayas. International Journal of Climatology 35:4431–43. doi:10.1002/joc.4297.
- Knippertz, P. 2003. Tropical–extratropical interactions causing precipitation in Northwest Africa: Statistical analysis and seasonal Variations. Monthly Weather Review 131:3069–76. doi:10.1175/1520-0493(2003)131<3069:TICPIN>2.0.CO;2.
- Knippertz, P., M. Christoph, and P. Speth. 2003. Long-term precipitation variability in Morocco and the link to the large-scale circulation in recent and future climates. Meteorology and Atmospheric Physics 83:67–88. doi:10.1007/s00703-002-0561-y.
- Kuhn, M. caret: Classification and Regression Training. v6.0-90, R. 2021. https://CRAN.R-project.org/package=caret
- Lagouvardos, K., V. Kotroni, A. Bezes, I. Koletsis, T. Kopania, S. Lykoudis, N. Mazarakis, K. Papagiannaki, and S. Vougioukas. 2017. The automatic weather stations NOANN network of the National Observatory of Athens: Operation and database. Geoscience Data Journal 4:4–16. doi:10.1002/gdj3.44.
- Lamb, P. J., M. E. L. Hamly, and D. H. Portis. 1997. North-Atlantic Oscillation. Geo Observateur 7:103–13.
- Legates, D. R., and C. J. Willmott. 1990. Mean seasonal and spatial variability in global surface air temperature. Theoretical and Applied Climatology 41:11–21. doi:10.1007/BF00866198.
- Li, X., L. Wang, D. Chen, K. Yang, B. Xue, and L. Sun. 2013. Near-surface air temperature lapse rates in the mainland China during 1962-2011. Journal of Geophysical Research Atmospheres 118:7505–15. doi:10.1002/jgrd.50553.
- Lionello, P., P. Malanotte-Rizzoli, R. Boscolo, P. Alpert, V. Artale, L. Li, J. Luterbacher, W. May, R. Trigo, M. Tsimplis, et al. 2006. The Mediterranean climate: An overview of the main characteristics and issues. Developments in Earth and Environmental Sciences 4:1–26. doi:10.1016/S1571-9197(06)80003-0.
- Lute, A. C., and J. T. Abatzoglou. 2021. Best practices for estimating near-surface air temperature lapse rates. International Journal of Climatology 41:E110–E125. doi:10.1002/joc.6668.
- Marchane, A., Y. Tramblay, L. Hanich, D. Ruelland, and L. Jarlan. 2017. Climate change impacts on surface water resources in the Rheraya catchment (High Atlas, Morocco). Hydrological Sciences Journal 62:979–95. doi:10.1080/02626667.2017.1283042.
- Marshall, S. J., M. J. Sharp, D. O. Burgess, and F. S. Anslow. 2007. Near-surface-temperature lapse rates on the Prince of Wales Icefield, Ellesmere Island, Canada: Implications for regional downscaling of temperature. International Journal of Climatology 27:385–98. doi:10.1002/joc.1396.
- Meløysund, V., B. Leira, K. V. Høiseth, and K. R. Lisø. 2007. Predicting snow density using meteorological data. Meteorological Applications 14:413–23. doi:10.1002/met.40.
- Messerli, B., and M. Winiger. 1992. Climate, environmental change, and resources of the African mountains from the Mediterranean to the equator. Mountain Research & Development 12:315–36. doi:10.2307/3673683.
- Michalet, R. 1991. Une approche synthétique biopédoclimatique des montagnes méditerranéennes: Exemple du Maroc septentrional. Thesis, Université Joseph Fourier (Grenoble). January 1.
- Minder, J. R., P. W. Mote, and J. D. Lundquist. 2010. Surface temperature lapse rates over complex terrain: Lessons from the Cascade Mountains. Journal of Geophysical Research Atmospheres 115:1–13. doi:10.1029/2009JD013493.
- N’da, A. B., L. Bouchaou, B. Reichert, L. Hanich, Y. Ait Brahim, A. Chehbouni, and J. L. Michelot. 2016. Isotopic signatures for the assessment of snow water resources in the Moroccan High Atlas mountains: Contribution to surface and groundwater recharge. Environmental Earth Sciences 75:1–11. doi:10.1007/s12665-016-5566-9.
- Navarro-Serrano, F., J. I. López-Moreno, C. Azorin-Molina, E. Alonso-González, M. Tomás-Burguera, A. Sanmiguel-Vallelado, and S. M. Vicente-Serrano. 2018. Estimation of near-surface air temperature lapse rates over continental Spain and its mountain areas. International Journal of Climatology 38:3233–49. doi:10.1002/joc.5497.
- Nicholson, S. E., C. Funk, and A. H. Fink. 2018. Rainfall over the African continent from the 19th through the 21st century. Global and Planetary Change 165:114–27. doi:10.1016/J.GLOPLACHA.2017.12.014.
- Noin, D. 1963. Types de temps d’été au Maroc. Annales de Géographie 72:1–12.
- O.R.S.T.O.M (Office de la Recherche Scientifique et Technique Outre-Mer). 1976. Hydrologie du bassin du Tensift. Paris: Rabat.
- Ozenda, P. 1975. Sur les étages de végétation. Documents Cartographiques Ecologiques XVI:1–32.
- Pepin, N., R. S. Bradley, H. F. Diaz, M. Baraer, E. B. Caceres, N. Forsythe, and D. Q. Yang. 2015. Elevation-dependent warming in mountain regions of the world. Nature Climate Change 5:424–30. doi:10.1038/nclimate2563.
- Pepin, N., and M. Losleben. 2002. Climate change in the Colorado Rocky Mountains: Free air versus surface temperature trends. International Journal of Climatology 22:311–29. doi:10.1002/joc.740.
- Pepin, N., and J. D. Lundquist. 2008. Temperature trends at high elevations: Patterns across the globe. Geophysical Research Letters 35:1–6. doi:10.1029/2008GL034026.
- Pepin, N., and D. J. Seidel. 2005. A global comparison of surface and free-air temperatures at high elevations. Journal of Geophysical Research 110:D03104. doi:10.1029/2004JD005047.
- Pouclet, A., A. Aarab, A. Fekkak, M. Benharref. 2007. Geodynamic evolution of the northwestern Paleo-Gondwanan margin in the Moroccan Atlas at the Precambrian-Cambrian boundary. In The Evolution of the Rheic Ocean: From Avalonian-Cadomian Active Margin to Alleghenian-Variscan Collision, ed. U. Linnemann, R. D. Nance, P. Kraft, and G. Zulauf, Vol. 423. Boulder: Geological Society of America. doi:10.1130/2007.2423(02).
- R Core Team. 2021. R: A Language and Environment for Statistical Computing. Vienna, Austria: R Foundation for Statistical Computing. https://www.R-project.org/
- Rabin, R. M., S. Stadler, P. J. Wetzel, D. J. Stensrud, and M. Gregory. 1990. Observed effects of landscape variability on convective clouds. Bulletin - American Meteorological Society 71:272–80. doi:10.1175/1520-0477(1990)071<0272:OEOLVO>2.0.CO;2.
- Rangwala, I., and J. R. Miller. 2012. Climate change in mountains: A review of elevation-dependent warming and its possible causes. Climatic Change 114:527–47. doi:10.1007/s10584-012-0419-3.
- Rhanem, M. 2011. Aridification du climat régional et remontée de la limite inférieure du cèdre de l’Atlas (Cedrus atlantica Manetti) aux confins de la plaine de Midelt (Maroc). Physio-Géo 5:143–65. doi:10.4000/physio-geo.1983.
- Roche, M. 1963. Hydrologie de surface. Paris: O.R.S.T.O.M. 430 pp.
- Roebber, P. J., S. L. Bruening, D. M. Schultz, and J. V. Cortinas. 2003. Improving snowfall forecasting by diagnosing snow density. Weather and Forecasting 18:264–87. doi:10.1175/1520-0434(2003)018<0264:ISFBDS>2.0.CO;2.
- Rolland, C. 2003. Spatial and seasonal variations of air temperature lapse rates in alpine regions. Journal of Climate 16:1032–46. doi:10.1175/1520-0442(2003)016<1032:SASVOA>2.0.CO;2.
- Schulz, O. 2007. Analyse schneehydrologischer Prozesse und Schneekartierung im Einzugsgebiet des Oued M’Goun, Zentraler Hoher Atlas (Marokko). Universitäts-und Landesbibliothek, Bonn, Germany.
- Shen, Y., Y. Shen, J. Goetz, and A. Brenning. 2016. Spatial‐temporal variation of near‐surface temperature lapse rates over the Tianshan Mountains, Central Asia. Journal of Geophysical Research: Atmospheres 121:14,006–14,017. doi:10.1002/2016JD025711.
- Simonneaux, V., L. Hanich, G. Boulet, and S. Thomas. 2008. Modelling runoff in the Rheraya Catchment (High Atlas, Morocco) using the simple daily model GR4J. Trends over the last decades. In 13th IWRA World Water Congress, Montpellier, France.
- Stone, P. H., and J. H. Carlson. 1979. Atmospheric lapse rate regimes and their parameterization. Journal of the Atmospheric Sciences 36:415–23. doi:10.1175/1520-0469(1979)036<0415:ALRRAT>2.0.CO;2.
- Trigo, R. M., T. J. Osborn, and J. M. Corte-Real. 2002. The North Atlantic Oscillation influence on Europe: Climate impacts and associated physical mechanisms. Climate Research 20:9–17. doi:10.3354/CR020009.
- Troll, C. 1973. High mountain belts between the polar caps and the equator: Their definition and lower limit. Arctic and Alpine Research 5:19–27.
- Tuel, A., A. Chehbouni, and E. A. B. Eltahir. 2008a. Dynamics of seasonal snowpack over the High Atlas. Journal of Hydrology 125657. doi:10.1016/j.jhydrol.2020.125657.
- Tuel, A., and E. A. B. Eltahir. 2018. Seasonal precipitation forecast over Morocco. Water Resources Research 54:9118–30. doi:10.1029/2018WR022984.
- Tuel, A., N. E. Moçayd, M. D. Hasnaoui, and E. A. B. Eltahir. 2008b. Future projections of High Atlas snowpack and runoff under climate change [Preprint]. Hydrology and Earth System Sciences.
- Vieira, G., C. Mora, and A. Faleh. 2017. New observations indicate the possible presence of permafrost in North Africa (Djebel Toubkal, High Atlas, Morocco). Cryosphere 11:1691–705. doi:10.5194/tc-11-1691-2017.
- Viviroli, D., H. H. Dürr, B. Messerli, M. Meybeck, and R. Weingartner. 2007. Mountains of the world, water towers for humanity: Typology, mapping, and global significance. Water Resources Research 43:1–13. doi:10.1029/2006WR005653.
- Wortmann, M., T. Bolch, C. Menz, J. Tong, and V. Krysanova. 2018. Comparison and correction of high-mountain precipitation data based on glacio-hydrological modeling in the Tarim river headwaters (High Asia). Journal of Hydrometeorology 19:777–801. doi:10.1175/JHM-D-17-0106.1.
- Zkhiri, W., Y. Tramblay, L. Hanich, L. Jarlan, and D. Ruelland. 2019. Spatiotemporal characterization of current and future droughts in the High Atlas basins (Morocco). Theoretical and Applied Climatology 135:593–605. doi:10.1007/s00704-018-2388-6.