
Abstract
Hypoxia-inducible factor-1 (HIF-1) is one of the most promising pharmacological targets for all types of cancer, including ovarian cancer. Ovarian clear cell carcinoma (OCCC) has poor prognosis because of its insensitivity to chemotherapy. To elucidate the characteristics of this troublesome cancer, we examined HIF-1α expression under normoxia or hypoxia in various ovarian cancer cell lines. HIF-1α was highly expressed under normoxia only in RMG-1, an OCCC cell line. To examine whether HIF-1 is involved in the tumorigenesis of RMG-1 cells, we established HIF-1α-silenced cells, RMG-1HKD. The proliferation rate of RMG-1HKD cells was faster than that of RMG-1 cells. Furthermore, the activity of MEK/ERK in the Ras pathway increased in RMG-1HKD cells, whereas that of mTOR in the PI3K pathway did not change. Activation of the Ras pathway was attributable to the increase in phosphorylated MEK via PP2A inactivation. To confirm the crosstalk between the PI3K and Ras pathways in vivo, RMG-1 or RMG-1HKD cells were transplanted into the skin of nude mice with rapamycin (an inhibitor of mTOR), PD98059 (an inhibitor of MEK), or both. RMG-1HKD cells showed higher sensitivity to PD98059 than that observed in RMD-1 cells, whereas the combination therapy resulted in synergistic inhibition of both cells. These findings suggest that inhibition of HIF-1, a downstream target of mTOR in the PI3K pathway, activates the Ras pathway on account of the increase in MEK phosphorylation via PP2A inactivation, and the crosstalk between the 2 pathways could be applied in the combination therapy for HIF-1-overexpressing cancers such as OCCC.
Abbreviations
| ERK | = | extracellular signal-regulated kinase |
| 4E-BP | = | eukaryotic initiation factor 4E-binding-protein |
| HIF-1 | = | hypoxia-inducible factor-1 |
| MEK | = | mitogen-activated kinase/extracellular signal-regulated kinase kinase |
| PI3K | = | phosphatidylinositol 3-kinase |
| mTOR | = | mammalian target of rapamycin |
| pVHL | = | von Hippel–Lindau protein |
| OCCC | = | ovarian clear cell carcinoma |
| OE | = | ovarian endometrioid carcinoma |
| OM | = | ovarian mucinous carcinoma |
| OS | = | ovarian serous carcinoma |
| RCC | = | renal cell carcinoma |
| RCCC | = | renal clear cell carcinoma |
| S6K | = | p70 ribosomal S6 kinase |
| PP2A | = | protein phosphatase 2A |
Introduction
Ovarian cancer is the fourth most common cause of cancer death among women in the United States, with more than 22,240 new cases diagnosed and 14,030 deaths estimated to have occurred in 2013.Citation1 Ovarian cancer is divided into biologically distinct histological subtypes: ovarian serous carcinoma (OS), ovarian endometrioid carcinoma (OE), ovarian mucinous carcinoma (OM), and ovarian clear cell carcinoma (OCCC). Among these 4 subtypes, OCCC is relatively resistant to standard chemotherapy, a combination of paclitaxel and platinum based drugs, resulting in poorer prognosis than the other subtypes.Citation2 Therefore, there is an urgent need to develop a novel therapy for OCCC.
Molecular target drugs have been developed against cancer. The PI3K/Akt/mTOR pathway (PI3K pathway) and the Ras/Raf/MEK/Erk1/2 pathway (Ras pathway) are 2 of the most common dysregulated kinase cascades in human cancer and are considered as potential drug targets.Citation3 In ovarian cancer, the aberrant activation of the PI-3 kinase pathway was associated with a poor prognosis.Citation4
Mammalian target of rapamycin (mTOR) is a serine/threonine kinase and a component of mTORC1 and mTORC2, which have been shown to be involved in the onset and progression of diabetes, cancer, and agingCitation5 via the downstream targets including hypoxia-inducible factor-1 (HIF-1).Citation6,7
HIF-1, which is composed of 2 subunits, α and β, activates the transcription of various genes that code for proteins involved in angiogenesis, glucose metabolism, and cell proliferation.Citation7 An increased activity in solid tumors has been reported previously.Citation6 The β subunit is constitutively expressed, whereas the α subunit is regulated by the concentration of oxygen in a ubiquitin-dependent manner via the E3 ligase pVHL,Citation8 which is a von Hippel–Lindau tumor suppressor. Genetic and epigenetic alterations in the VHL gene have been detected in most sporadic renal cell carcinomas, including renal clear cell carcinoma (RCCC).Citation9 The role of VHL mutations in the etiology of OCCC remains elusive. HIF-1α expression is regulated not only by its degradation but also by its synthesis. It has been earlier proposed that HIF-1α synthesis in OCCC is mainly regulated by activation of the PI3K pathway.Citation7 Although it is not the case of OCCC, we have previously reported that the activation of the PI3K pathway via cisplatin, a platinum-based anti-cancer drug, in cisplatin-resistant ovarian cancers resulted in overexpression and nuclear accumulation of HIF-1α.Citation10
Rapamycin analogs, mTOR inhibitors, such as orally administered everolimus and intravenously administered temsirolimus have been used in the treatment of advanced renal cell carcinomas and are currently considered as a potential therapeutic regimen for OCCC. The biggest problem of molecular target drugs is the occurrence of resistance. Inhibition of mTOR paradoxically activates the phosphorylation of Akt and eIF4,Citation11 and the PI3K and Ras pathways are known to interact with each other.Citation12 It has been reported that biopsy-accessible solid tumors of advanced disease treated with everolimus have a higher level of activation of the ERK pathway that follows in an administration schedule-dependent manner.Citation13 However, the mechanisms by which the 2 pathways regulate each other remain unclear.
To gain insight into the effect of HIF-1 inhibition on tumor progression, we evaluated the effect of HIF-1α on cell or tumor growth in vitro and in vivo using the HIF-1α-silenced human OCCC cell line, RMG-1. We also investigated the mechanisms by which the PI3K and Ras pathways interact and regulate each other. Furthermore, we assessed the utility of a combination therapy using molecular target drugs in the treatment of HIF-1-overexpressing cancers such as OCCC.
Results
High expression level of HIF-1α in the human OCCC cell line RMG-1 under normoxia
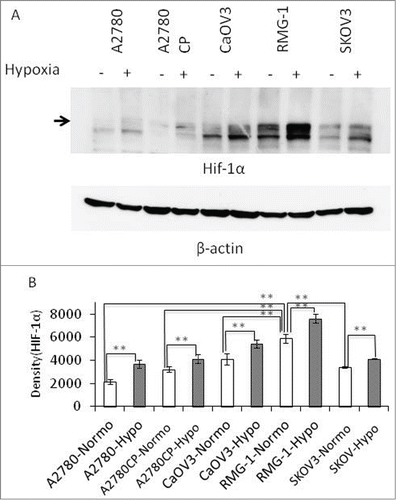
mTOR is considered a therapeutic target for various cancers such as renal cell carcinoma and OCCC.Citation14,15 On the other hand, HIF-1α is known to be involved in the progression of various cancers, including ovarian cancer, and is highly expressed in certain types of cancers.Citation7,16 Using 5 human ovarian cancer cell lines, A2780, A2780CP (a cisplatin-resistant clone of A2780),Citation17 CaOV3, SKOV3, and RMG-1, we examined the expression of HIF-1α under normoxia or hypoxia, because this protein has been reported as stable during hypoxia.Citation7 The RMG-1 cell line is an OCCC, whereas the others are OSs. As expected, HIF-1α expression was upregulated in all 5 cell lines under hypoxia compared with that under normoxia (). However, HIF-1α expression under normoxia varied among the 5 cell lines. The expression level of HIF-1α in RMG-1 cells, the only OCCC cell line among the 5 cell lines, under normoxia was significantly higher than that in the other 4 OS cell lines.
Figure 1. HIF-1α expression in various human ovarian cancer cell lines. Five cell lines, A2780, A2780CP, CaOV3, RMG-1, and SKOV3, were placed in a hypoxic chamber (2% O2, 5% CO2, and 37°C) for 6 h. (A) The cells were lysed and electrophoresed, followed by Western blot analyses using anti-HIF-1α and anti-β-actin Abs. (B) The result in Figure 1A was analyzed densitometrically and processed statistically using JMP software (SAS Institute Inc., Cary, NC). (**: P < 0.01).
mTOR inhibition by rapamycin suppressed the expression level of HIF-1α in RMG-1 cells
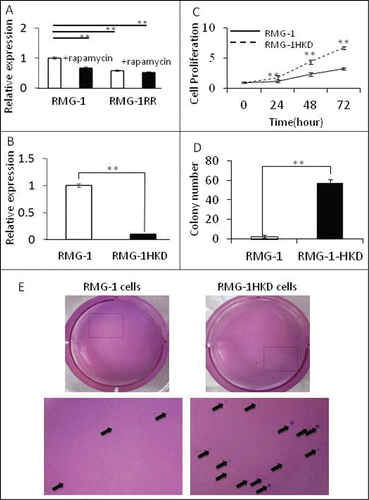
To elucidate the role of mTOR in HIF-1α expression in the OCCC cell line RMG-1 during normoxia, we treated intact RMG-1 cells with rapamycin (an inhibitor of mTOR) for 24 h and examined the expression of HIF-1α using real-time PCR analysis. At the same time, we also evaluated the expression of HIF-1α in RMG-1RR cells, a rapamycin-insensitive RMG-1 clone. HIF-1α expression was significantly suppressed in RMG-1 cells after rapamycin treatment for 24 h (). Conversely, the expression of HIF-1α in RMG-RR cells was lower at baseline than that in intact RMG-1 cells and did not change following treatment with rapamycin ().
Figure 2. Comparison of RMG-1, RMG-1RR, and RMG-1HKD cells. (A) HIF-1α expression in RMG-1 and RMG-1RR cells. HIF-1α expression was measured by real-time PCR. RMG-1 and RMG-1RR cells were plated overnight, exposed to 100 nM of rapamycin for 24 h, and then subjected to real-time PCR using the extracted RNAs. HIF-1α expression in RMG-1 cells was calculated to be 1. (B) HIF-1α expression in RMG-1 and RMG-1HKD cells. HIF-1α expression in RMG-1 and RMG-1HKD cells was analyzed by real-time PCR as described in (A). (C) The proliferation rate of RMG-1 and RMG-1HKD cells was examined using a cell counting kit-8 (Wako Pure Chemical Industries, Osaka, Japan). (D) Colony formation assay of RMG-1 and RMG-1HKD cells. For the colony formation assay, a 2-layer method was used. The number of colonies was manually counted at 4 weeks after colony formation. The experiments were performed in replicates. The colony numbers are presented as a bar graph. (E) Representative images of RMG-1- and RMG-1HKD-derived colonies. The areas marked by squares are magnified and designated at the bottom. All statistics analyses were performed using JMP software (SAS Institute Inc.). (**: P < 0.01).
RMG-1KHD cells showed a higher proliferation rate than intact RMG-1 cells
The observed HIF-1α suppression by rapamycin suggested that the expression of HIF-1α in intact RMG-1 cells under normoxia was upregulated by mTOR. To gain insights into the role of HIF-1 in OCCC, we prepared HIF-1α-silenced RMG-1 (RMG-1HKD) cells. The expression of HIF-1α in RMG-1HKD cells was significantly lower than that observed in intact RMG-1 cells (approximately 10% of that observed in intact RMG-1 cells) (). The proliferation rate of intact RMG-1 and RMG-1HKD cells was also investigated. RMG-1HKD cells grew faster than intact RMG-1 cells in both anchorage-dependent () and -independent assays (), suggesting that HIF-1α may play a role not only in mTOR-mediated cancer progression but also in the reciprocal activation of other pathways. A greater size and number of colonies were observed in RMG-HKD cells than in intact RMG-1 cells ().
Decreased PP2A activity induced an increase in the rate of MEK phosphorylation in RMG-1HKD cells
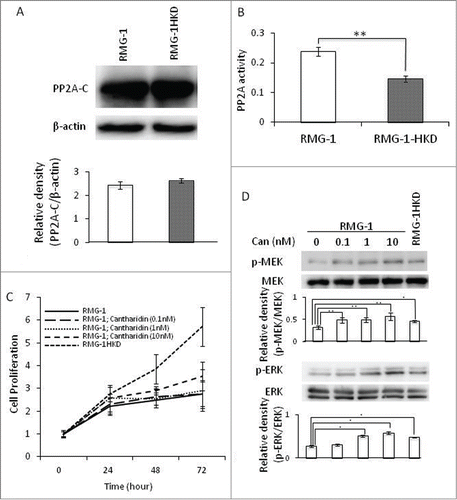
Next, we examined the phosphorylation status of 2 major signaling pathways, the PI3K and Ras pathways, in RMG-1 treated with or without rapamycin for 24 h, RMG-1RR, and RMG-1HKD cells. Rapamycin clearly suppressed the phosphorylation of S6K, a downstream target of mTOR, as well as mTOR in RMG-1 cells (). The silencing of HIF-1α in RMG-1HKD cells did not affect mTOR/S6K activity (), showing that mTOR regulated S6K and HIF-1 separately. The phosphorylation status of Akt, an upstream kinase of mTOR, in RMG-1 cells was similar to that observed in RMG-1RR or RMG-1HKD cells and did not change after the addition of rapamycin (). Based on the phosphorylation status of the Ras pathway, we inferred that the phosphorylation rate of MEK was higher in RMG-1HKD cells (). Because the phosphorylations of Raf-1 and B-Raf, upstream kinases of MEK, did not change in RMG-1HKD cells as well as RMG-1 cells treated with rapamycin for 24 h or RMG-1RR cells compared to RMG-1 cells (), we hypothesized that the change in the phosphorylation status of RMG-1HKD cells may be due to its phosphatase activity. Because protein phosphatase 2A (PP2A) has been shown to play a role in MEK regulation,Citation18 we examined both the expression and activity of PP2A in RMG-1HKD cells. The expression level of PP2A in RMG-1HKD cells was almost comparable to that observed in RMG-1 cells (). In contrast, PP2A activity in RMG-1HKD cells significantly decreased compared with that observed in RMG-1 cells (almost half of the activity) (). These findings suggest that inactivation of PP2A was responsible for the elevated MEK phosphorylation in RMG-1HKD cells.
Figure 3. Western blot analyses of the signaling molecules in the PI3K (A) and Ras (B) pathways in intact RMG-1, RMG-1HKD, and RMG-1 cells treated with 100 nM rapamycin for 24 h, and RMG-1RR cells. The cells were lysed, electrophoresed, blotted onto a PVDF membrane, and hybridized with the indicated Abs. The samples were hybridized with an anti-β-actin Ab as a loading control. Densities of the bands, which were indicated below the results of Western blot analyses, were measured using Quantity One software (Bio-Rad, Hercules, CA). Statistics analyses were performed using JMP software (SAS Institute Inc..). (*: P < 0.05, **: P < 0.01). #: non-specific band for an anti-Phospho-Raf-1 antibody (#9421, Cell Signaling Technology, Danvers, MA).
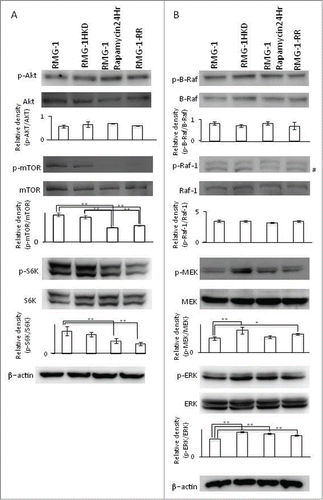
Figure 4. Expression level and activity of PP2A in RMG-1 and RMG-1HKD cells. (A) The expression level of PP2Ac, a catalytic subunit of PP2A. The expression of PP2Ac was examined by Western blot analyses using an anti-PP2Ac Ab in RMG-1 and RMG-1HKD cells. The bands were densitometrically analyzed using Quantity One software (Bio-Rad, Hercules, CA). (B) PP2A activity in RMG-1 and RMG-1HKD cells was measured with a PP2A immunoprecipitation phosphatase assay kit (Millipore, Billerica, MA). (C) The proliferation rate of RMG-1 cells in the presence of cantharidin (0, 0.1, 1, 10 nM) was examined using a cell counting kit-8 (Wako Pure Chemical Industries, Osaka, Japan). (D) Phosphorylations of MEK and ERK were measured in RMG-1 cells in the presence of cantharidin (0, 0.1, 1, 10 nM), a PP2A inhibitor. The phosphorylation and total expression levels of the kinases were examined by Western blot analyses. The bands were also densitometrically analyzed using Quantity One software (Bio-Rad, Hercules, CA). Statistical analyses were performed using JMP software (SAS Institute Inc.). (n = 3 for both (A) and (D), *: P < 0.05, **: P < 0.01).
HIF-1 modulated the proliferation of RMG-1 cells through regulation of the Ras pathway via PP2A
To investigate whether PP2A regulates MEK activity in RMG-1 cells, we exploited cantharidin, a potent and specific inhibitor of PP2A.Citation19 The RMG-1cells were cultured at various concentrations (0, 0.1, 1, 10 nM) of cantharidin, and the proliferation rate was examined with a WST-8 reagent. One or 10 nM of cantharidin significantly increased the proliferation rate of RMG-1 cells at 24 h after the treatment, although it was lower than that of RMG-1HKD cells (, ). The effect of 10 nM cantharidin lasted until 72 h after the treatment (, ). The phosphorylations of MEK and ERK after the cantharidin treatment were also evaluated by Western blot and densitometric analyses. As expected, the amount of phosphorylated -MEK (p-MEK) and –ERK (p-ERK) were elevated in a dose-dependent manner (). Collectively, these results strongly suggest that the suppression of HIF-1α upregulated the proliferation of RMG-1 cells through activation of the Ras pathway via PP2A inhibition.
Table 1. Effect of cantharidin on the proliferation of RMG-1 cells in vitro
Simultaneous inhibition of PI3K and Ras pathways strongly inhibited the proliferation of intact RMG-1 and RMG-1HKD cells
Next, we evaluated the effects of mTOR, MEK inhibitor, or both on the proliferation rate of intact RMG-1 or RMG-1HKD cells. A significant decrease in the proliferation rate of RMG-1 cells was observed using the mTOR inhibitor rapamycin (25 nM) or the MEK inhibitor PD98059 (10 μM), whereas their combination resulted in synergistic inhibition of RMG-1 cell proliferation (, ). The inhibitory effect of each agent or combination of agents on the proliferation of intact RMG-1 cells was evident as early as 24 h after treatment and continued on until 72 h. Although the proliferation rate of RMG-1HKD cells was also inhibited in each treatment (, ), the inhibitory pattern of each inhibitor differed from that observed in intact RMG-1 cells. Consistent with the finding presented in , the proliferation rate of RMG-1HKD cells was higher than that of intact RMG-1 cells at baseline without the inhibitors, and the proliferation rate of both cell lines was similarly inhibited by rapamycin. On the other hand, inhibition of proliferation by PD98059 in RMG-1HKD cells was more efficient than that in intact RMG-1 cells (, ). The elevated phosphorylation of MEK/ERK in RMG-1HKD cells may be responsible for the higher sensitivity to PD98059 than that observed in intact RMG-1 cells. The combination of the 2 inhibitors compromised the proliferation of intact RMG-1 and RMG-1HKD cells (, ).
Table 2. Effect of rapamycin, PD98059, and their combination on the proliferation of RMG-1 cells in vitro
Table 3. Effect of rapamycin, PD98059, and their combination on the proliferation of RMG-1HKD cells in vitro
Figure 5. Effect of rapamycin, PD98059, and the combination of rapamycin with PD98059 on the growth of (A, C) RMG-1 and (B, D) RMG-1HKD (A, B) cells in vitro and (C, D) in vivo. (A, B) RMG-1 and RMG-1HKD cells were treated with 10 μM PD98059, 25 nM rapamycin, or both for the indicated periods. Cell proliferation was measured using the WST-8 assay. Injection of rapamycin or PD98059 suppressed the growth of both cell lines, although the growth of RMG-1HKD cells was significantly more sensitive to PD98059 than that of RMG-1 cells. The combination of the 2 drugs synergistically suppressed the growth of both cell lines. (C, D) The cells (density: 5 × 10⁶ cells in 100 μL PBS) were subcutaneously implanted into the backs of female Balb/c nu/nu mice (5 weeks of age). After 1 week, the tumor reached a certain size, as described in the “Materials and Methods” section, and the indicated concentrations of each drug were injected intraperitoneally twice a week for 4 weeks. The tumor volume was recorded once a week for a total of 5 weeks.
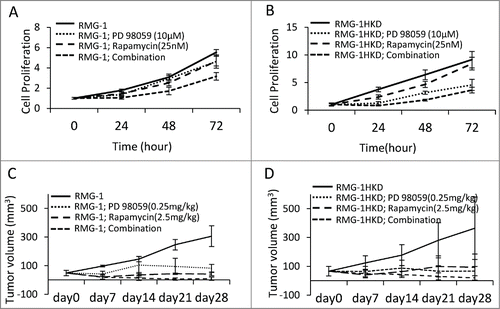
Simultaneous inhibition of PI3K and Ras pathways strongly inhibited the proliferation of intact RMG-1 or RMG-1HKD cells in vivo
and B show that the combination of rapamycin and PD98059 strongly inhibited the proliferation of both intact RMG-1 and RMG-1HKD cells in vitro. To confirm whether this observation also occurs in vivo, a subcutaneous transplant mouse model was used in the next experiment. Either intact RMG-1 or RMG-1HKD cells were subcutaneously implanted into the backs of nude mice (Balb/c nu/nu). Once the tumor reached 50 mm3 in volume, rapamycin, PD98059, or both were injected intraperitoneally every 3 d for 4 weeks. The tumor volume was recorded every week. After 4 weeks, the tumor volume generated by intact RMG-1 cells in the absence of inhibitors reached approximately 300 mm3 (). Although the injection of either rapamycin or PD98059 also inhibited tumor growth, a combination of the 2 inhibitors suppressed tumor growth more efficiently (, ), consistent with our in vitro data (). The same result was observed in RMG-1HKD cell-implanted mice (, ), except that PD98059 was more effective in RMG-1HKD cells than in RMG-1 cells (), which is also consistent with our in vitro findings (). The observation that PD98059 was more effective in RMG-1HKD cells appears quite reasonable because MEK activity was higher in RMG-1HKD cells than in intact RMG-1 cells ().
Table 4. Effect of rapamycin, PD98059, and their combination on the tumor formation of RMG-1 cells in vivo
Table 5. Effect of rapamycin, PD98059, and their combination on the tumor formation of RMG-1HKD cells in vivo
Discussion
The PI3K and Ras pathways are the major signaling pathways for cell proliferation and survival. Abnormalities involving these pathways have been reported in various cancers.Citation20,21 Higher PI3K activity has been reported in 40% of ovarian cancer patients,Citation21 implicating that PI3K may be a major oncogenic gene in ovarian cancer. Although prognoses vary among tissue types, OCCC has been strongly associated with poor patient outcomes. Mutations in PIK3CA, which encodes for the catalytic subunit of PI3K, has been reported in 20%–30% of OCCC patients.Citation22,23 Following the approval of the application of VEGF inhibitor, bevacizumab, in ovarian cancer, clinical tests for combination therapies using conventional drugs and a single therapy of an mTOR inhibitor, temsirolimus, are currently in progress. mTOR inhibitors are expected to be effective, particularly for PIK3CA OCCC, which features an upregulated PI3K pathway.
To gain insight into the overall effects of mTOR inhibitors on OCCC, we evaluated the effect of rapamycin on the gene expression of signaling molecules in RMG-1 cells. We focused on HIF-1α, a downstream target of mTOR. This molecule is involved in cancer progression not only in hypoxic conditions as a pivotal molecule in the Warburg effectCitation24 but also in normoxic conditions.Citation25 The PI3K pathway plays an important role, particularly in normoxic conditions.Citation25
Rapamycin treatment of RMG-1 cells for 24 h in normoxic conditions resulted in downregulation of HIF-1α, suggesting a suppressed PI3K pathway (). A pVHL-dependent pathway regulated the degradation of HIF-1α. RCCC is associated with the tumor suppressor gene VHL, which is inactivated in 90% of sporadic tumors.Citation26 Because VHL mutations have not been well studied in ovarian cancer, we screened for VHL mutations in RMG-1 cells. No VHL mutation was detected within the open reading frame of RMG-1 cells (data not shown), indicating that the high expression of HIF-1α may be a result of protein synthesis, not degradation. In terms of protein synthesis, the observed upregulation of HIF-1α may be due to the activation of eIF4E via the phosphorylation of 4E-BP, which is a downstream target of mTOR. Thus, the PI3K pathway may be closely involved in the upregulation of HIF-1α in normoxic conditions.
HIF-1α was suppressed in RMG-1RR as well as in RMG-1 cells after rapamycin treatment (). MEK/ERK was activated in both cell lines, whereas mTOR/S6K was inactivated (), implicating that the transient or persistent suppression of mTOR induced activation of the Ras pathway, which may inhibit the PI3K pathway, including mTOR, HIF-1, and S6K.Citation12 Although it has been reported that S6K plays a pivotal role in the feedback mechanism of the PI3K pathway,Citation27 HIF-1, another downstream of mTOR, may play a role in the crosstalk between the PI3K and Ras pathways ,Citation12 not in the feedback mechanism. This hypothesis was further supported by the data shown in .
Because the HIF-1 mechanism for crosstalk between the PI3K and Ras pathways remains unknown, we first examined the phosphorylation of signaling molecules of both pathways in RMG-1 and RMG-1HKD cells. The results showed that the phosphorylation of MEK and downstream ERK was augmented in RMG-1HKD cells compared with that observed in RMG-1 cells (). The phosphorylations of B-Raf and Raf-1, upstream kinases of MEK/ERK in the Ras pathway, did not change in RMG-1HKD cells (), indicating that HIF-1α suppresses MEK and the downstream ERK. We next examined PP2A, one of the major serine/threonine phosphatases involved in the regulation of the Ras pathway. The regulatory effects of PP2A on the Ras pathway vary among cells and tissues.Citation28 A previous study showed that MEK was hyperphosphorylated, whereas PP2A was downregulated upon ERK silencing by siRNA in human lung fibroblasts.Citation18 In neuronal PC12, rat pheochromocytoma cells, PP2A could also dephosphorylate Raf-1 kinase Citation29 or ERK. Citation30 Neither Raf-1 or B-Raf may be the substrate for PP2A in RMG-1 cells, because we couldn't detect any changes in the phosphorylation status of Raf-1 as well as that of B-Raf in RMG-1HKD cells, in which PP2A was suppressed, in comparison with RMG-1 cells (). The expression level of PP2Ac, a catalytic subunit of PP2A, in RMG-1HKD cells, did not change compared with that observed in RMG-1 cells, whereas its activity significantly decreased (), implicating that HIF-1 inhibition may regulate the Ras pathway by MEK activation via PP2A inactivation. To confirm the speculation, RMG-1 cells were treated with cantharidin, a specific inhibitor of PP2A. The result revealed that the treatment resulted in higher phosphorylations of MEK and ERK and cell proliferation rate in RMG-1 cells in a dose dependent manner (). The mechanism behind the regulation of PP2A via HIF-1 remains to be established. Our research team is currently investigating this issue.
Although mTOR inhibitors are a promising drug for various tumors, the biggest and inevitable concern associated with this reagent is drug resistance. In a previous study, sensitivity to rapamycin varied among different cancer cell lines by 3 orders of function.Citation31 Inhibition of mTOR paradoxically activates the phosphorylation of Akt and eIF4E,Citation32 and the PI3K and Ras pathways are known to interact with each other.Citation12 A feedback loop in the PI3K pathway where an mTOR inhibitor may activate Akt probably via S6K has been described previously.Citation33 shows that an increase in Akt phosphorylation in RMG-1HKD cells was not detected, suggesting that mTOR inhibition may induce reciprocal activation of other pathways such as the Ras pathway. Consistent with this notion, we found that MEK and ERK in the Ras pathway were activated in RMG-1HKD cells (), whereas Akt was not (). HIF-1α may not play a role in this feedback regulation and instead may directly downregulate MEK phosphorylation via PP2A ().
While the growth of RMG-1 and RMG-1HKD cells was slightly suppressed by either rapamycin or PD98059, a combination of both drugs almost completely suppressed the growth of both cells in vitro () and in vivo (). and B show that compared with intact RMG-1 cells, RMG-1HKD cells were more sensitive to PD98059 in vitro, indicating that the accelerated cell growth induced by HIF-1 inhibition could be reversed by drugs targeting other growth pathways, such as PD98059, and in the case of combination therapy, with drugs inducing HIF-1 inhibition, such as rapamycin. and 6 show that PD98059 more strongly suppressed tumor growth in RMG-1HKD cells than in RMG-1 cells. Furthermore, the combinatorial use of rapamycin and PD98059 completely suppressed tumor growth in both cell lines in vivo, showing that a combination of inhibitors against the PI3K or Ras pathways would be the most effective technique for suppressing OCCC.
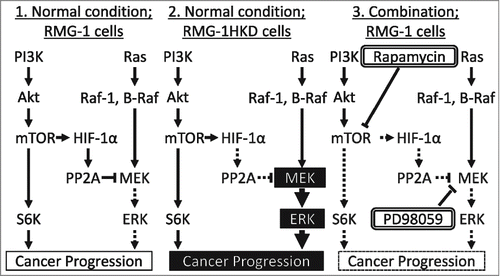
Here we identified a new mechanism for the crosstalk between the PI3K and Ras pathways, wherein MEK is activated by the downregulation of HIF-1, a downstream target of mTOR, via PP2A inactivation. The scheme for this new mechanism is presented in . In RMG-1 cells under normal conditions, upregulation of HIF-1 by mTOR activates PP2A, which in turn inactivates MEK. In RMG-1HKD cells under normal conditions, PP2A is not activated, which induces cancer progression via upregulation of the Ras pathway. When RMG-1 cells are subjected to both rapamycin and PD98059, rapamycin downregulates HIF-1 expression, which in turn activates MEK via PP2A inactivation, whereas PD98059 downregulates MEK activity, leading to the suppression of cancer progression. We revealed this regulation in the OCCC cell line, RMG-1. Although every cell or tissue type may have its own system by which the signaling pathways regulate each other, the crosstalk between the pathways by HIF-1 via PP2A may be ubiquitous. The crosstalk could be applied in the chemotherapy of cancers in which the PI3K pathway is activated, such as OCCC. The combination therapy using inhibitors against the Ras pathway, including MEK inhibitors, could augment the efficiency of mTOR inhibitors and help circumvent unfavorable adverse events in patients with cancers that involve activation of the PI3K pathway.
Figure 6. Effect of rapamycin, PD98059, or the combination of rapamycin with PD98059 on the tumor weight derived from RMG-1 and RMG-1HKD cells in vivo. The cancer cells were subcutaneously implanted into Balb/c nu/nu mice. At 4 weeks after drug injection, the mice were sacrificed and the tumors were surgically removed and weighted. (A) Alignment of the tumors removed from Balb/c nu/nu mice treated with vehicle (upper panel), rapamycin (middle upper panel), PD98059 (middle lower panel), and the drug combination (lower panel). (Right panels: RMG-1 cells, left panels: RMG-1HKD cells). The weights of (B) RMG-1- and (C) RMG-1HKD-derived tumors at 4 weeks after drug injection were measured and analyzed statistically (n = 2/vehicle, rapamycin, and PD98059; n = 3/drug combination).
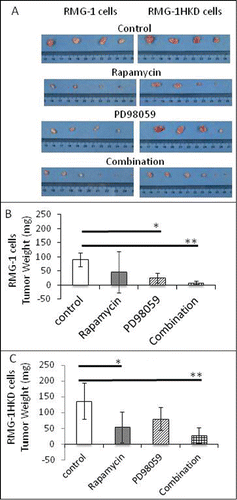
Figure 7. Crosstalk between the PI3K and Ras pathways via PP2A in the OCCC cell line RMG-1. (1) RMG-1 cells under normal conditions; highly expressed HIF-1 by mTOR activates PP2A, which inactivates MEK. (2) RMG-1HKD cells under normal conditions; PP2A is not activated, which in turn induces cancer progression. (3) RMG-1 cells in the combination therapy of rapamycin with PD98059; rapamycin downregulates HIF-1 expression, which in turn activates MEK, whereas PD98059 suppresses the activity of activated MEK, leading to the suppression of cancer progression.
Materials and Methods
Reagents
The inhibitors rapamycin and PD98069 were purchased from Calbiochem (La Jolla, CA). Cantharidin was procured from Wako Pure Chemical Industries (Osaka, Japan). Unless otherwise stated, all reagents were obtained from Sigma-Aldrich (St. Louis, MO), Wako Pure Chemical Industries (Osaka, Japan), or Nacalai Tesque (Kyoto, Japan).
Antibodies (Abs)
Anti-HIF-1α and anti-protein phosphatase 2A (PP2A) catalytic subunit Abs were purchased from BD Bioscience (San Jose, CA) and Millipore (Billerica, MA), respectively. Unless otherwise stated, the other primary Abs used in this manuscript were obtained from Cell Signaling Technologies (Danvers, MA). Horseradish peroxidase (HRP)-conjugated anti-mouse and anti-rabbit Abs were procured from Santa Cruz Biotech (Santa Cruz, CA) and Promega (Madison, MI), respectively.
Cell culture
RMG-1, a human OCCC cell line, and A2780, A2780CP (a cisplatin resistant clone of A2780),Citation17 CaOV3, and SKOV3 human OS cell lines were obtained from the American Type Culture Collection (Manassas, VA). These cell lines, except SKOV3, were maintained in the growth medium DMEM (Life Technologies, Carlsbad, CA) supplemented with 10% fetal bovine serum, 100 U/mL penicillin, and 10 μg/mL streptomycin. SKOV3 cells were grown in McCoy's 5A medium.
HIF-1α-silenced RMG-1 (RMG-1HKD) cells, in which the HIF-1α gene was suppressed by shRNA in RMG-1 cells, was also maintained in the same medium, except that it was supplemented with 1 μg/mL of puromycin (Wako Pure Chemical Industries, Osaka, Japan).
RMG-1RR cells, RMG-1 cells that are resistant to rapamycin, were established by exposing rapamycin-sensitive intact RMG-1 cells to gradually increasing concentrations of rapamycin (from 10 nM to 100 nM) over a period of 1 y Citation11,34 To culture RMG-1RR cells, a low dose of rapamycin was added to the growth medium.
Preparation of RMG-1HKD cells
Vector construction
To silence HIF-1α in RMG-1 cells, we used a retrovirus expression system involving a pSIREN-retroQ vector (Takara-bio, Shiga, Japan). Annealed oligonucleotides targeting human HIF-1α were ligated into a pSIREN-retroQ vector. The resulting vector was designated as pSIREN/HIF-1α. The oligonucleotide sequences were 5′-GATCCACAAATACATGGGATTAACTGTGTGCTGTCCAGTTAATCCCATGTATTTGTTTTTTTCTCGAG-3′ and 5′-AATTCTCGAGAAAAAAACAAATACATGGGATTAACTGGACAGCACACAGTTAATCCCATGTATTTGTG-3′.
Retrovirus preparation
Retrovirus particles were prepared using the retrovirus packaging kit Ampho (Takara-bio, Shiga, Japan) following the manufacturer's instructions. In brief, pSIREN/HIF-1α was transfected into 293T cells in conjunction with vectors harboring the gag/pol and env genes, which code for the major viral structural proteins, using a calcium phosphate method. The conditioned medium was collected 48 h after transfection, filtered, and preserved in a deep freezer until infection.
Establishment of RMG-1HKD cells
RMG-1 cells were infected with the retrovirus particles. The cells were grown in selective media containing 1 μg/mL puromycin for 10 d HIF-1α expression of the surviving colonies was assessed by real-time polymerase chain reaction (PCR). RMG-1 cells that showed the greatest suppression of HIF-1α expression were named RMG-1HKD cells and used in subsequent experiments.
Measurement of PP2A activity in RMG-1 and RMG-1HKD cells
PP2A activities in RMG-1 and RMG-1HKD cells were measured using a PP2A immunoprecipitation phosphatase assay kit (Millipore, Billerica, MA) following the manufacturer's instruction. In brief, cell lysates from each cell line were prepared in 20 mM imidazole-HCl (pH 7.0) with 2 mM EDTA, 2 mM EGTA, and 0.5% NP-40. The lysates were co-immunoprecipitated with an anti-PP2A catalytic subunit Ab (Millipore, Billerica, MA). The precipitates were mixed with the diluted substrate in the assay buffer, followed by malachite green phosphate detection solution. PP2A activities were measured with an immunoreader (NJ2001, Nalgene-Nunc, Rochester, NY) at a wavelength of 650 nm.
Cell growth assays
WST-8 assay
Cell growth was measured calorimetrically with a cell counting kit-8 (Wako Pure Chemical Industries, Osaka, Japan) following the manufacturer's instructions. In brief, cells of interest were plated onto a 96-well plate and incubated overnight to allow the cells to attach. Then, the cells were incubated with or without inhibitors for various periods of time (24–72 h). To measure the daily rate of cell proliferation, the cells were incubated with a WST-8 reagent for 1 h and its absorbance was measured at a wavelength of 450 nm using a microplate reader (Model 680, Bio-Rad, Hercules, CA).
Colony formation assay
The colony formation assay was performed using a 6-well plate. First, the bottom layer was prepared using 2.5 mL of 0.5% low-melting agarose (Agarose SFR, AMRESCO LLC, Solon, OH) dissolved in a growth medium described earlier. Cells were prepared at a density of 1 × 10⁵ cells/mL. Approximately 50 μL of the cell suspension and 1.4 mL of the 0.3% low-melting agarose in the growth medium were overlaid on the bottom of each well. To prevent moisture loss, another 0.5–1 mL of the growth media was overlaid. After 4 weeks, colonies were stained with 0.05% crystal violet, counted, and then imaged.
In vivo assay of RMG-1 and RMG-1HKD cells
Implantation of cancer cells into Balb/c nu/nu mice
RMG-1 or RMG-1HKD cells at a density of 5 × 10⁶ cells in 100 μL of phosphate-buffered saline (PBS) were subcutaneously grafted into the bilateral flanks of 9 Balb/c nu/nu mice (5 weeks old).
Administration of inhibitors
After 1 week, when the tumors reached a volume of approximately 50 mm3, the mice were randomized into 4 groups: vehicle control (PBS), rapamycin alone (2.5 mg/kg/day, twice a week intraperitoneally), PD98059 alone (0.25 mg/kg/day, twice a week intraperitoneally), and a combination of rapamycin with PD98059 (n = 2/vehicle, rapamycin, and PD98059; n = 3/drug combination). Tumor volumes were measured once a week and calculated using the following formula: V = π (length × width2)/6. After 4 weeks, the mice were sacrificed under anesthesia and the tumors were excised, weighed, and then fixed with 4% paraformaldehyde in PBS for histological analyses. The Osaka Medical College Animal Experiment Ethical Committee approved the animal experiment (Permission number: 2013–17).
Real-time reverse transcription (RT)-PCR
Real-time PCR analyses were performed as described previously.Citation35 In brief, RMG-1 and RMG-1RR cells were plated onto a 6-well plate containing growth medium, incubated overnight, and then treated with 100 nM of rapamycin for 24 h. RMG-1HKD cells were also plated on a 6-well plate along with a control cell line, RMG-1. RNA from these cells was extracted using RNAzol RT (Molecular Research Inc.., Cincinnati, OH) following the manufacturer's instructions. cDNAs were synthesized using a Primescript RT reagent kit (Takara-bio, Shiga, Japan) and subjected to real-time PCR analyses of HIF-1α and glyceraldehyde-3-phosphate dehydrogenase (GAPDH) using a Thermal cycler Dice Real-Time PCR System TP870 (Takara-bio, Shiga, Japan). The data was calculated using the ΔΔCt (threshold cycle) method. Expression of GAPDH was used for normalization.
Primers used in the amplification of genes assessed in the present study:
HIF-1α:
Forward: 5′-GAAAGCGCAAGTCCTCAAAG-3′
Reverse: 5′-TGGGTAGGAGATGGAGATGC-3′
GAPDH
Forward: 5′-ATTGCCCTCAACGACCACTT-3′
Reverse: 5′-AGGTCCACCACCCTGTTGCT-3′
Western blot analysis
Preparation of cell lysate
Cells were lysed with a lysis buffer (1% Triton X-100, 0.25% deoxycholic acid, 0.1 M NaCl, pH 7.4) containing a protease inhibitor cocktail (Nacalai Tesque, Kyoto, Japan). The protein concentration of the lysates was determined using a BCA protein assay kit (Pierce, Rockford, IL). To measure HIF-1α expression in the ovarian cancer cell lines, the cells were placed in a hypoxic chamber (BACTRON, SEL LAB, Portland, OR) under conditions of 2% O2, 5% CO2, and 37°C for 6 h prior to cell lysis.
SDS-PAGE and Western blot analysis
The proteins were subjected to SDS-PAGE, and the separated proteins were transferred onto a PVDF membrane (Millipore, Billerica, MA) using a Trans-blot SD semi-dry electrophoretic transfer cell (Bio-Rad, Hercules, CA). The membrane was blocked with 5% skimmed milk, incubated with the primary Ab of interest, followed by the appropriate HRP-conjugated secondary Ab, and then developed using a Luminata Forte Western HRP substrate (Millipore, Billerica, MA). Images were captured with a Chemidoc system (Bio-Rad, Hercules, CA).
Disclosure of Potential Conflicts of Interest
No potential conflicts of interest were disclosed.
Funding
This work was supported by Grants-in-aid from the Japanese Ministry of Education, Culture, Sports, Science, and Technology [24390384 and 25670709 to M.O. and 22590297 to M.A.].
References
- Siegel R, Naishadham D, Jemal A. Cancer statistics, 2013. CA Cancer J Clin 2013; 63:11-30; PMID:23335087
- Matsumura N, Mandai M, Okamoto T, Yamaguchi K, Yamamura S, Oura T, Baba T, Hamanishi J, Kang HS, Matsui S, et al. Sorafenib efficacy in ovarian clear cell carcinoma revealed by transcriptome profiling. Cancer Sci 2010; 101:2658-63; PMID:21040214; http://dx.doi.org/10.1111/j.1349-7006.2010.01736.x
- De Luca A, Maiello MR, D'Alessio A, Pergameno M, Normanno N. The RAS/RAF/MEK/ERK and the PI3K/AKT signalling pathways: role in cancer pathogenesis and implications for therapeutic approaches. Expert Opin Ther Targets 2012; 16(Suppl 2):S17-27; PMID:22443084; http://dx.doi.org/10.1517/14728222.2011.639361
- Tanaka Y, Terai Y, Tanabe A, Sasaki H, Sekijima T, Fujiwara S, Yamashita Y, Kanemura M, Ueda M, Sugita M, et al. Prognostic effect of epidermal growth factor receptor gene mutations and the aberrant phosphorylation of Akt and ERK in ovarian cancer. Cancer Biol Ther 2011; 11:50-7; PMID:21057220; http://dx.doi.org/10.4161/cbt.11.1.13877
- Zoncu R, Efeyan A, Sabatini DM. mTOR: from growth signal integration to cancer, diabetes and ageing. Nat Rev Mol Cell Biol 2011; 12:21-35; PMID:21157483; http://dx.doi.org/10.1038/nrm3025
- Hudson CC, Liu M, Chiang GG, Otterness DM, Loomis DC, Kaper F, Giaccia AJ, Abraham RT. Regulation of hypoxia-inducible factor 1alpha expression and function by the mammalian target of rapamycin. Mol Cell Biol 2002; 22:7004-14; PMID:12242281; http://dx.doi.org/10.1128/MCB.22.20.7004-7014.2002
- Semenza GL. Targeting HIF-1 for cancer therapy. Nat Rev Cancer 2003; 3:721-32; PMID:13130303; http://dx.doi.org/10.1038/nrc1187
- Jaakkola P, Mole DR, Tian YM, Wilson MI, Gielbert J, Gaskell SJ, von Kriegsheim A, Hebestreit HF, Mukherji M, Schofield CJ, et al. Targeting of HIF-alpha to the von Hippel-Lindau ubiquitylation complex by O2-regulated prolyl hydroxylation. Science 2001; 292:468-72; PMID:11292861; http://dx.doi.org/10.1126/science.1059796
- Banks RE, Tirukonda P, Taylor C, Hornigold N, Astuti D, Cohen D, Maher ER, Stanley AJ, Harnden P, Joyce A, et al. Genetic and epigenetic analysis of von Hippel-Lindau (VHL) gene alterations and relationship with clinical variables in sporadic renal cancer. Cancer Res 2006; 66:2000-11; PMID:16488999; http://dx.doi.org/10.1158/0008-5472.CAN-05-3074
- Tsunetoh S, Terai Y, Sasaki H, Tanabe A, Tanaka Y, Sekijima T, Fujioka S, Kawaguchi H, Kanemura M, Yamashita Y, et al. Topotecan as a molecular targeting agent which blocks the Akt and VEGF cascade in platinum-resistant ovarian cancers. Cancer Biol Ther 2010; 10:1137-46; PMID:20935474; http://dx.doi.org/10.4161/cbt.10.11.13443
- Wang X, Yue P, Kim YA, Fu H, Khuri FR, Sun SY. Enhancing mammalian target of rapamycin (mTOR)-targeted cancer therapy by preventing mTOR/raptor inhibition-initiated, mTOR/rictor-independent Akt activation. Cancer Res 2008; 68:7409-18; PMID:18794129; http://dx.doi.org/10.1158/0008-5472.CAN-08-1522
- Mendoza MC, Er EE, Blenis J. The Ras-ERK and PI3K-mTOR pathways: cross-talk and compensation. Trends Biochem Sci 2011; 36:320-8; PMID:21531565; http://dx.doi.org/10.1016/j.tibs.2011.03.006
- Carracedo A, Ma L, Teruya-Feldstein J, Rojo F, Salmena L, Alimonti A, Egia A, Sasaki AT, Thomas G, Kozma SC, et al. Inhibition of mTORC1 leads to MAPK pathway activation through a PI3K-dependent feedback loop in human cancer. J Clin Invest 2008; 118:3065-74; PMID:18725988
- Vignot S, Faivre S, Aguirre D, Raymond E. mTOR-targeted therapy of cancer with rapamycin derivatives. Ann Oncol 2005; 16:525-37; PMID:15728109; http://dx.doi.org/10.1093/annonc/mdi113
- Mabuchi S, Kawase C, Altomare DA, Morishige K, Sawada K, Hayashi M, Tsujimoto M, Yamoto M, Klein-Szanto AJ, Schilder RJ, et al. mTOR is a promising therapeutic target both in cisplatin-sensitive and cisplatin-resistant clear cell carcinoma of the ovary. Clin Cancer Res 2009; 15:5404-13; PMID:19690197; http://dx.doi.org/10.1158/1078-0432.CCR-09-0365
- Fujisue Y, Nakagawa T, Takahara K, Inamoto T, Kiyama S, Azuma H, Asahi M. Induction of erythropoietin increases the cell proliferation rate in a hypoxia-inducible factor-1-dependent and -independent manner in renal cell carcinoma cell lines. Oncol Lett 2013; 5:1765-70; PMID:23833638
- Godwin AK, Meister A, O'Dwyer PJ, Huang CS, Hamilton TC, Anderson ME. High resistance to cisplatin in human ovarian cancer cell lines is associated with marked increase of glutathione synthesis. Proc Natl Acad Sci U S A 1992; 89:3070-4; PMID:1348364; http://dx.doi.org/10.1073/pnas.89.7.3070
- Bae D, Ceryak S. Raf-independent, PP2A-dependent MEK activation in response to ERK silencing. Biochem Biophys Res Commun 2009; 385:523-7; PMID:19465001; http://dx.doi.org/10.1016/j.bbrc.2009.05.082
- Li W, Xie L, Chen Z, Zhu Y, Sun Y, Miao Y, Xu Z, Han X. Cantharidin, a potent and selective PP2A inhibitor, induces an oxidative stress-independent growth inhibition of pancreatic cancer cells through G2/M cell-cycle arrest and apoptosis. Cancer Sci 2010; 101:1226-33; PMID:20331621; http://dx.doi.org/10.1111/j.1349-7006.2010.01523.x
- Vivanco I, Sawyers CL. The phosphatidylinositol 3-Kinase AKT pathway in human cancer. Nature reviews Cancer 2002; 2:489-501; PMID:12094235; http://dx.doi.org/10.1038/nrc839
- Downward J. Targeting RAS signalling pathways in cancer therapy. Nat Rev Cancer 2003; 3:11-22; PMID:12509763; http://dx.doi.org/10.1038/nrc969
- Campbell IG, Russell SE, Choong DY, Montgomery KG, Ciavarella ML, Hooi CS, Cristiano BE, Pearson RB, Phillips WA. Mutation of the PIK3CA gene in ovarian and breast cancer. Cancer Res 2004; 64:7678-81; PMID:15520168; http://dx.doi.org/10.1158/0008-5472.CAN-04-2933
- Kuo KT, Mao TL, Jones S, Veras E, Ayhan A, Wang TL, Glas R, Slamon D, Velculescu VE, Kuman RJ, et al. Frequent activating mutations of PIK3CA in ovarian clear cell carcinoma. Am J Pathol 2009; 174:1597-601; PMID:19349352; http://dx.doi.org/10.2353/ajpath.2009.081000
- Semenza GL. HIF-1 mediates the Warburg effect in clear cell renal carcinoma. J Bioenerg Biomembr 2007; 39:231-4; PMID:17551816; http://dx.doi.org/10.1007/s10863-007-9081-2
- Agani F, Jiang BH. Oxygen-independent regulation of HIF-1: novel involvement of PI3K/AKT/mTOR pathway in cancer. Curr Cancer Drug Targets 2013; 13:245-51; PMID:23297826; http://dx.doi.org/10.2174/1568009611313030003
- Nickerson ML, Jaeger E, Shi Y, Durocher JA, Mahurkar S, Zaridze D, Matveev V, Janout V, Kollarova H, Bencko V, et al. Improved identification of von Hippel-Lindau gene alterations in clear cell renal tumors. Clin Cancer Res 2008; 14:4726-34; PMID:18676741; http://dx.doi.org/10.1158/1078-0432.CCR-07-4921
- O'Reilly KE, Rojo F, She QB, Solit D, Mills GB, Smith D, Lane H, Hofmann F, Hicklin DJ, Ludwig DL, et al. mTOR inhibition induces upstream receptor tyrosine kinase signaling and activates Akt. Cancer Res 2006; 66:1500-8; PMID:16452206; http://dx.doi.org/10.1158/0008-5472.CAN-05-2925
- Adams DG, Coffee RL Jr., Zhang H, Pelech S, Strack S, Wadzinski BE. Positive regulation of Raf1-MEK1/2-ERK1/2 signaling by protein serine/threonine phosphatase 2A holoenzymes. J Biol Chem 2005; 280:42644-54; PMID:16239230; http://dx.doi.org/10.1074/jbc.M502464200
- Fukukawa C, Tanuma N, Okada T, Kikuchi K, Shima H. pp32/ I-1(PP2A) negatively regulates the Raf-1/MEK/ERK pathway. Cancer Lett 2005; 226:155-60; PMID:16039954; http://dx.doi.org/10.1016/j.canlet.2004.11.026
- Van Kanegan MJ, Adams DG, Wadzinski BE, Strack S. Distinct protein phosphatase 2A heterotrimers modulate growth factor signaling to extracellular signal-regulated kinases and Akt. J Biol Chem 2005; 280:36029-36; PMID:16129692; http://dx.doi.org/10.1074/jbc.M506986200
- Huang S, Bjornsti MA, Houghton PJ. Rapamycins: mechanism of action and cellular resistance. Cancer Biol Ther 2003; 2:222-32; PMID:12878853; http://dx.doi.org/10.4161/cbt.2.3.360
- Sun SY, Rosenberg LM, Wang X, Zhou Z, Yue P, Fu H, Khuri FR. Activation of Akt and eIF4E survival pathways by rapamycin-mediated mammalian target of rapamycin inhibition. Cancer Res 2005; 65:7052-8; PMID:16103051; http://dx.doi.org/10.1158/0008-5472.CAN-05-0917
- Um SH, Frigerio F, Watanabe M, Picard F, Joaquin M, Sticker M, Fumagalli S, Allegrini PR, Kozma SC, Auwerx J, et al. Absence of S6K1 protects against age- and diet-induced obesity while enhancing insulin sensitivity. Nature 2004; 431:200-5; PMID:15306821; http://dx.doi.org/10.1038/nature02866
- Hisamatsu T, Mabuchi S, Matsumoto Y, Kawano M, Sasano T, Takahashi R, Sawada K, Ito K, Kurachi H, Schilder RJ, et al. Potential role of mTORC2 as a therapeutic target in clear cell carcinoma of the ovary. Mol Cancer Ther 2013; 12:1367-77; PMID:23615631; http://dx.doi.org/10.1158/1535-7163.MCT-12-1185
- Nakagawa T, Asahi M. beta1-adrenergic receptor recycles via a membranous organelle, recycling endosome, by binding with sorting nexin27. J Membr Biol 2013; 246:571-9; PMID:23780416; http://dx.doi.org/10.1007/s00232-013-9571-6