Abstract
Glucose intolerance and frank diabetes mellitus (DM) can increase the risk of cancer death for pancreatic cancer (PanCa). However, the mechanism by which these factors influence cancer deaths is not clear. In this study, we established a model system to mimic the pancreatic tumor microenvironment in patients with DM to examine the biological behavior of PanCa cells and nerves in cell culture and in animals. Our in vitro studies demonstrated that hyperglycemia promoted the proliferation and invasion of PanCa cell lines and upregulated the expression of nerve growth factor in these cells. Also, the migration of Schwann cells (SCs) was inhibited by hyperglycemia and neurites exerted pathological regeneration. Furthermore, the interaction between the PanCa cells and nerves was enhanced in the tumor microenvironment. We further showed that hyperglycemia promoted the perineural invasion (PNI) of PanCa in vivo. These data suggest that DM worsens the prognosis of PanCa because of aggravated PNI. Thus, our study illustrates a novel mechanism by which hyperglycemia decreases survival in patients with PanCa.
Abbreviations
| DM | = | diabetes mellitus |
| DRGs | = | dorsal root ganglions |
| PanCa | = | pancreatic cancer |
| PNI | = | perineural invasion |
| SCs | = | Schwann cells |
Introduction
Perineural invasion (PNI) in pancreatic cancer (PanCa) is a common pathological phenomenon in which cancer cells invade and intimately contact the endoneuria of pancreatic nerves and is thought to contribute to both pain and local disease recurrence.Citation1 PNI is an important prognostic factor for PanCa that increases as the cancer becomes undifferentiated and predominantly existed in the perineurium and perineural space.Citation2
Three hypotheses have been proposed for the pathogenesis of PNI.Citation3 Tumor-stroma microenvironment is an important mediator for cancer cell behavior in various cancers.Citation4 In PanCa, its adjacent stroma plays active roles in creating a dynamic environment that supports pancreatic tumor growth and invasion.Citation5
Approximately 80% of patients with PanCa have glucose intolerance or frank diabetes mellitus (DM).Citation6 Patients with both DM and pancreatic cancer have a greater risk of cancer death compared to those without DM.Citation7,8 In a pancreatic tumor microenvironment, hyperglycemia not only serves simply as a passive source of nutrition, but also has a proactive effect on the biological behavior of cancer cells.Citation9,10
DM-related hyperglycemia was shown to cause up to fourfold increase in neuronal glucose levels.Citation11 If this hyperglycemia persists, intracellular glucose metabolism will lead to neuronal damage. Neuropathy frequently results in clinically significant symptoms such as pain, loss of sensation, foot ulcers, gangrene, and amputations.Citation12,13
In this study, we established a model system to mimic the pancreatic tumor microenvironment in patients with DM to examine the biological behavior of PanCa cells and pancreatic tumor nerves in vitro and in vivo. Our results suggest that DM worsens the prognosis of PanCa because of the enhanced PNI.
Materials and Methods
Cell culture, tissue culture, and co-culture
MIA PaCa-2 and BxPC-3 (obtained from the American Type Culture Collection) were maintained in DMEM supplemented with 10% heat-inactivated fetal bovine serum, 50 U/mL penicillin G, 50 μg/mL streptomycin sulfate at 37°C in a humidified 5% CO2/95% air atmosphere.
Newborn rats were purchased from the laboratory animal center of Xi'an Jiaotong University. Athymic nude mice were purchased from the Shanghai Laboratory Animal Center. Animal care and experiments were carried out in accordance with the guidelines of Institutional Animal Care and Use Committee at Xi'an Jiaotong University. DRGs were resected and placed in DMEM with 5.5 mM glucose, stripped of meninges and nerve stumps, and plated into a drop of liquid Matrigel (BD Biosciences). After solidification, DMEM containing 5.5, 25, or 55 mM glucose was carefully added and renewed every 2 days.Citation14,15
Co-culture experiments were performed as previously described with modification.Citation14 The DRGs were stored on ice in DMEM and seeded in 24-well Petri dishes containing 25 μl of Matrigel as described previously.Citation16 BxPC-3 cells were suspended in 25 μl of solidified Matrigel and placed next to DRG suspensions- front side. After solidification of Matrigel, DMEM containing 5.5, 25, or 55 mM glucose was carefully added to the Petri dishes and renewed every 2 days. Photographic documentation was performed using an inverted light microscope and an analytical software program.
Reverse transcription-polymerase chain reaction analysis of NGF, TrkA and p75
Total RNA from the PanCa cells was prepared and reverse-transcribed into cDNAs using a RevertAid kit (Fermentas Life Sciences). Amplification of specific genes was performed using the following primers and conditions. 1) For NGF genes, 5′-atacaggcggaaccacactc-3′ (sense) and 5′-tgctcctgtgagtcctgttg-3′ (antisense) primers were used. 2) For TrkA genes, the primers 5′-atgctggtggctgtcaaggc-3′ (sense) and 5′-cgtcgctctcggtggtgaac-3′ (antisense) primers were used. 3) For p75 genes, the primers 5′-ccctggccgttggattacac-3′ (sense) and 5′-gagatgccactgtcgctgtg-3′ (antisense) were used. DNA fragments amplified using polymerase chain reaction were resolved using electrophoresis on 1.5% agarose gels containing ethidium bromide.
Western blotting analysis
Total protein was extracted from cultured PanCa cells in a radioimmunoprecipitation assay lysis buffer on ice for 20 min. Clarified protein lysates (30–80 g) were resolved electrophoretically on a denaturing sodium dodecyl sulfate-polyacrylamide gel (8–12%) and electrotransferred onto nitrocellulose membranes. The membranes were initially incubated with a blocking buffer for 2 h and then probed with primary antibodies against the specific protein and an anti-β-actin antibody as a control. After co-incubation with the primary antibodies, the membranes were hybridized with a secondary alkaline phosphatase-conjugated goat anti-rabbit antibody or goat anti-mouse antibodies (Santa Cruz Biotechnology) for 2 h at room temperature. Images of immunopositive bands were developed using an enhanced chemiluminescence detection system (Amersham Biosciences) and transferred onto x-ray film.
Determination of NGF in the culture medium
The supernatant collected after PanCa cells were treated with glucose at different concentrations. The expression levels of NGF in the PanCa cells supernatant were determined using an Enzyme-linked immunosorbent assay according to the manufacturer's instructions. The absorbance was measured at 492 nm using a microplate reader (ELx800; BioTek) in less than 15 min.
Cell proliferation assay
Cancer cells were seeded in 96-well tissue culture plates at a density of 5000-10,000 cells/well. After 24, 48, or 72 h, the medium was removed from the plates, and MTT was added into each well and incubated at 37°C for 4 h. The optical densities (ODs) of PanCa cells at 490 nm were measured using a microplate reader (BIO-TEC). The proliferation rate was calculated using the equation OD (sample)/OD (medium).
In vitro invasion assay
The 8-μm-pore Millicell inserts were coated with 25 μL of Matrigel. Media with different concentrations of glucose were added to the bottom chamber of Millicell to induce the invasiveness of the cancer cell lines. Cancer cells were pre-cultured for 24 h with glucose at different concentrations and seeded (5 × 10⁴) in the top chamber of Millicell. The Matrigel invasion chamber was incubated for 20 h and non-invading cells were removed from the top of the Matrigel. Invading cells on the bottom surface of the filter were fixed in methanol and stained with crystal violet.
In vivo model of neural invasion of PanCa cells
Six-week-old male athymic nu/nu mice were rendered diabetic via intravenous administration of streptozotocin (175 mg/kg). The mice were anesthetized for all procedures via inhalation of methoxyflurane. Slow microinjection of 3 μl of a BxPC-3 cell suspension into the perineurium of the sciatic nerve at a concentration of 1 × 10⁵/μL was performed using a 5-μL microsyringe over 2 min. Sciatic nerve function was measured weekly over 6 weeks as described previously.Citation17
Immunohistochemistry
After deparaffinization and rehydration of the sections, the sections were preblocked for 30 min with sheep serum and incubated with the primary anti-NF200 antibody at 4°C overnight. A biotinylated secondary antibody was applied to the sections and visualized along with streptavidin-labeled horseradish peroxidase. The reaction products were visualized using incubation with 20 mg of 3, 3-diaminobendizine.
Electron microscopy
The mice's bilateral sciatic nerves containing pancreatic tumors were fixed within 2.5% glutaraldehyde plus 4% paraformaldehyde in a phosphate buffer for 2 h at 4°C. The samples were washed and placed in 1% osmium tetroxide for 2 h. After two washes with water, the samples were dehydrated with graded alcohol and impregnated with propylene oxide and EPON resin (Sigma). Sections 1 μm thick were cut from the paraffin fixed samples using a microtome and stained with toluidine blue to mark the area of interest for light microscopy. Thin sections of the sciatic nerves and tumors were cut, stained with uranyl acetate and lead citrate, and examined under an electron microscope (H-600; Hitachi, Ltd.). The typical morphological change of apoptosis was mass-like aggregation and increased electron density of nuclear chromatin.
Statistical analysis
Statistical analyses were performed using the SPSS software program (version 17.0; SPSS Inc.). All data are expressed as the mean ± standard deviation (SD). Multiple groups of different glucose concentrations were compared using one-way analysis of variance followed by the Bonferroni post-hoc test. p < 0.05 was considered statistically significant.
Results
Expression of nerve growth factor and its receptors in PanCa cells in response to high glucose concentrations
Our results showed that the expression level of NGF mRNA in PanCa cells was gradually enhanced with statistically significance as the glucose concentration in the medium increased (). The expression of p75 mRNA in PanCa cells was decreased when the glucose concentration increased from 5.5 mM to 55 mM at the same time point (). The expression of TrkA mRNA exhibited irregular changes at different culture times, and the changes did not correlate with the glucose concentration.
Figure 1. Expression of NGF and its receptors in PanCa cells at the mRNA and protein levels. (A) The mRNA and protein ODs were normalized to actin. Expression of NGF and its receptors mRNA (B) and protein (C) in PanCa cells in response to increased glucose concentrations ranged from 5.5 mM to 55 mM. (D) The levels of NGF in the culture media of BxPC-3 and MIA PaCa-2 in response to increased glucose concentrations determined by ELISA. *P < 0.05 (25 mM versus 5.5 mM); **P < 0.01 (55 mM vs. 5.5 mM); #P < 0.05 (5.5 mM versus 25 mM and 55 mM).
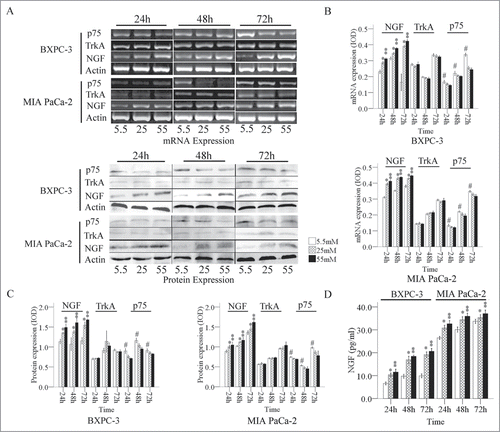
We also determined a similar pattern of changes in the expression levels of NGF, TrkA, and p75 at protein levels in PanCa cell lines (). The expression of NGF was relatively low in both cell lines at a glucose concentration of 5.5 mM, whereas the expression of NGF was largely increased in the cells exposed to 25 and 55 mM of glucose. MIA PaCa-2 cells had relatively high levels of TrkA expression, whereas BxPC-3 cells had lower levels of TrkA expression. The p75 expression level was high at 5.5 mM, moderate at 25 mM, and low at 55 mM (). The secretion of NGF from the both PanCa cells was increased with significance in response to the glucose treatments in a dose and time dependent manner ().
Impact of glucose levels on the proliferation and migration of PanCa cells
A significant increase of cell number was observed in cancer cells in a dose-dependent manner (). After the NGF neutralizing antibody was added into the culture medium, the cell number and proliferation rates decreased (). Moreover, a markedly enhanced cell mobility was also observed in cancer cells in response to glucose treatments (). The stimulating effect of glucose on cell migration was inhibited by NGF neutralizing antibody.
Figure 2. Promotion of proliferation and invasion of PanCa cells by high glucose levels. The proliferation of BxPC-3 (A) and MIA PaCa-2 (B) cells in culture was promoted by increased glucose concentrations and culture times. NGF neutralizing antibody reduced the cell proliferation. (C and D) The elevated invasion abilities of PanCa cells by high glucose concentration could also be neutralized by NGF antibody. *P < 0.05 (25 mM vs. 5.5 mM); **P < 0.01 (55 mM versus 5.5 mM); #P < 0.05 (25 mM vs. 5.5 mM, 5.5 mM + antibody [Ab], 25 mM + Ab, and 55 mM + Ab); #*P < 0.05 (55 mM versus 5.5 mM, 5.5 mM + Ab, 25 mM + Ab, and 55 mM + Ab).
![Figure 2. Promotion of proliferation and invasion of PanCa cells by high glucose levels. The proliferation of BxPC-3 (A) and MIA PaCa-2 (B) cells in culture was promoted by increased glucose concentrations and culture times. NGF neutralizing antibody reduced the cell proliferation. (C and D) The elevated invasion abilities of PanCa cells by high glucose concentration could also be neutralized by NGF antibody. *P < 0.05 (25 mM vs. 5.5 mM); **P < 0.01 (55 mM versus 5.5 mM); #P < 0.05 (25 mM vs. 5.5 mM, 5.5 mM + antibody [Ab], 25 mM + Ab, and 55 mM + Ab); #*P < 0.05 (55 mM versus 5.5 mM, 5.5 mM + Ab, 25 mM + Ab, and 55 mM + Ab).](/cms/asset/210f2b46-f4de-41c7-8df5-d2ec85de7852/kcbt_a_1040952_f0002_c.gif)
High glucose levels retard neurite outgrowth and Schwann cells migration from Dorsal root ganglions in newborn rats
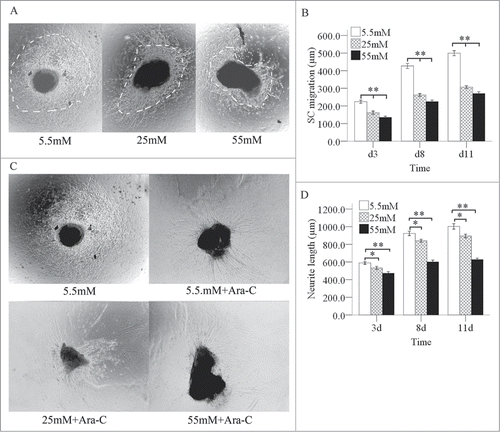
We next cultured dorsal root ganglions (DRGs) from newborn rats in media with various glucose concentrations for 3, 8, or 11 days. The SCs migration outlines on the images grew larger as the culture time increased from 3 to 11 days. At the same culture times, the SCs migration outline shrank quickly when the glucose concentration increased from 5.5 to 55 mM (). SCs migration outline can cover the growth of neurites (). After treating SCs with cytosine arabinoside (Ara-C), we observed a slow increase in neurite regeneration at the various glucose concentrations as the culture time increased from 3 to 11 days. At the same culture times, neurite regeneration decreased slowly and in a statistically significant manner when the glucose concentration increased from 5.5 to 55 mM ().
Figure 3. Inhibition of the migration of SCs and neurite outgrowths in DRGs by high glucose levels. Under a phase contrast microscope, the each SC migration outline was indicated by a bright field. The dashed line shows the SC outline. (A) The SC outline size decreased as the glucose concentration increased at the same culture times, but this effect was not totally inhibited high glucose. Also, the SC migration outline expanded in various glucose media as the culture time increased from 3 to 11 days (B). When the SCs were treated with Ara-C, the neurite outgrowth decreased slowly as the glucose concentration increased (C and D) at the same culture times, but this effect was not totally inhibited high glucose. The neurite outgrowth increased in various glucose media as the culture time increased from 3 to 11 days. *P < 0.05 (25 mM vs. 5.5 mM); **P < 0.01 (B: 55 mM and 25 mM versus 5.5 mM; D: 55 mM vs. 5.5 mM).
High glucose levels affect the interaction between PanCa cells and DRGs
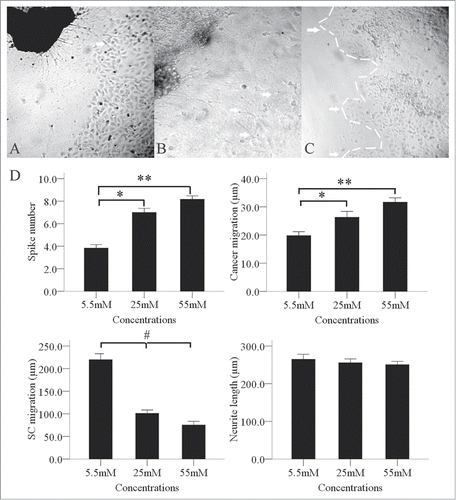
During the co-culture period, BxPC-3 cells facing the DRGs formed peak-like clusters (), which gradually migrated to the DRGs. The number of clusters increased gradually and significantly when the glucose concentration increased from 5.5 mM to 55 mM. We also found an interesting phenomenon in the co-culture environment in that the SCs migration outline shrank significantly when the glucose concentration increased from 5.5 mM to 55 mM (). Neurite outgrowths from the DRGs extended directly toward the BxPC-3 clusters. We observed retrograde migration of BxPC-3 clusters along the contacting neurites after neurite-cancer cell contact ().
Figure 4. Enhancement of the interaction between PanCa cells and DRGs by high glucose levels. In the high-glucose group of 25 and 55mM, neurite outgrowth (A, arrow; original magnification, ×100) extended from the DRGs to tumor clusters and provided an invasive pathway for the clusters (B, arrow; original magnification, ×200). Cancer cells then formed more clusters (C, arrow; original magnification, ×100). In a co-culture model, the cancer cells formed spike-like morphological formations in the 3 groups of 5.5, 25 and 55 mM tested. Increased formation of spike-like structures and cluster migration to DRGs were detected in the high-glucose groups. High glucose concentrations inhibited SC migration but not neurite outgrowth (D). *P < 0.05 (5.5 mM versus 25 mM); **P < 0.01 (5.5 mM vs. 55 mM); #P < 0.05 (5.5 mM versus 25 mM and 55 mM).
DM-induced severe sciatic nerve dysfunction in vivo
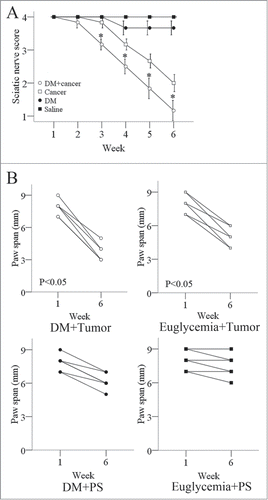
After establishing a murine model of PNI by implanting BxPC-3 cells into their right sciatic nerves, we assessed the propensity for tumors to induce sciatic nerve paralysis. After establishing PNI tumors (7 days after injecting the cancer cells into a distal site on the sciatic nerves), we examined the sciatic nerve function weekly, including the mice's gross behavior, limb function, and sciatic nerve indices. Mice began to experience right hind-limb dysfunction 1 week after cancer cell injection; 4 of the 6 diabetic mice had complete paralysis 5 weeks after injection. In the euglycemic group, right hind-limb dysfunction began to occur 2 weeks after cancer cell injection; one of the 6 mice had complete paralysis 5 weeks after injection. The sciatic nerve score between the 2 groups of mice was significant different (). The left hind limbs were not paralyzed in either group. The right hind-limb paw span decreased more in the diabetic group than in the euglycemic group 6 weeks after tumor-cell injection. The left sciatic nerve in each mouse served as the control ().
Figure 5. Measures of sciatic nerve function in diabetic and normal mice. (A) The right hind limbs of diabetic nude mice exhibited dysfunction 2 weeks after tumor-cell injection and became completely paralyzed 6 weeks after tumor-cell injection. In comparison, the right hind limbs of normal nude mice exhibited dysfunction 3 weeks after tumor-cell injection and were not completely paralyzed 6 weeks after tumor-cell injection. The left hind limbs in both groups of mice did not exhibit significant dysfunction. The spread length between the first and fifth toes of the right hind-limb paw decreased from 1 to 6 weeks after tumor implantation in the diabetic and normal mice, but the decrease was more significant in the diabetic group. The spread length of the left hind-limb paw did not decrease significantly in either group (B). Data are represented as mean values obtained in 5 mice for each group.
DM promotes pancreatic tumor growth and induces structural changes in severe sciatic nerve tumors in vivo
The diabetic and euglycemic mice described in the methods were sacrificed after 6 weeks post injection of tumor-cell and their sciatic nerves and tumors were harvested for histopathological analysis. The tumor sections showed different expression levels of NGF between the euglycemia group and hyperglycemia group. The NGF staining in the cytoplasm of the cancer cells is significantly stronger in the hyperglycemia group than in the euglycemia group, indicating the NGF protein level of cancer cells is increased in the hyperglycemia group (Fig. S1). The integrated optical density (IOD) of NGF stainings were higher in the hyperglycemia group than that in the euglycemia group (p=0.002) (Fig. S2). The levels of NGF in the mouse plasma were higher in the hyperglycemia group than that in the euglycemia group (p = 0.005) (Fig. S3).
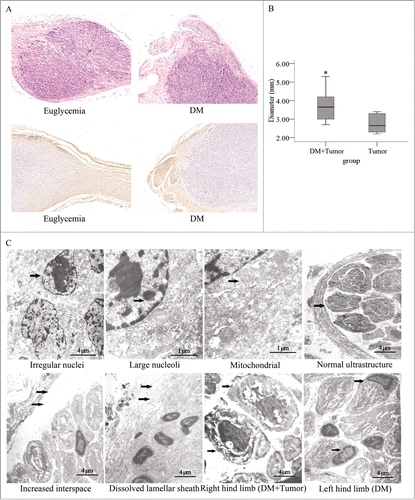
We found that the cancer cells penetrated the nerve tissue invasively and did not simply compress the nerve tissue (). A significantly difference of tumor diameter at the injection site between the diabetic group and the euglycemic group were observed (). The sciatic nerve fibers were labeled with an anti-NF200 antibody and the ultrastructure of the sciatic nerve and tumor tissue were examined under an electron microscope. We found that the each mass of cancer cells contained irregular nuclei, mass-like accumulations of chromatin, and large nucleoli. The mitochondrial structure was normal. In the right hind limbs of the diabetic mice, we found that the interspace between the nerve fiber and lamellar sheath was significantly enlarged. In addition, a portion of the lamellar sheath had segmentally dissolved, and extensive SCs apoptosis occurred. Furthermore, in the diabetic group, the layered structure of the myelin sheath was loose and had dissolved in the right and left hind limbs; however, the neurite was intact in the right limb, even though it was dissolved in the left limb ().
Figure 6. Histopathological photomicrographs of pancreatic tumors in diabetic and normal nude mice. (A) Hematoxylin and eosin staining and immunostaining for a primary anti-NF200 antibody of sections for nerves and PanCa cell tumor sections. The tumor tissue penetrated the nerve tissue in an invasive manner (original magnification, ×100). The tumor diameters were larger (B) in the diabetic mice than in the normal mice. (C) In the electron micrographs of sciatic nerve invaded by pancreatic tumors, PanCa cells exhibited irregular nuclei (arrow) as well as mass-like accumulations and large nucleoli (arrow). Their mitochondrial structure was normal (arrow). The interspace between the nerve fiber and lamellar sheath increased significantly (arrow). The lamellar sheath segmentally dissolved (arrow), and extensive SC apoptosis in sciatic nerve of DM was detected. The layered structure of the myelin sheath was loose and had dissolved in the right and left limbs of mice in the diabetic group. In addition, the neurites remained intact in the right hind limb (arrow) but dissolved in the left hind limb (arrow).
Discussion
The reasons for poor prognosis of PanCa with diabetics are complex. In two studies from Korea and China, an elevated fasting serum glucose level is independent risk factor for several major cancers.Citation19,20 It has also been found that the blood glucose level is an important factor in breast cancer cell proliferation.Citation21,22 Our results show that the cell proliferation and mobility were increased when the glucose concentration in culture media was shifted from euglycemic to hyperglycemic levels.
Hyperglycemia can increase NGF secretion from β cells both in vitro and in vivo.Citation23 NGF exerts both stimulatory and inhibitory effects on PanCa cells, depending on the NGF expression level and ratio of TrkA to p75.Citation24,25 Overexpression of NGF may contribute to PNI of PanCa cells by inducing hyperplasia of nerves, which reduces apoptosis of PanCa cells due to the combined signaling effects of NGF and TrkA in PanCa.Citation26
The most common morphological abnormality in patients with diabetic polyneuropathy is axon loss, segmental demyelination and remyelination.Citation27 Hyperglycemia can impair SCs proliferation and migration as well as axon regeneration from DRGs.Citation14
The intrapancreatic microenvironment in patients with chronic pancreatitis and PanCa induces neurite outgrowth, complex branching patterns, perikaryonal hypertrophy, and increased glial density of DRGs in vitro, which play a key role in the generation of pancreatic neuropathy and neuroplasticity.Citation28 The present study described an interesting phenomenon in which regeneration of neurites is increased and the SCs migration outline is shrunk to a similar degree in newly formed hyperglycemic tumor microenvironments. The increased neurite regeneration is extended directly toward and interacts with PanCa cancer, which is also extended toward DRGs. PNI by cancer cells leads to progressive dysfunction of the infiltrated nerve and may manifest as pain and numbness in sensory nerves and/or paralysis of motor nerves.Citation29,17 Additionally, pre-existing DM is associated with reduced survival rates in patients undergoing pancreatic tumor resection. Pancreatic tumors in patients with new-onset DM may exhibit increased tumor size and result in decreased post-resection survival rates.Citation30,31
In conclusion, we demonstrate that hyperglycemia promoted the cell proliferation, invasion, and neurotropism in PanCa; impaired the nerve construction; mediated the formation of a low-resistance pathway of PNI by PanCa cells; and enhanced the interaction between PanCa cells and nerves in tumors. These results suggest that hyperglycemia induce the PNI of PanCa cells, indicating a novel mechanism by which hyperglycemia decreases survival rates in patients with PanCa.
Supplementary Figures and Captions
Download Zip (3 MB)Additional information
Funding
References
- BJ Swanson, KM McDermott, PK Singh, JP Eggers, PR Crocker, MA Hollingsworth. MUC1 is a counter-receptor for myelin-associated glycoprotein (Siglec-4a) and their interaction contributes to adhesion in pancreatic cancer perineural invasion, Cancer Res. (2007); 67:10222–9; PMID:17974963; http://dx.doi.org/10.1158/0008-5472.CAN-06-2483
- S Mitsunaga, T Hasebe, T Kinoshita, M Konishi, S Takahashi, N Gotohda, T Nakagohri, A Ochiai. Detail histologic analysis of nerve plexus invasion in invasive ductal carcinoma of the pancreas and its prognostic impact, Am J Surg Pathol. (2007); 31:1636–44; PMID:18059219; http://dx.doi.org/10.1097/PAS.0b013e318065bfe6
- C Liebig, G Ayala, JA Wilks, DH Berger, D Albo. Perineural invasion in cancer: a review of the literature, Cancer. (2009); 115:3379–91; PMID:19484787; http://dx.doi.org/10.1002/cncr.24396
- B Farrow, D Albo, DH Berger. The role of the tumor microenvironment in the progression of pancreatic cancer, J Surg Res. (2008); 149:319–28; PMID:18639248; http://dx.doi.org/10.1016/j.jss.2007.12.757
- S Q Yi, K Miwa, T Ohta, M Kayahara, H Kitagawa, A Tanaka, T Shimokawa, K Akita, S Tanaka. Innervation of the pancreas from the perspective of perineural invasion of pancreatic cancer, Pancreas. (2003); 27:225–9; PMID:14508126; http://dx.doi.org/10.1097/00006676-200310000-00005
- R Pannala, A Basu, GM Petersen, ST Chari. New-onset diabetes: a potential clue to the early diagnosis of pancreatic cancer, Lancet Oncol. (2009); 10:88–95; PMID:19111249; http://dx.doi.org/10.1016/S1470-2045(08)70337-1
- SS Coughlin, EE Calle, LR Teras, J Petrelli, MJ Thun. Diabetes mellitus as a predictor of cancer mortality in a large cohort of US adults, Am J Epidemiol. (2004); 159:1160–7; PMID:15191933; http://dx.doi.org/10.1093/aje/kwh161
- D LeRoith, R Novosyadlyy, EJ Gallagher, D Lann, A Vijayakumar, S Yakar. Obesity and type 2 diabetes are associated with an increased risk of developing cancer and a worse prognosis; epidemiological and mechanistic evidence, Exp Clin Endocrinol Diabetes. (2008); 116 Suppl 1:S4–6; PMID:18777452; http://dx.doi.org/10.1055/s-2008-1081488
- W Li, QY Ma, JH Li, K Guo, H Liu, L Han, GD Ma. Hyperglycemia enhances the invasive and migratory activity of pancreatic cancer cells via hydrogen peroxide, Oncol Rep. (2011); 25:1279–87; PMID:21249318
- H Liu, QY Ma, JH Li. High glucose promotes cell proliferation and enhances GDNF and RET expression in pancreatic cancer cells, Mol Cell Biochem. (2011); 347:95–101; PMID:20960036; http://dx.doi.org/10.1007/s11010-010-0617-0
- DR Tomlinson, NJ Gardiner. Glucose neurotoxicity, Nat Rev Neurosci. (2008); 9:36–45; PMID:18094705; http://dx.doi.org/10.1038/nrn2294
- P Boucek. Advanced diabetic neuropathy: a point of no return?, Rev Diabet Stud. (2006); 3:143–50; PMID:17487338; http://dx.doi.org/10.1900/RDS.2006.3.143
- RA Malik, S Tesfaye, PG Newrick, D Walker, SM Rajbhandari, I Siddique, AK Sharma, AJM Boulton, RHM King, PK Thomas, et al. Sural nerve pathology in diabetic patients with minimal but progressive neuropathy, Diabetologia. (2005); 48:578–85; PMID:15729579; http://dx.doi.org/10.1007/s00125-004-1663-5
- LF Gumy, ETW Bampton, AM Tolkovsky. Hyperglycaemia inhibits Schwann cell proliferation and migration and restricts regeneration of axons and Schwann cells from adult murine DRG, Mol Cell Neurosci. (2008); 37:298–311; PMID:18024075; http://dx.doi.org/10.1016/j.mcn.2007.10.004
- JH Li, QY Ma, SG Shen, HT Hu. Stimulation of dorsal root ganglion neurons activity by pancreatic cancer cell lines, Cell Biol Int. (2008); 32:1530–5; PMID:18801449; http://dx.doi.org/10.1016/j.cellbi.2008.08.022
- GO Ceyhan, IE Demir, B Altintas, U Rauch, G Thiel, MW Muller, N. A Giese, H Friess, KH Schafer. Neural invasion in pancreatic cancer: A mutual tropism between neurons and cancer cells, Biochem Biophys Res Commun. (2008); 374:442–7; PMID:18640096; http://dx.doi.org/10.1016/j.bbrc.2008.07.035
- Z Gil, A Rein, P Brader, S Li, JP Shah, Y Fong, RJ Wong. Nerve-sparing therapy with oncolytic herpes virus for cancers with neural invasion, Clin Cancer Res. (2007); 13:6479–85; PMID:17975160; http://dx.doi.org/10.1158/1078-0432.CCR-07-1639
- DE Bockman. Nerves in the pancreas: what are they for?, Am J Surgery. (2007); 194:S61–4; http://dx.doi.org/10.1016/j.amjsurg.2007.05.028
- SH Jee, H Ohrr, JW Sull, JE Yun, M Ji, JM Samet. Fasting serum glucose level and cancer risk in Korean men and women, Jama-Journal of the American Medical Association. (2005); 293:194–202; http://dx.doi.org/10.1001/jama.293.2.194
- YS Zhan, L Feng, SH Tang, WG Li, M Xu, TF Liu, YF Zhou, YL Ma, Y Zhang, XM Pu. Glucose metabolism disorders in cancer patients in a Chinese population, Med Oncol. (2010); 27:177–84; PMID:19263254; http://dx.doi.org/10.1007/s12032-009-9189-9
- M Okumura, M Yamamoto, H Sakuma, T Kojima, T Maruyama, M Jamali, DR Cooper, K Yasuda. Leptin and high glucose stimulate cell proliferation in MCF-7 human breast cancer cells: reciprocal involvement of PKC-alpha and PPAR expression, Biochim Biophys Acta. (2002); 1592:107–16; PMID:12379472; http://dx.doi.org/10.1016/S0167-4889(02)00276-8
- M Yamamoto, NA Patel, J Taggart, R Sridhar, DR Cooper. A shift from normal to high glucose levels stimulates cell proliferation in drug sensitive MCF-7 human breast cancer cells but not in multidrug resistant MCF-7/ADR cells which overproduce PKC-beta II, Int J Cancer. (1999); 83:98–106; PMID:10449615; http://dx.doi.org/10.1002/(SICI)1097-0215(19990924)83:1%3c98::AID-IJC18%3e3.0.CO;2-V
- ME Larrieta, P Vital, A Mendoza-Rodriguez, M Cerbon, M Hiriart. Nerve growth factor increases in pancreatic beta cells after streptozotocin-induced damage in rats, Exp Biol Med. (2006); 231:396–402
- Y Zhang, CX Dang, QY Ma, Y Shimahara. Expression of nerve growth factor receptors and their prognostic value in human pancreatic cancer, Oncol Rep. (2005); 14:161–171; PMID:15944784
- ZW Zhu, J Kleeff, H Kayed, L Wang, M Korc, MW Buchler, H Friess. Nerve growth factor and enhancement of proliferation, invasion, and tumorigenicity of pancreatic cancer cells, Mol Carcinog. (2002); 35:138–47; PMID:12410565; http://dx.doi.org/10.1002/mc.10083
- J Ma, YM Jiang, YH Jiang, Y Sun, XM Zhao. Expression of nerve growth factor and tyrosine kinase receptor A and correlation with perineural invasion in pancreatic cancer, J Gastroenterol Hepatol. (2008): 23:1852–59; PMID:19120874; http://dx.doi.org/10.1111/j.1440-1746.2008.05579.x
- DW Zochodne. Diabetes mellitus and the peripheral nervous system: Manifestations and mechanisms, Muscle Nerve. (2007); 36:144–66; PMID:17469109; http://dx.doi.org/10.1002/mus.20785
- IE Demir, GO Ceyhan, U Rauch, B Altintas, M Klotz, MW Muller, MW Buchler, H Friess, KH Schafer. The microenvironment in chronic pancreatitis and pancreatic cancer induces neuronal plasticity, Neurogastroenterol Motil. (2010); 22:480-+; PMID:19912545; http://dx.doi.org/10.1111/j.1365-2982.2009.01428.x
- DE Bockman, M Buchler, HG Beger. Interaction of pancreatic ductal carcinoma with nerves leads to nerve damage, Gastroenterology. (1994); 107:219–30; PMID:8020665
- CK Chu, AE Mazo, M Goodman, V Egnatashvili, JM Sarmiento, CA Staley, JR Galloway, NV Adsay, S Jacobs, DA Kooby. Preoperative diabetes mellitus and long-term survival after resection of pancreatic adenocarcinoma, Ann Surgical Oncol. (2010); 17:502–13; http://dx.doi.org/10.1245/s10434-009-0789-6
- JH Li, QY Ma, H Liu, K Guo, F Li, W Li, LA Han, FF Wang, EX Wu. Relationship between neural alteration and perineural invasion in pancreatic cancer patients with hyperglycemia, Plos One. (2011); 6:e17385; PMID:21386984
